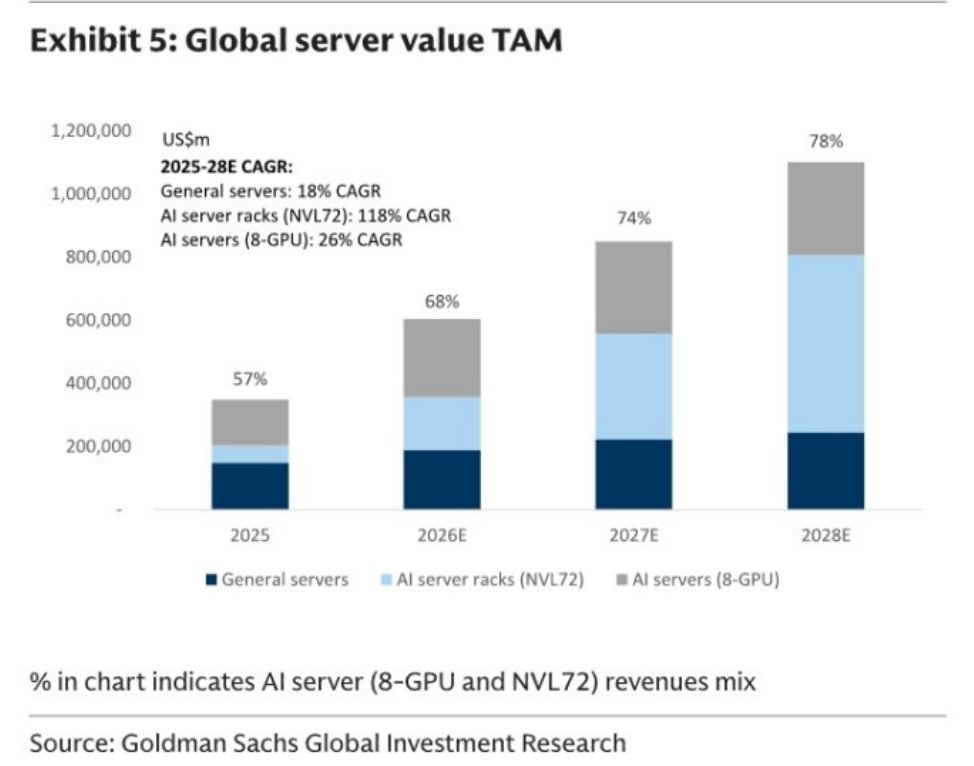
AI Servers to Reach 78% of Global Server Value by 2028, Up From 57% in 2025
Global server value TAM, 2025-2028E | AI server revenue mix rises from 57% in 2025 to 78% by 2028
English financial charts and market context published in 2026-09, page 36.
Global server value TAM, 2025-2028E | AI server revenue mix rises from 57% in 2025 to 78% by 2028
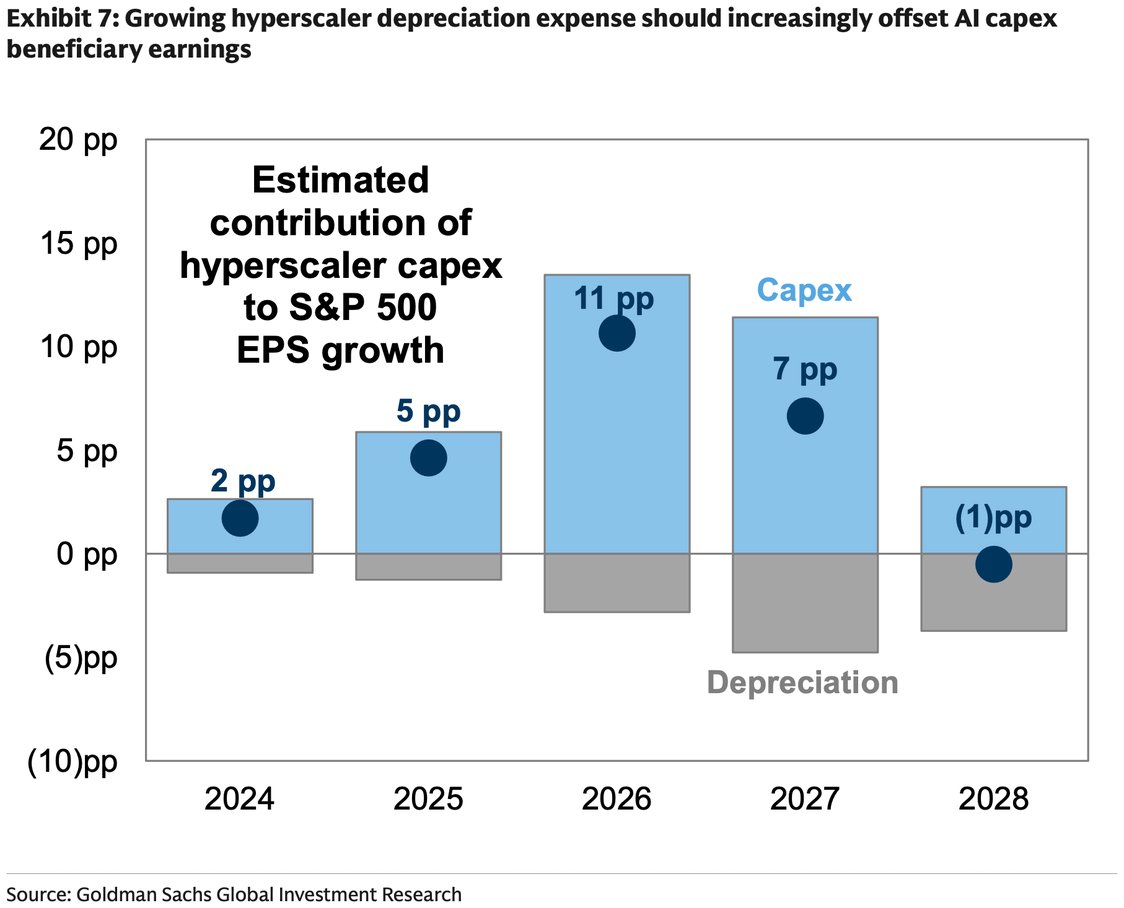
Estimated hyperscaler capex contribution to S&P 500 EPS growth | Peaks at 11pp in 2026 before depreciation drags it to -1pp by 2028
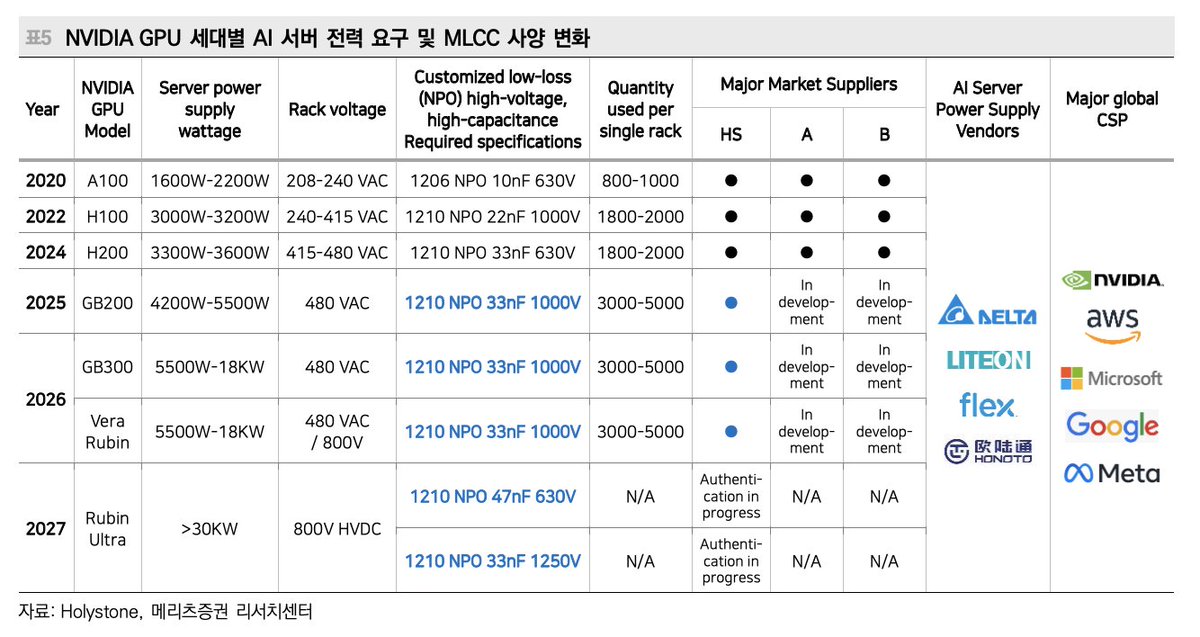
NVIDIA GPU generations: server power and MLCC specs | Server wattage climbs from about 2.2KW on the A100 to over 30KW on the 2027 Rubin Ultra
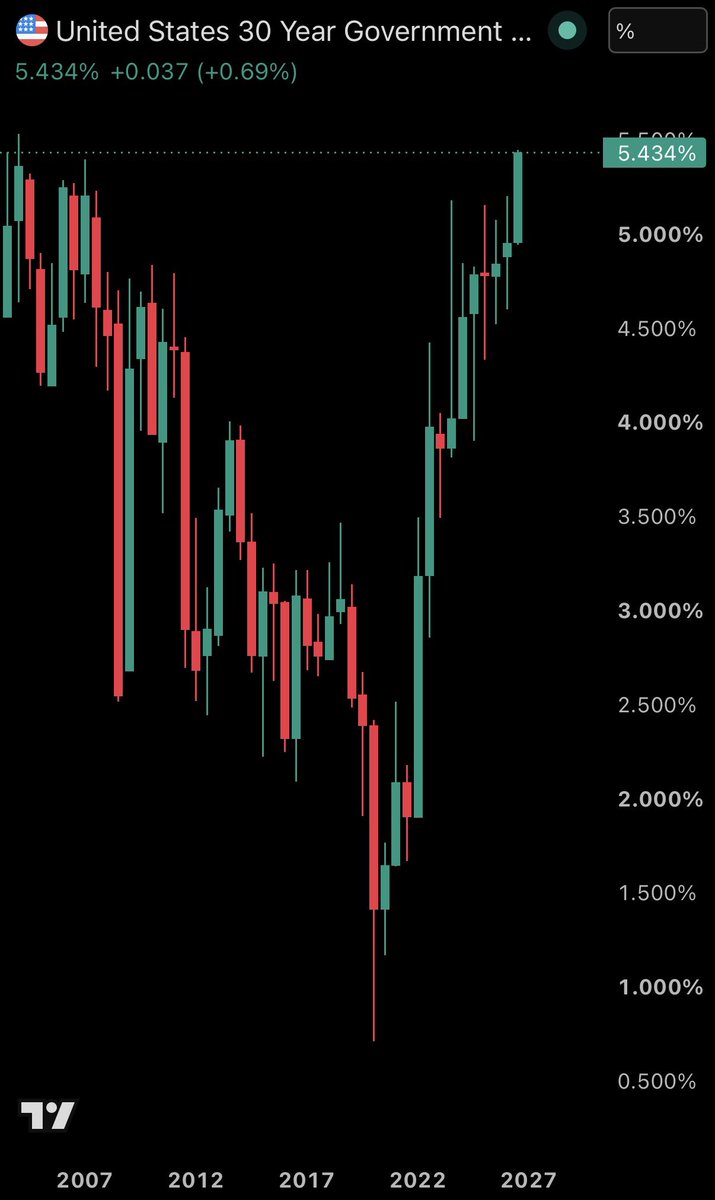
US 30-year government bond yield, monthly | Now 5.434%, up from the 2020 low to the highest since 2004
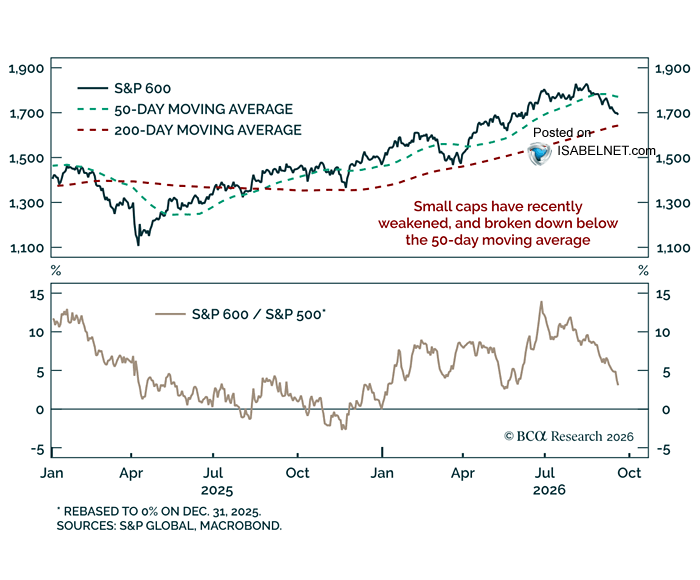
S&P 600 with moving averages and its ratio to the S&P 500 | Small caps break below the 50-day average, with relative strength rolling over from a mid-year high
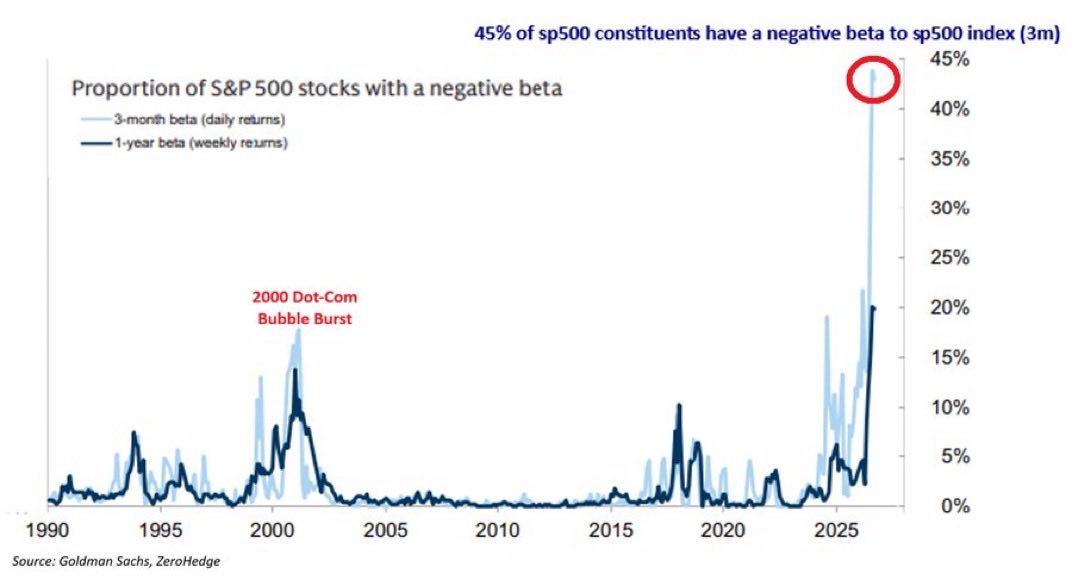
Share of S&P 500 stocks with a negative beta, 1990-2026 | 3-month beta now 45%, well above the ~18% dot-com bubble peak
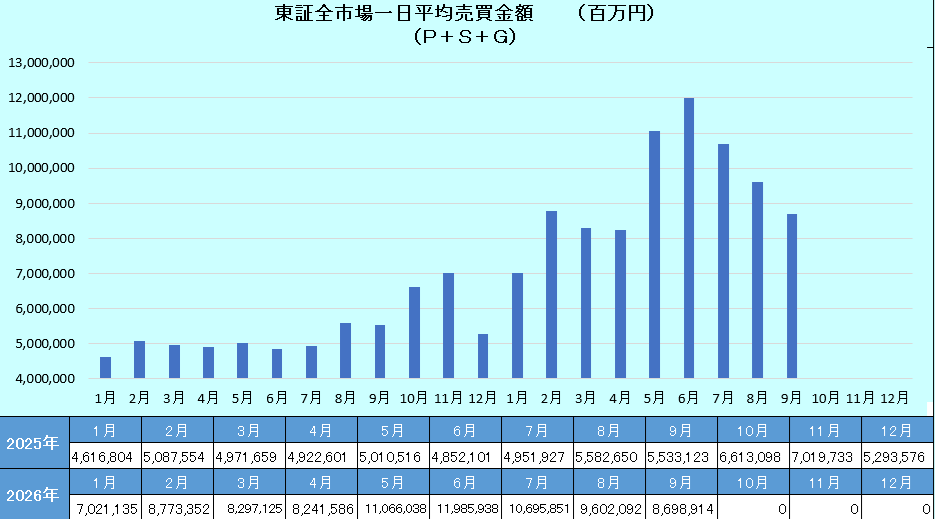
TSE all-market daily average turnover, ¥mn | About ¥12tn in June 2026, roughly 2.5x the ¥4.85tn a year earlier
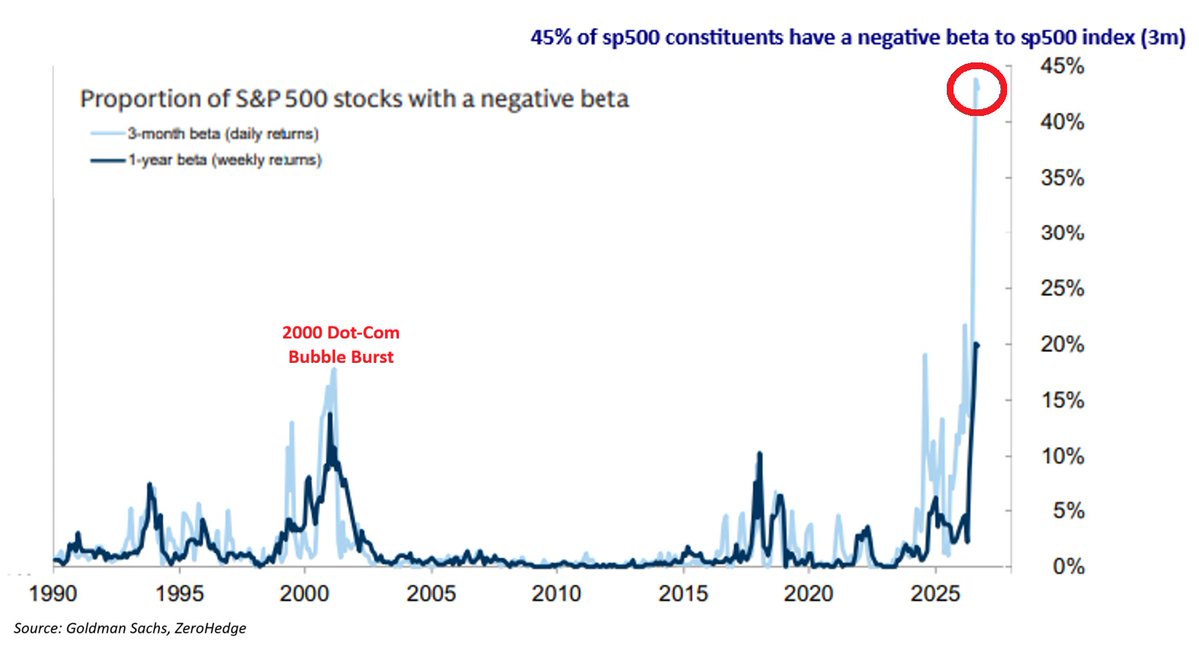
Proportion of S&P 500 stocks with a negative beta | The 3-month measure hits 45%, roughly double the ~18% seen at the 2000 dot-com peak
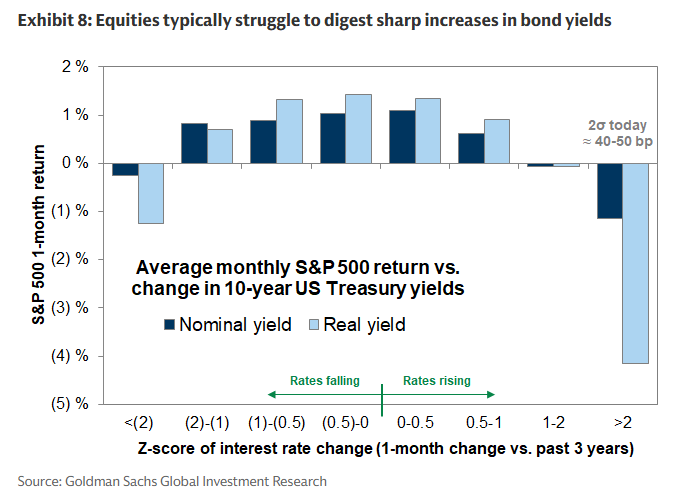
Average monthly S&P 500 return by size of 10-year yield move | In the greater-than-2-sigma bucket, the real-yield reading averages about -4.3%
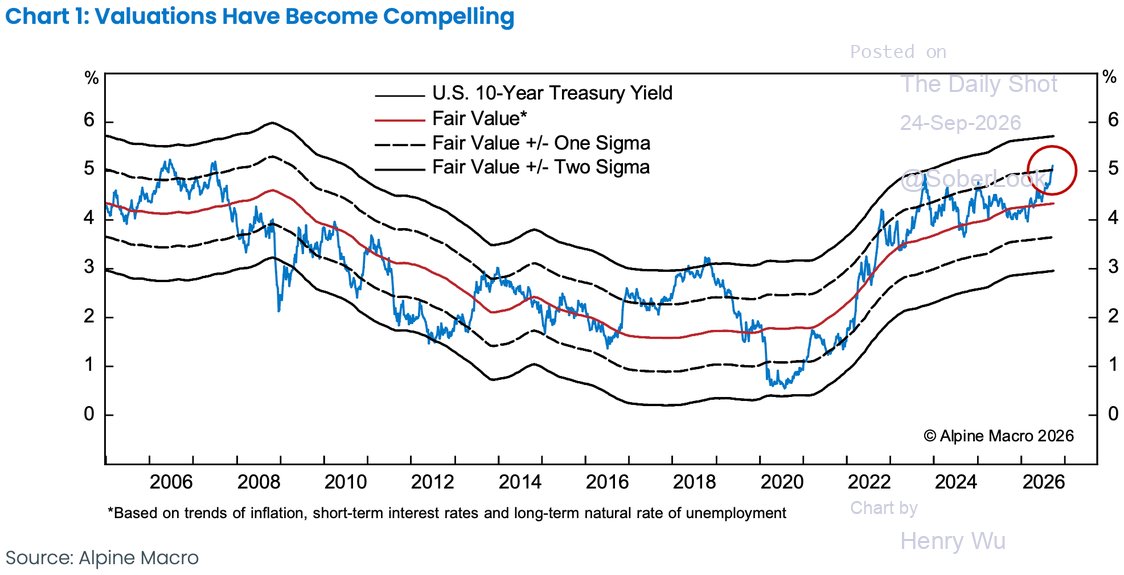
US 10-year Treasury yield vs Alpine Macro fair-value model, 2005-2026 | Now near 5%, above the +1 sigma band
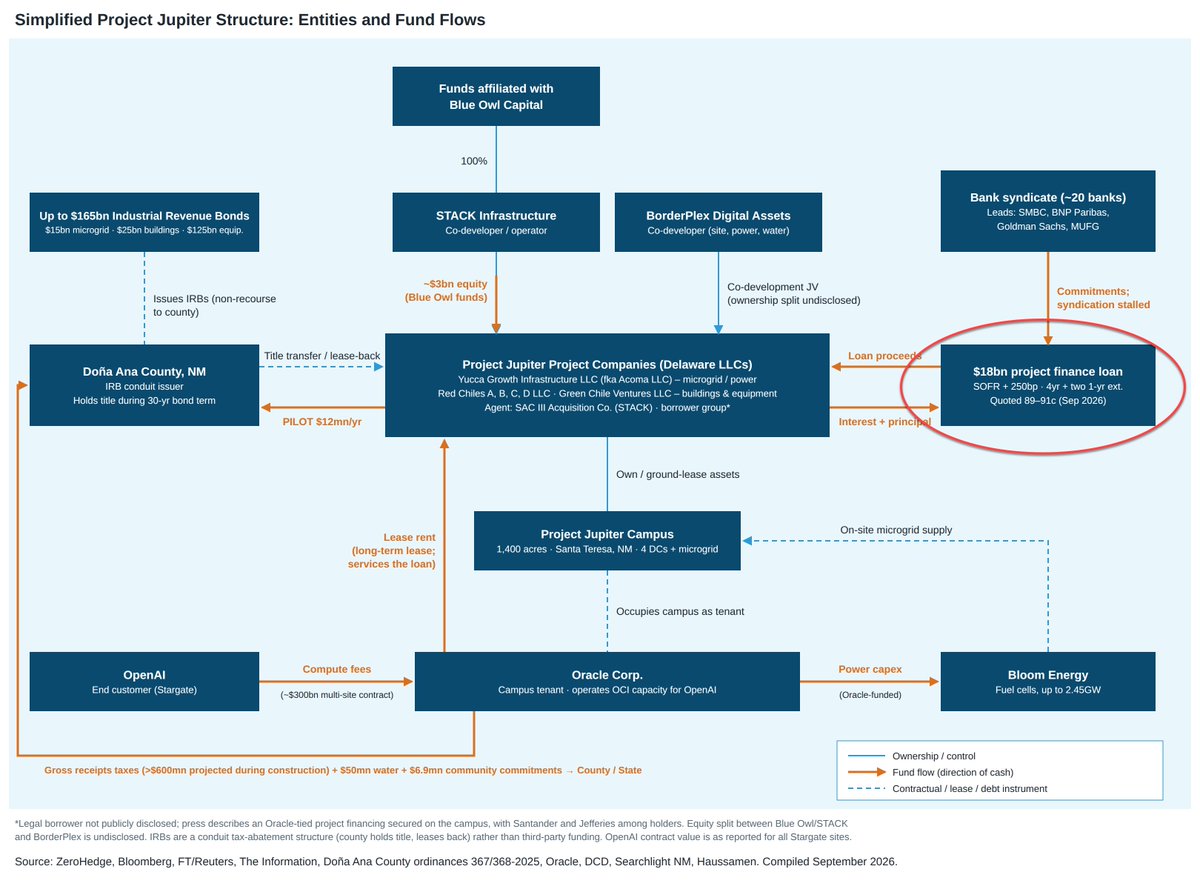
Project Jupiter entity and fund-flow structure | $18bn project finance loan quoted at 89-91 cents on the dollar in September 2026, below par
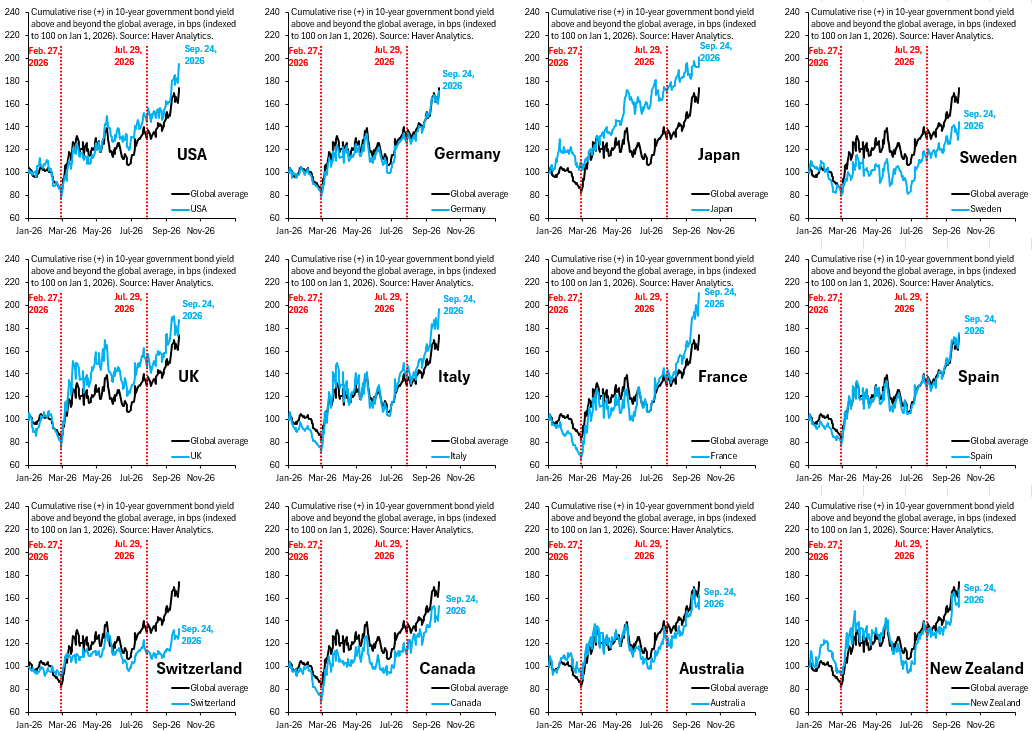
Cumulative rise in 10-year government bond yields versus the global average across 12 countries | High-debt France, Italy and the UK outpace the global average
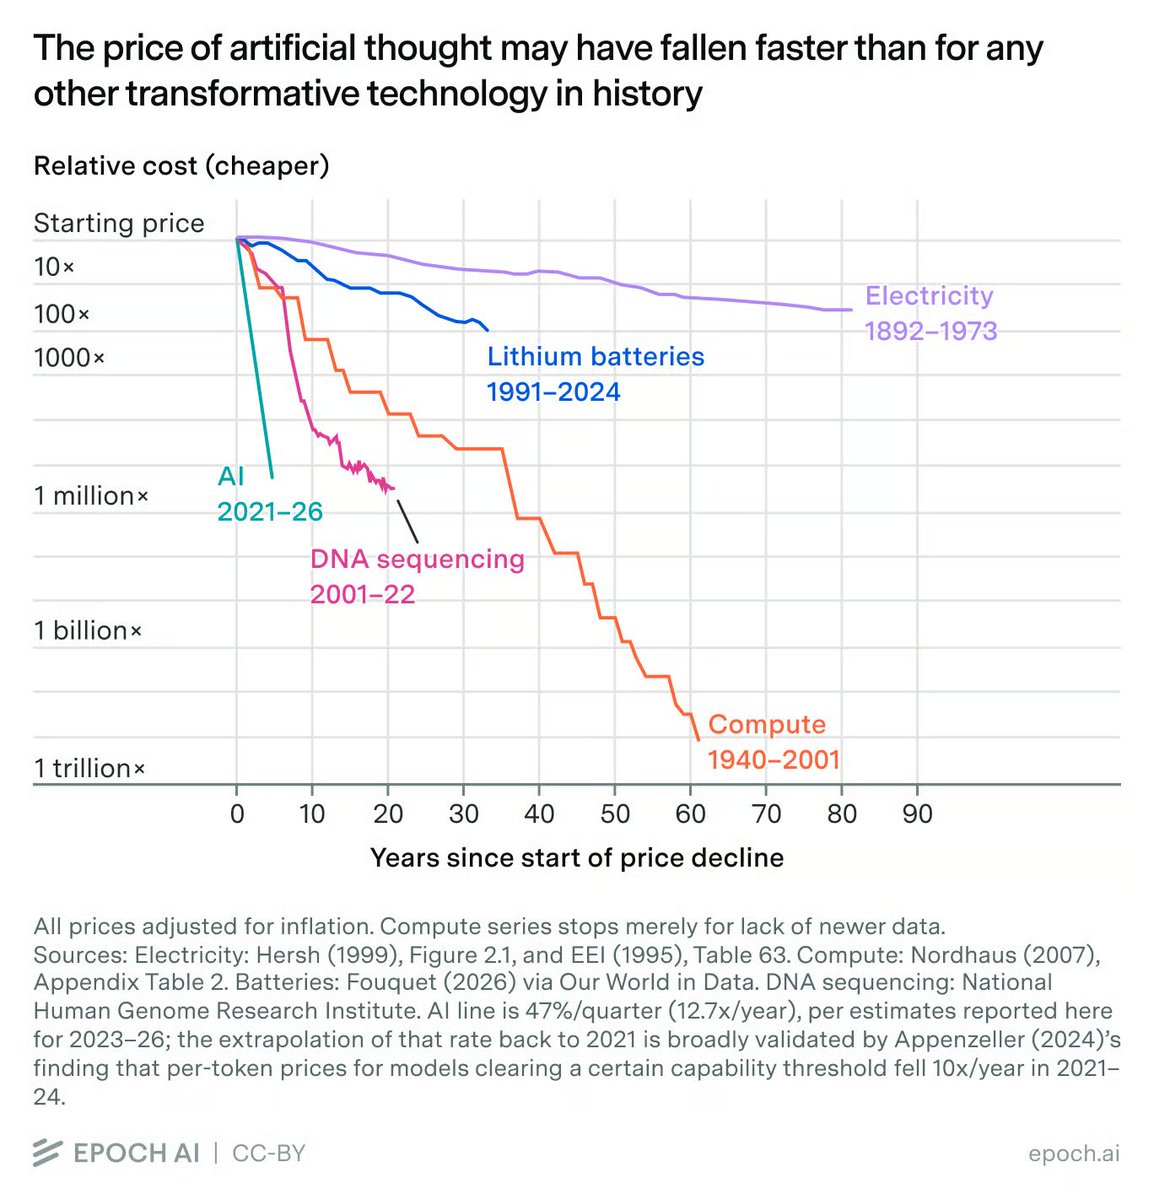
Relative cost decline of transformative technologies, log scale | AI falling ~12.7x/year, steeper than compute, batteries or DNA sequencing
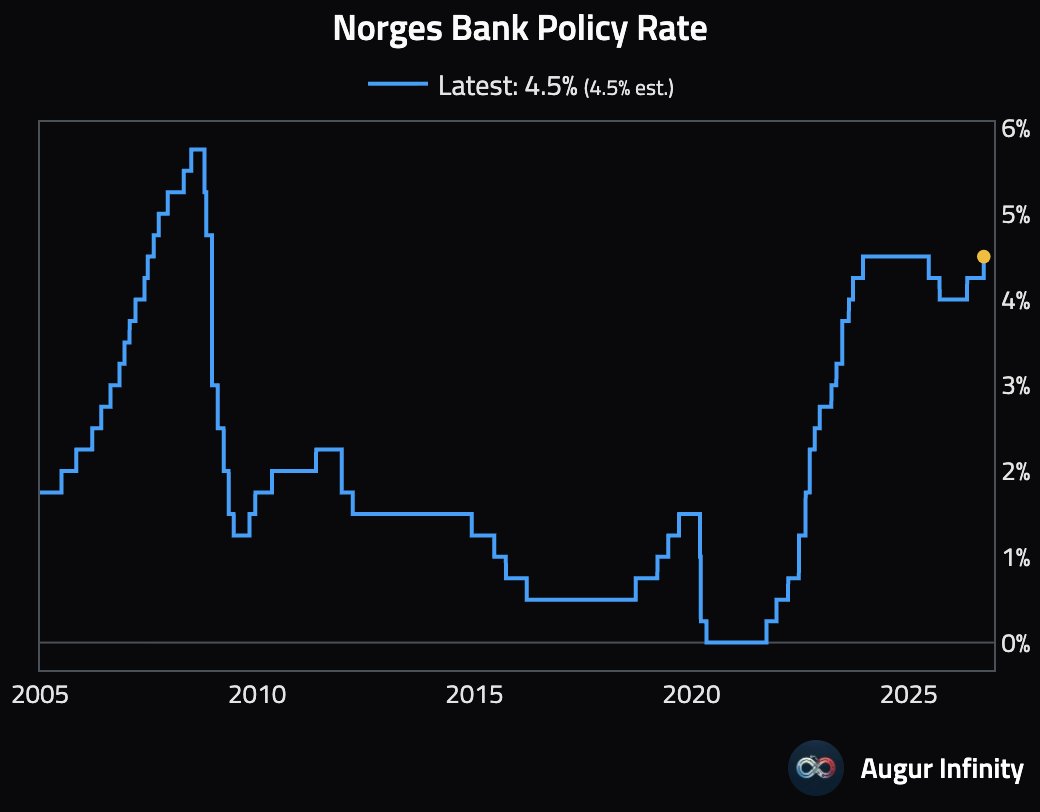
Norges Bank policy rate since 2005 | Latest hike to 4.5% from 4.25%, back near the 2024 cycle peak
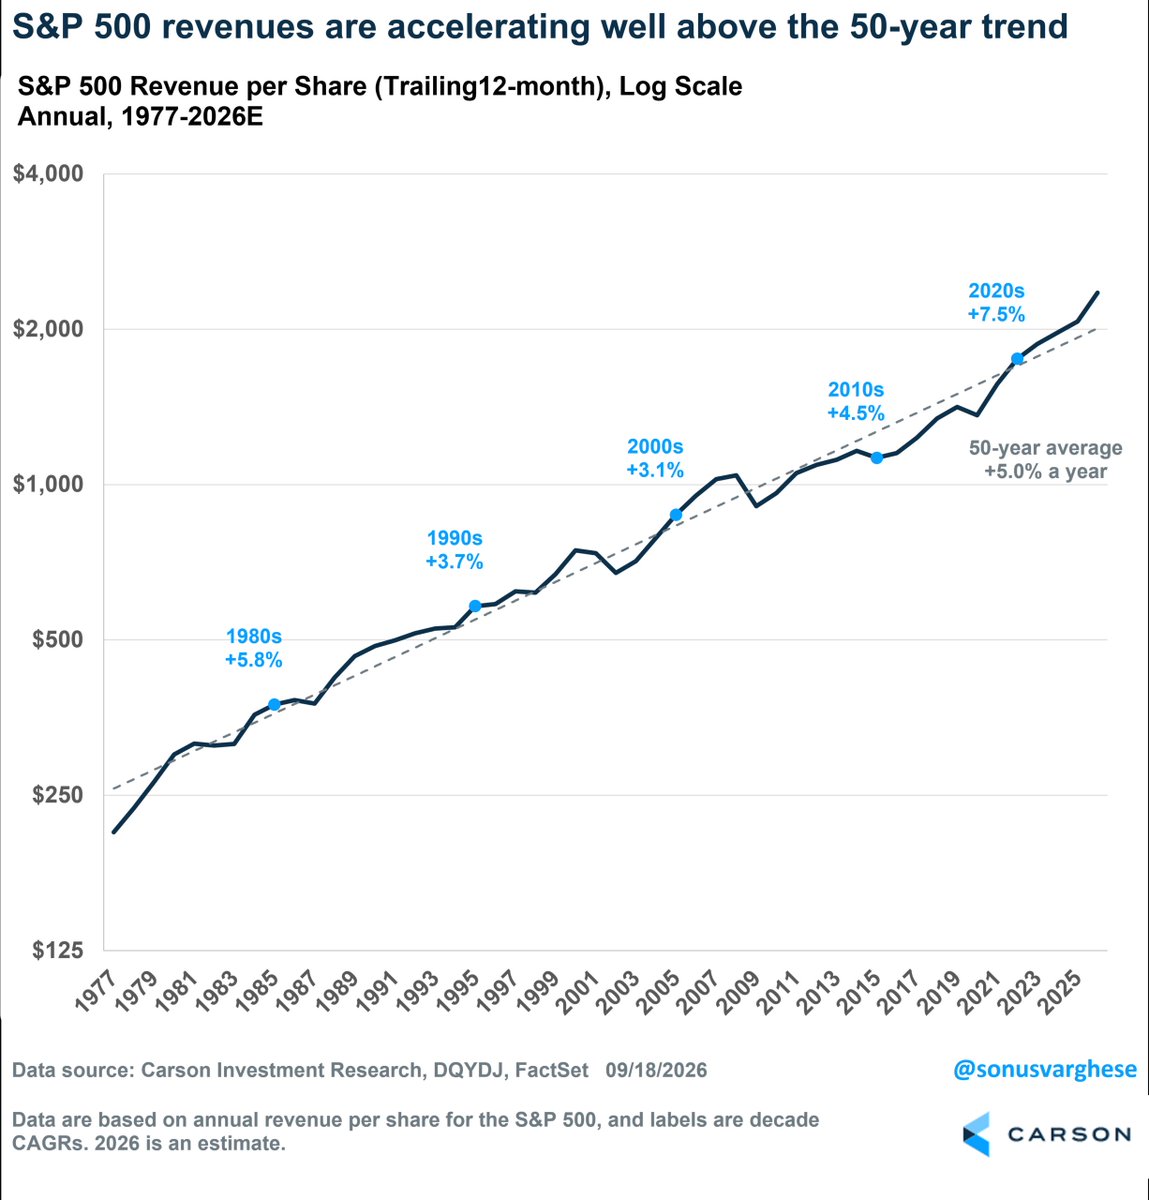
S&P 500 revenue per share, TTM, log scale, 1977-2026E | 2020s growing 7.5%/yr, above the 5.0% 50-year average and the 1990s' 3.7%
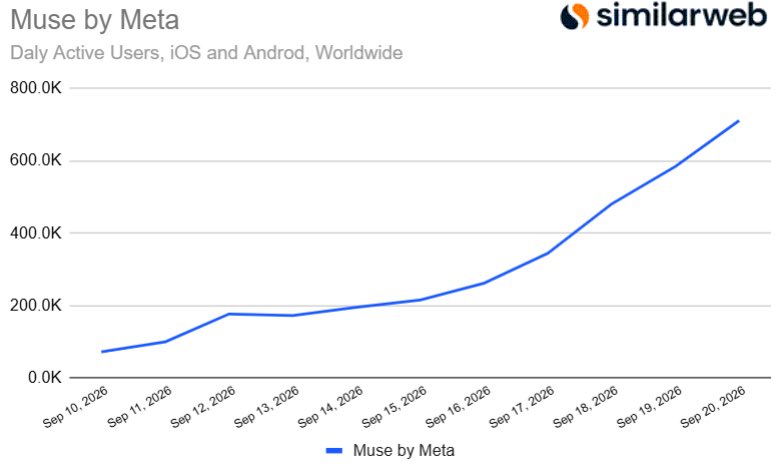
Muse by Meta daily active users, iOS and Android worldwide | Up from about 70K to 710K between Sept 10 and Sept 20, still under one million
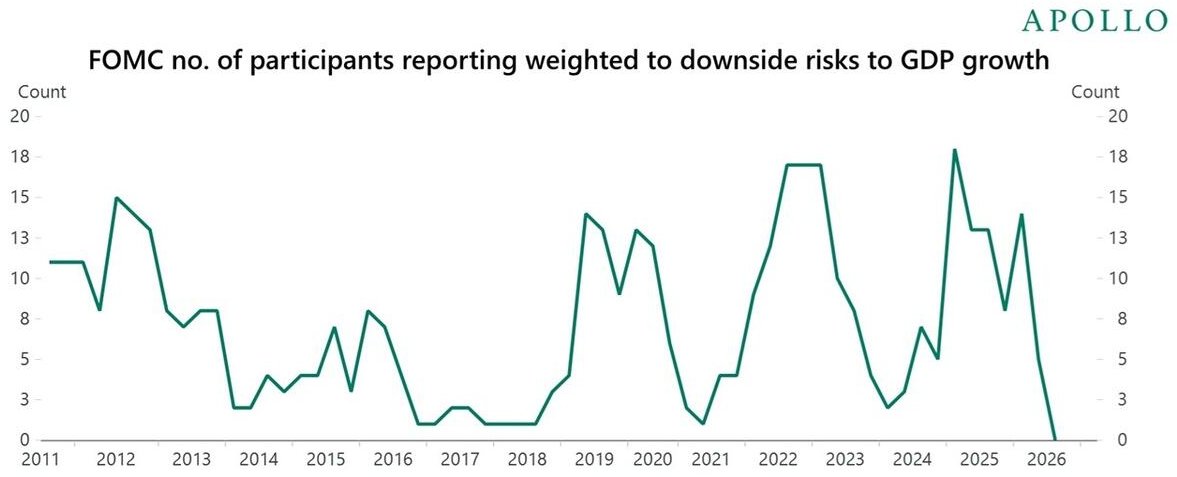
Number of FOMC participants weighting GDP-growth risks to the downside | Latest drops to zero, the first since at least 2011, after peaking near 18 in 2024
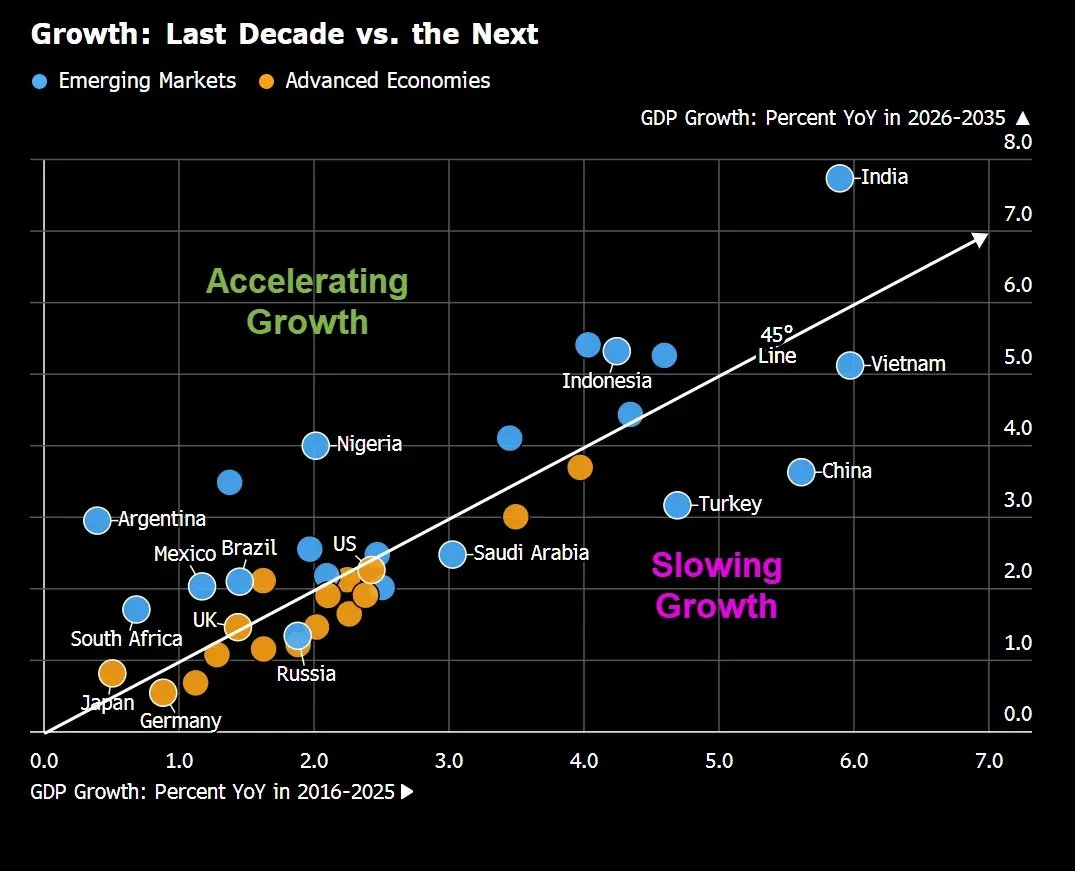
GDP growth by country, 2016-2025 vs projected 2026-2035, split by the 45° line | India highest at over 7%; China and Vietnam fall into slowing growth
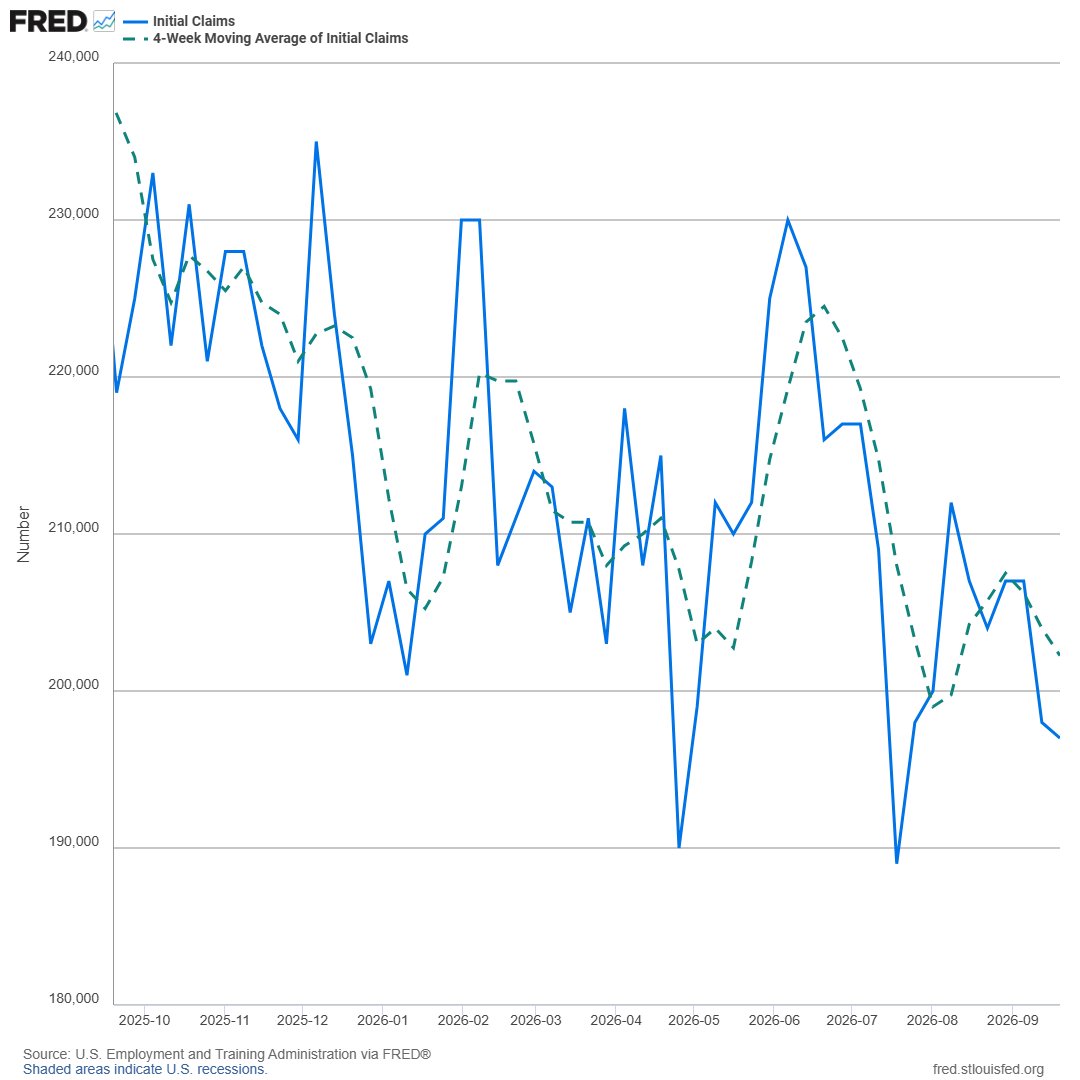
US weekly initial jobless claims and four-week average | 197,000 in the week of Sept 19, four-week average down to 202,250
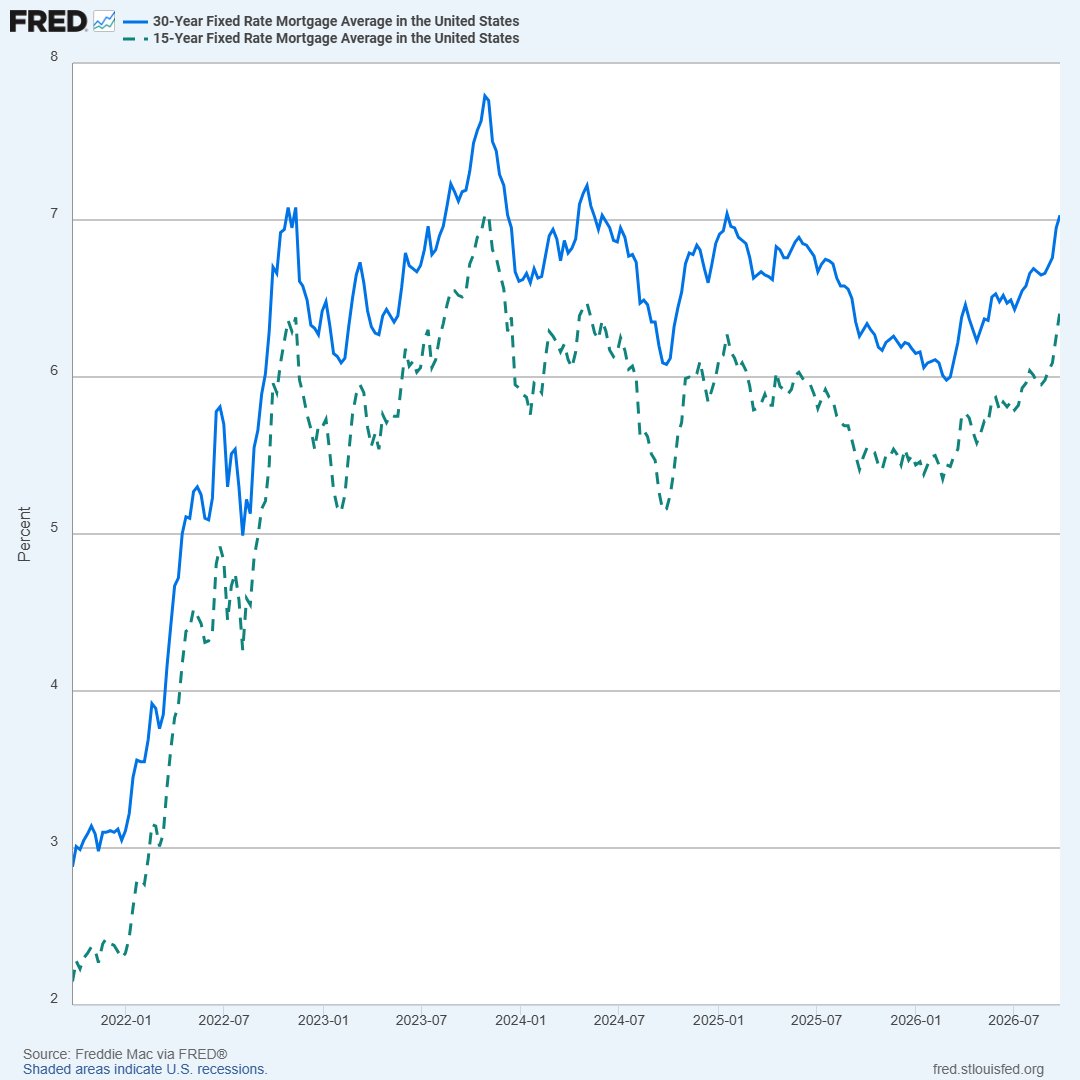
US 30-year and 15-year fixed mortgage rates, 2022-2026 | 30-year at 7.03%, highest since January 2025; 15-year at 6.42%
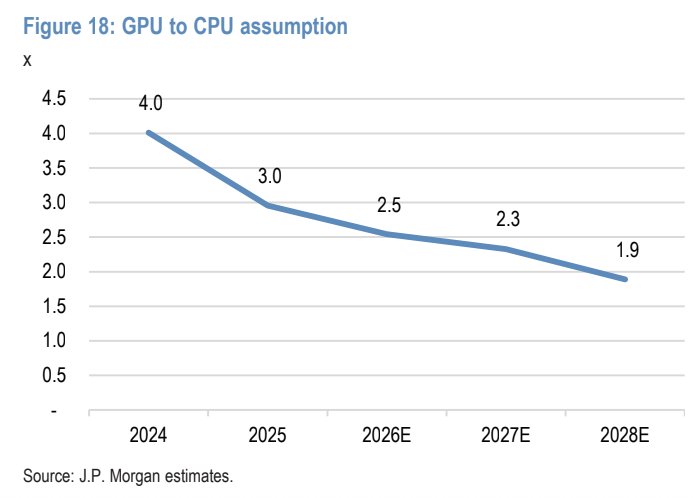
Data-center GPU-to-CPU ratio assumption, 2024-2028E | Down from 4.0 in 2024 to 3.0 in 2025, and an estimated 1.9 by 2028
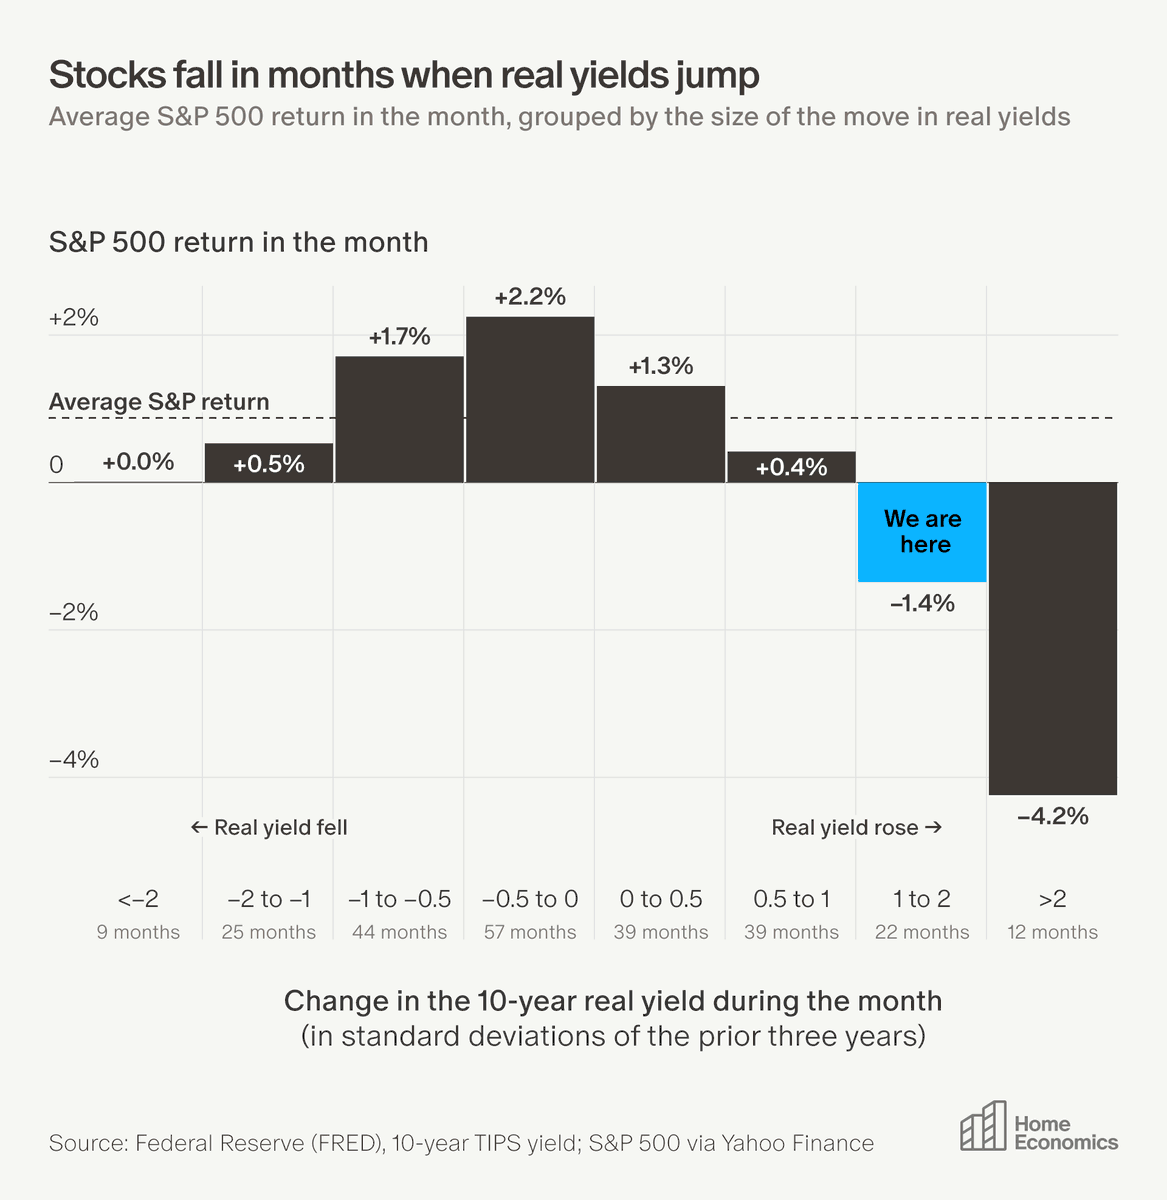
Average monthly S&P 500 return by size of the 10-year real-yield move | -1.4% for a 1-2 sigma rise, -4.2% for over 2 sigma
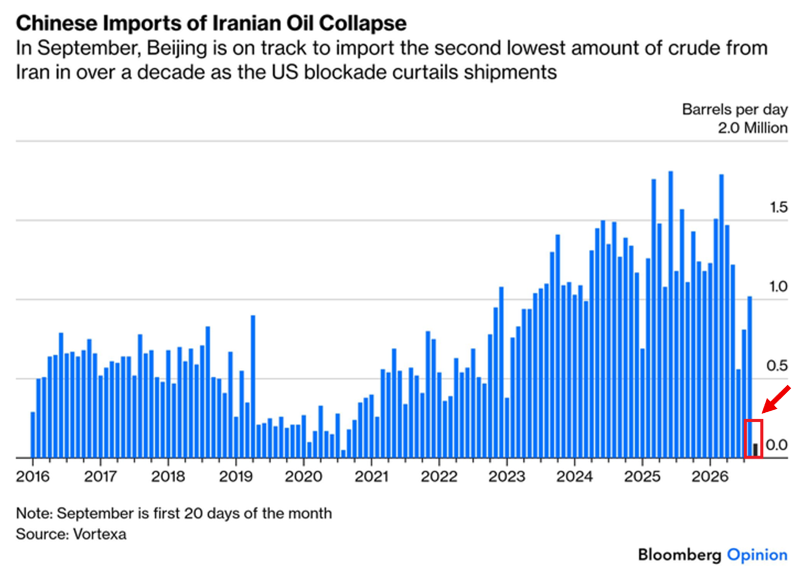
China's imports of Iranian crude, barrels per day, 2016-2026 | September's first 20 days fall to ~80,000 b/d, down over 90% from 1.0-1.5 million pre-war
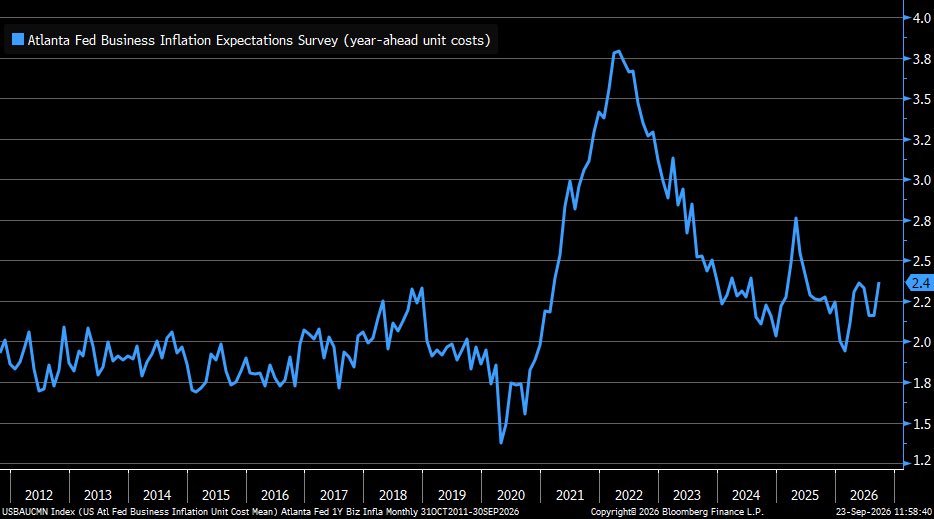
Atlanta Fed business inflation expectations, year-ahead unit costs, 2011-2026 | Rises to 2.4% in September from 2.2%, below the ~3.8% 2022 peak
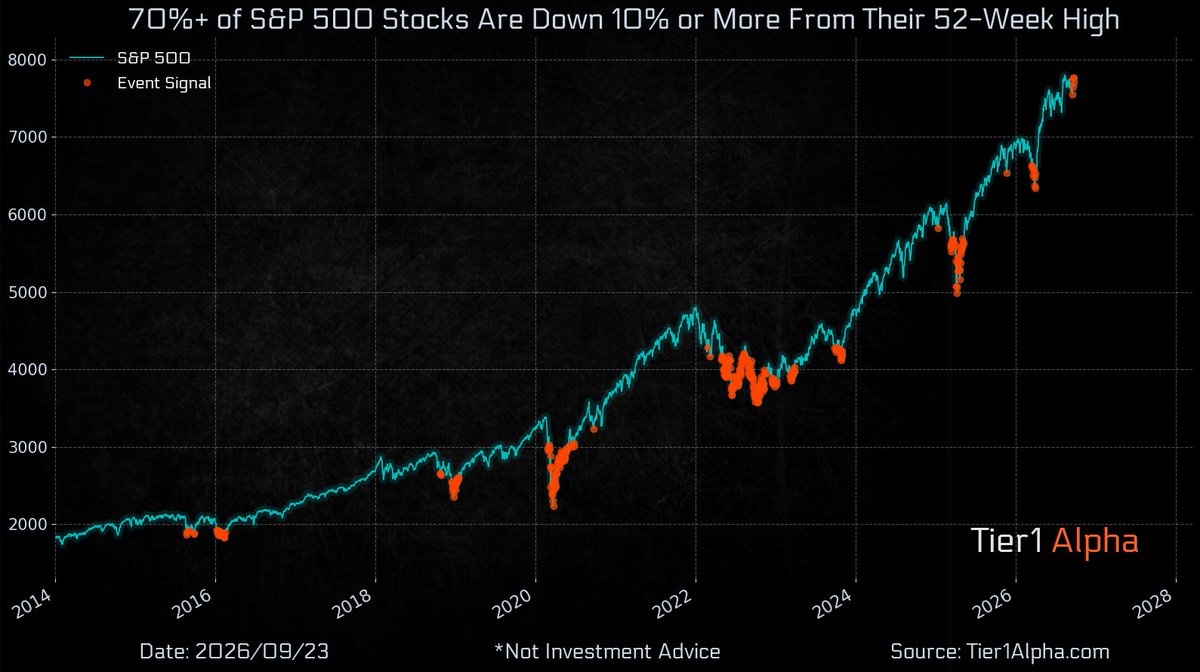
S&P 500 with breadth event signals, 2014-2026 | Now over 70% of members are down 10%+ from 52-week highs even as the index holds near record highs
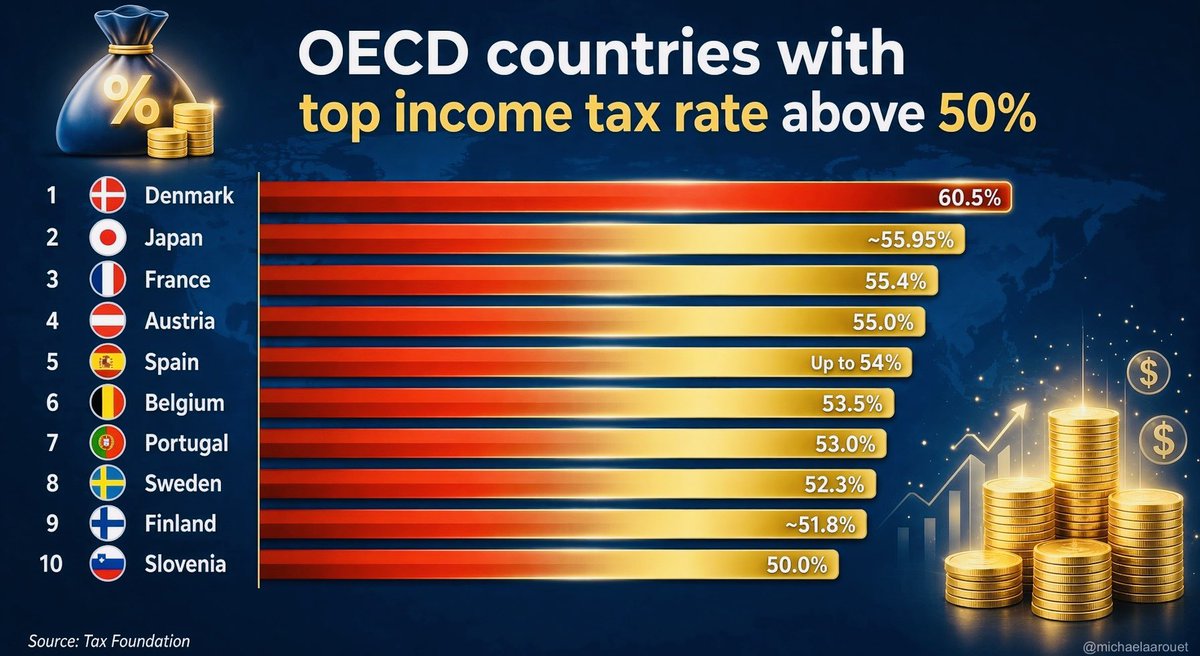
OECD countries with top income-tax rates above 50% | Denmark tops the list at 60.5%, followed by Japan (about 55.95%) and France (55.4%)
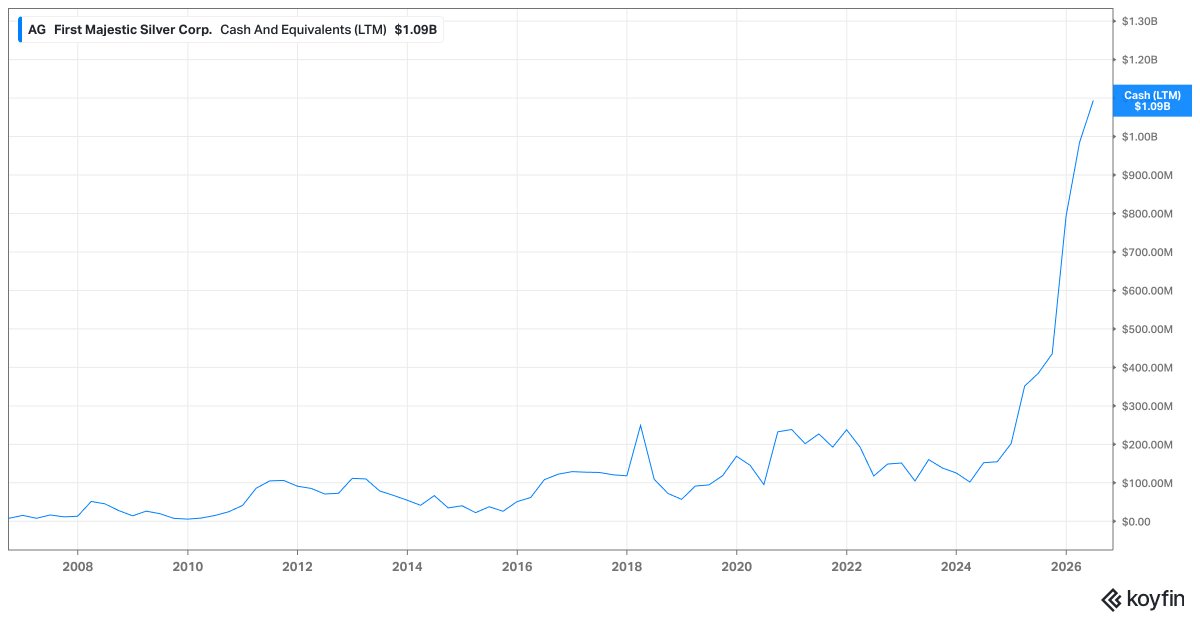
First Majestic Silver cash and equivalents, trailing 12 months (2007-2026) | Now at $1.09B, an all-time high, reflecting surging miner cash during the precious-metals rally
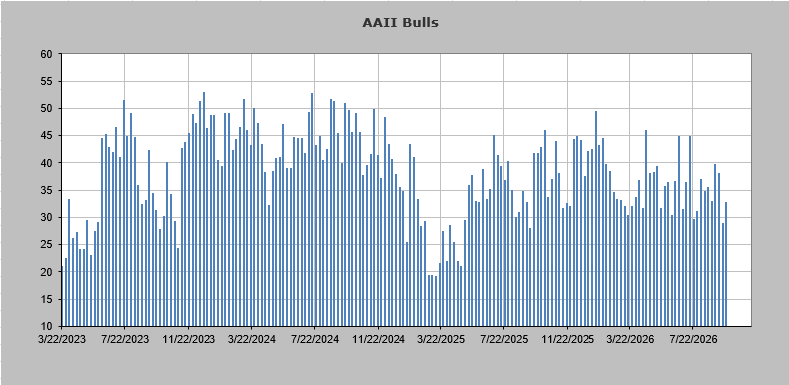
AAII individual-investor bullish share, weekly, 2023-2026 | Latest rebounds to 32.7% from 28.8%, still under the 37.5% long-term average
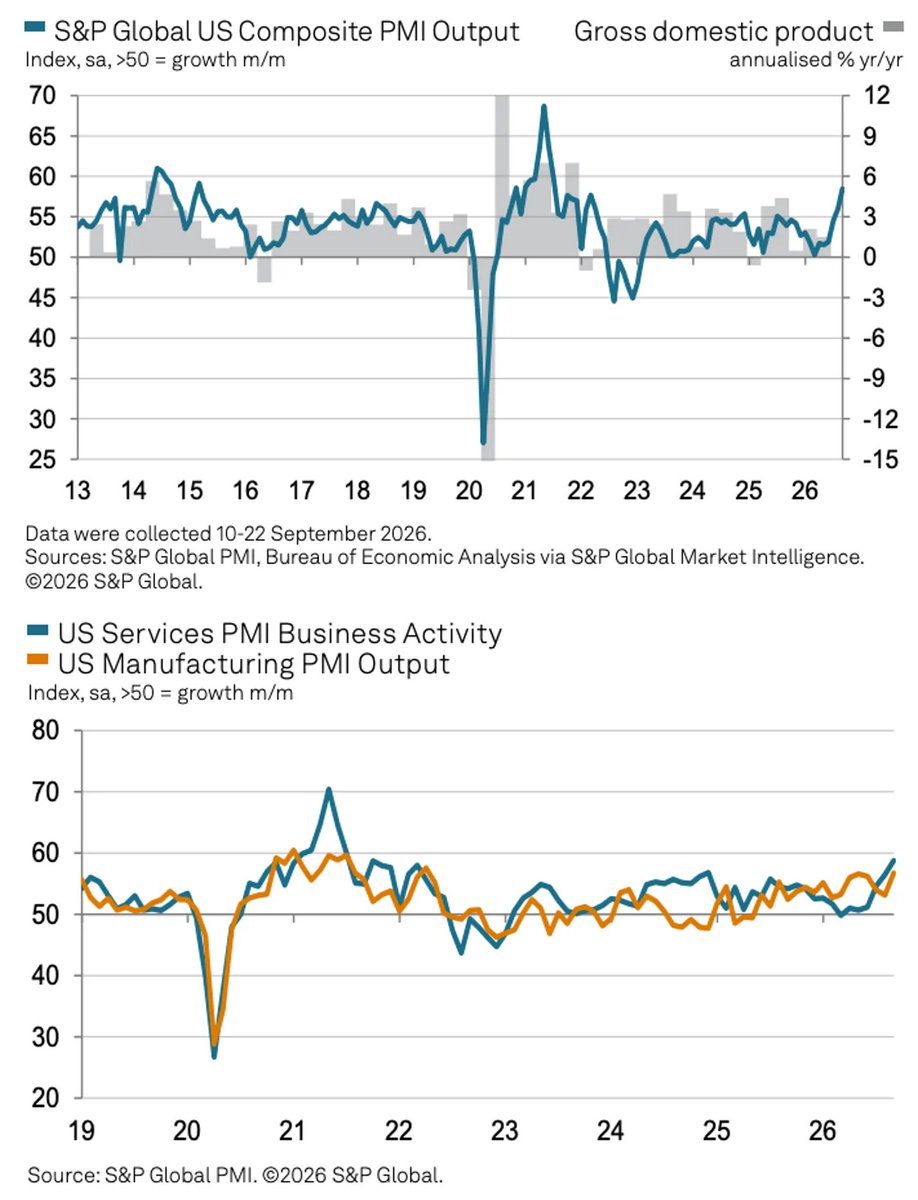
US composite PMI with GDP, and services vs manufacturing PMI (S&P Global) | The September composite PMI rose to around 58, the fastest expansion since 2015 apart from the post-Covid reopening
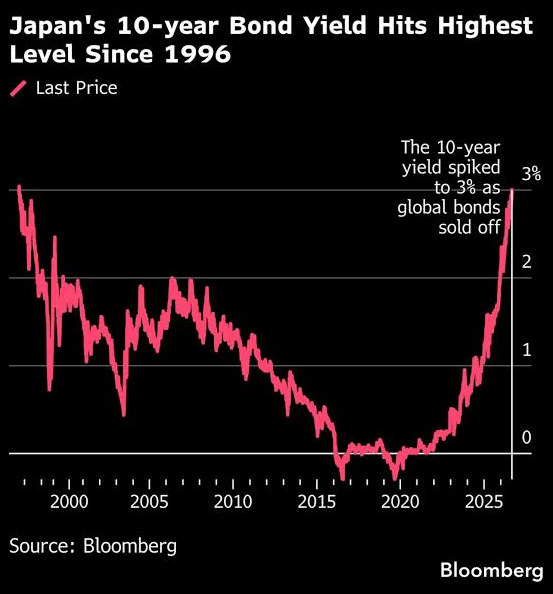
Japan 10-year government bond yield, % | Yield spiked to 3% amid a global bond selloff, the highest since 1996
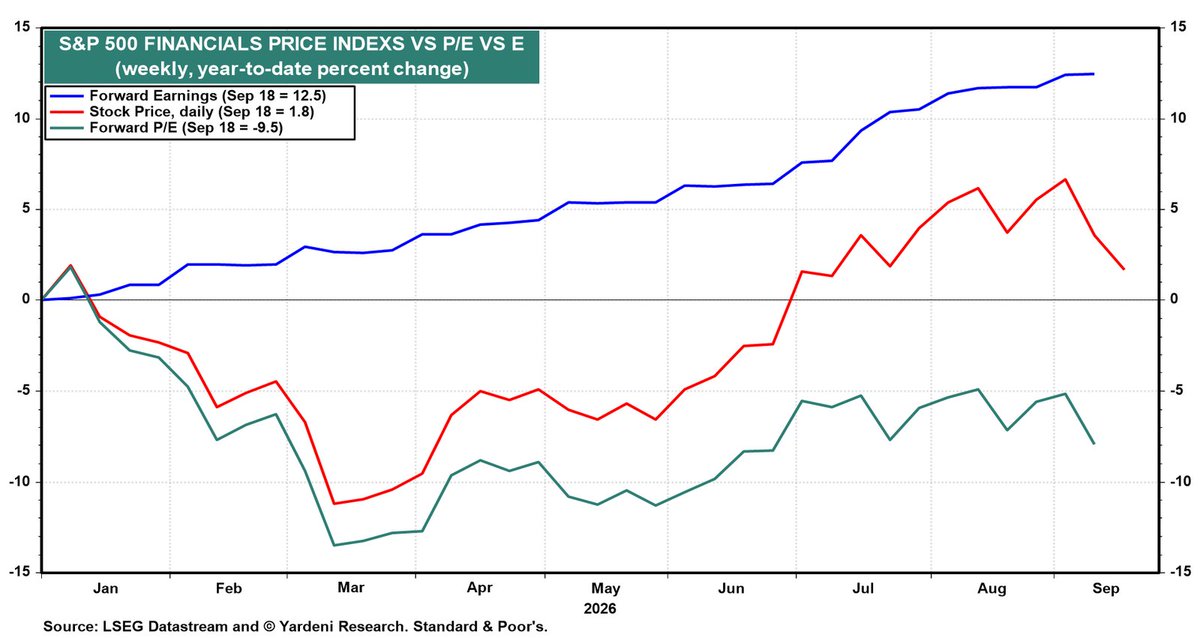
S&P 500 financials: forward earnings, price and P/E, YTD % | Forward earnings +12.5% but price only +1.8% as the forward P/E fell 9.5%
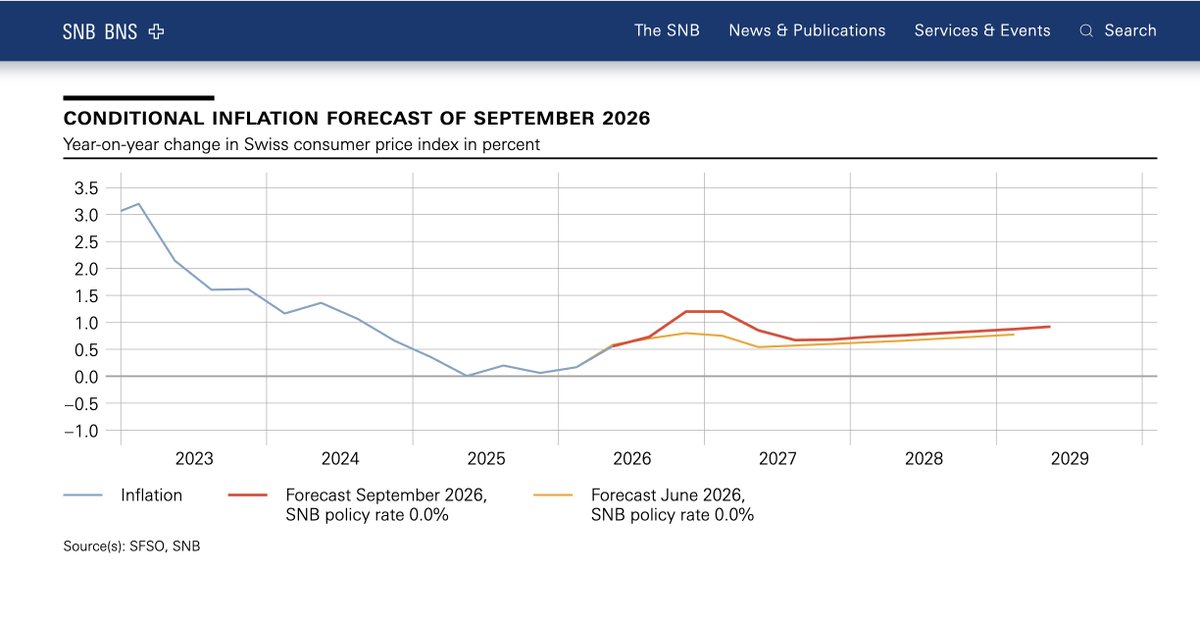
Swiss CPI YoY and SNB conditional forecast, % | SNB projects inflation of 0.7% in 2026 and 0.8% in 2027-2028, far below 2023's 3%+
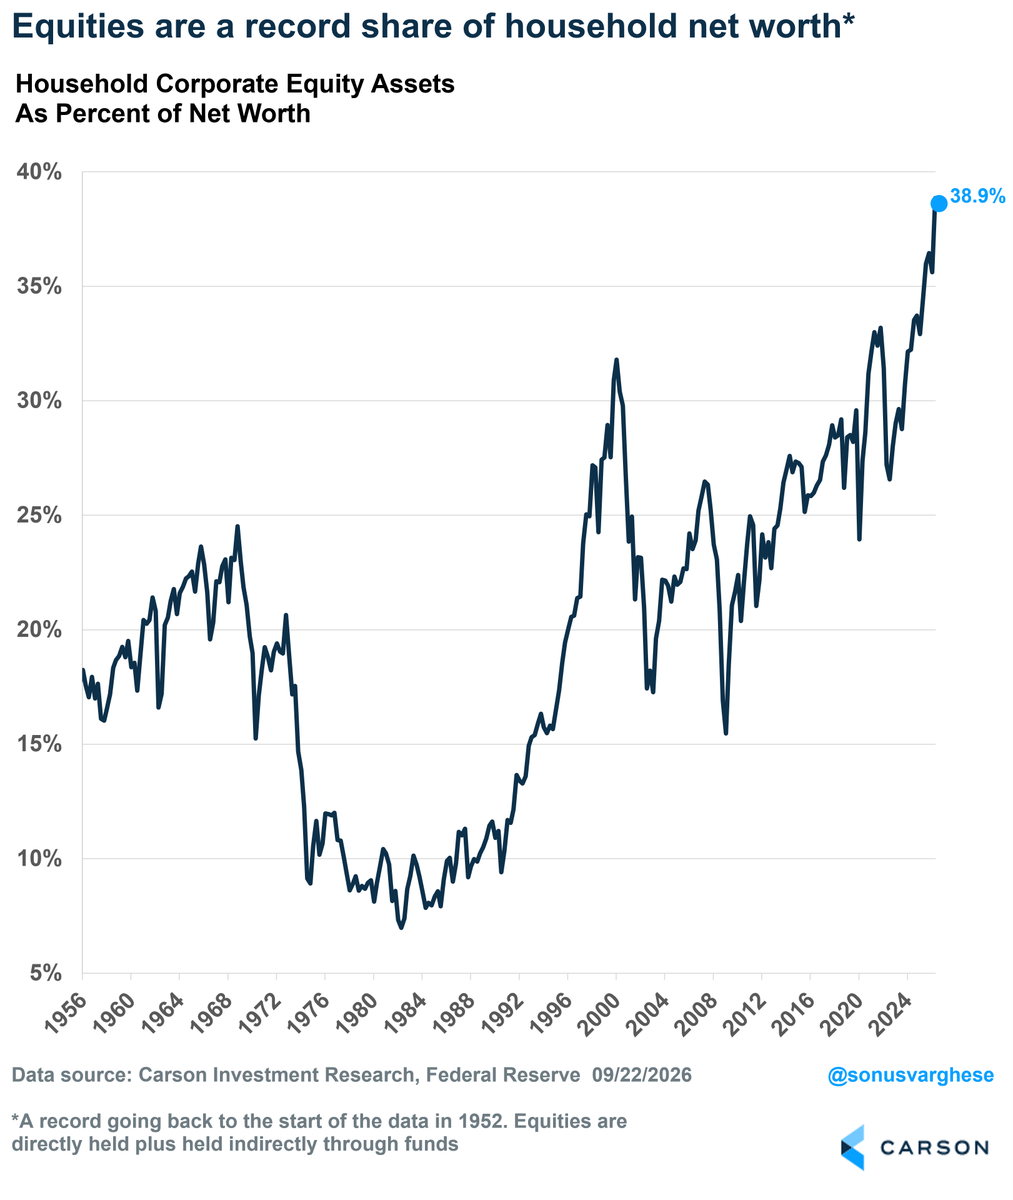
US household corporate equity assets as a share of net worth (1956-2026) | Now 38.9%, the highest since data began in 1952 and above the 2000 dot-com peak
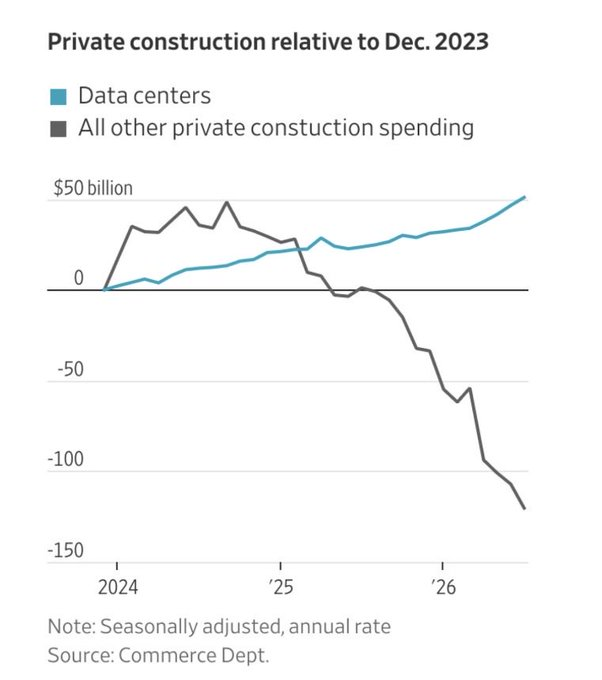
US private construction spending vs Dec 2023 | Data centers up about $50B while all other private construction fell more than $120B
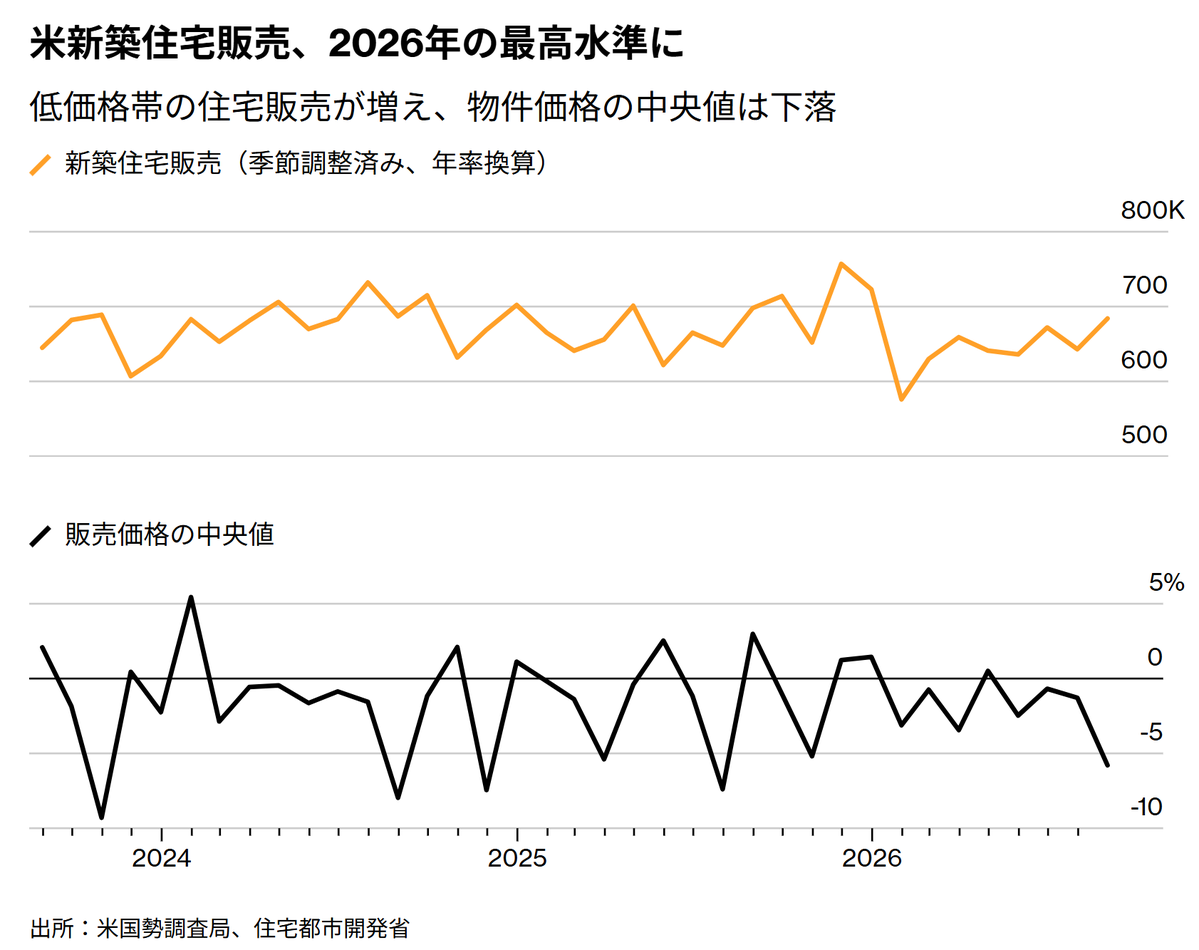
US new home sales and median sale price change, 2024-2026 | Sales (annualized) rise to ~660K, a 2026 high, while median price change turns to ~-6%
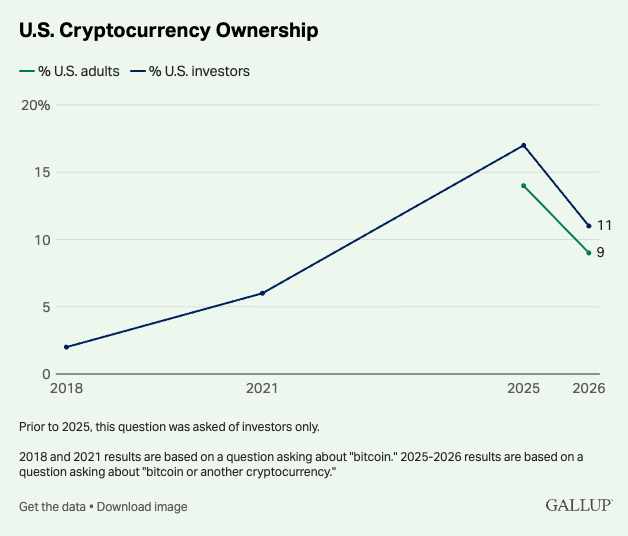
US cryptocurrency ownership, investors and adults, 2018-2026 | Investor share falls to 11% in 2026 from 17% in 2025, still above 2% in 2018
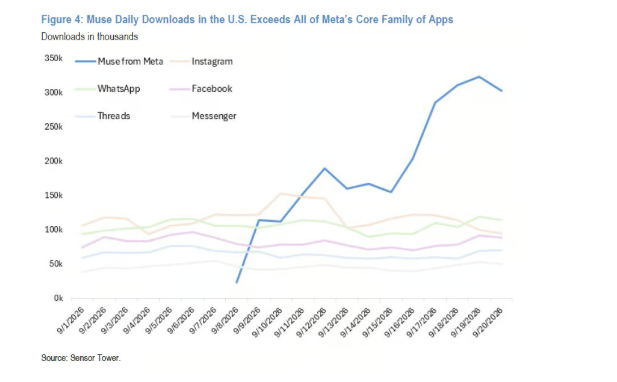
US daily downloads of Meta apps, thousands | Muse reached about 310k daily downloads, surpassing Instagram, WhatsApp and Facebook
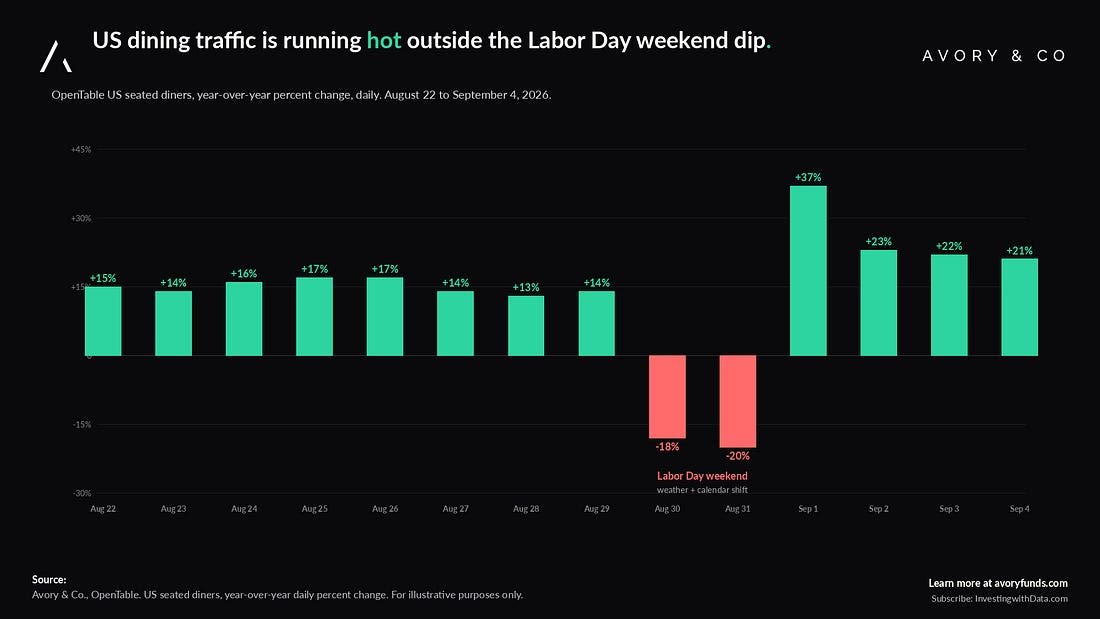
US OpenTable seated diners, YoY % change (daily) | Most days ran +13-17% YoY, with Sep 1 up 37% after a brief Labor Day dip
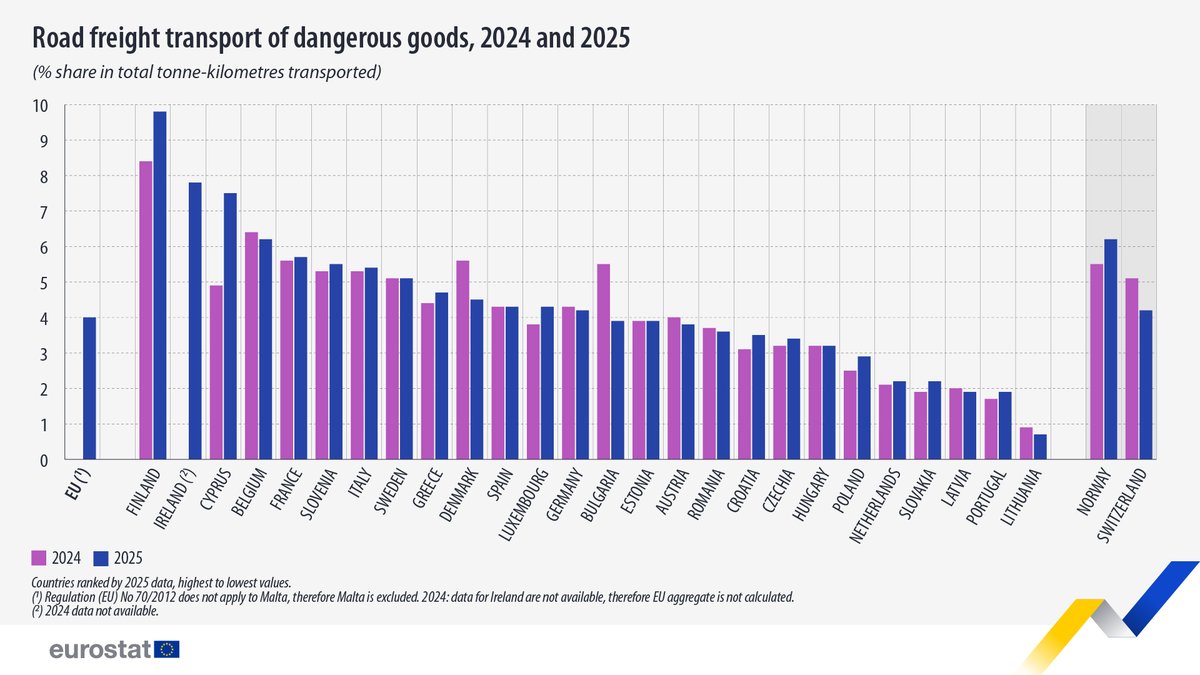
Dangerous goods as a share of road freight tonne-km by country (2024 and 2025) | In 2025 Finland led at 9.8% and Lithuania was lowest at 0.7%, with the EU around 4%
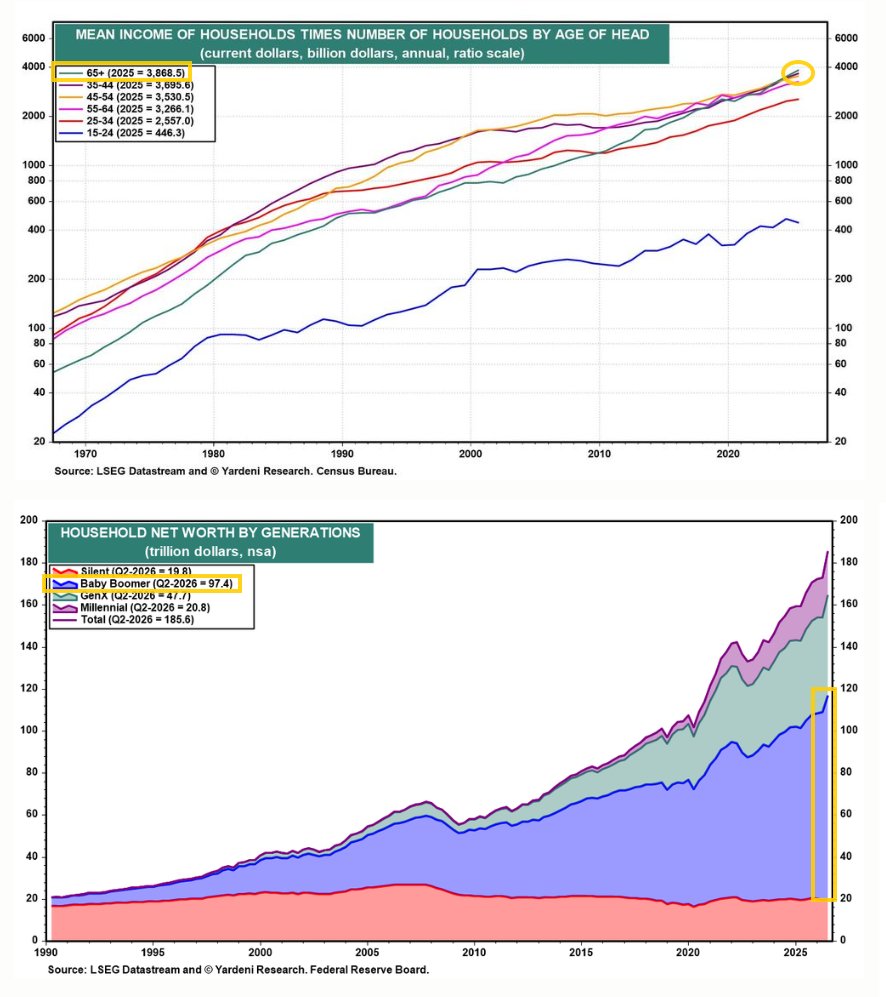
US household income by age and net worth by generation (Yardeni, two panels) | The 65+ group earned $3.87tn in 2025, the most of any cohort, while Baby Boomer net worth reached $97.4tn
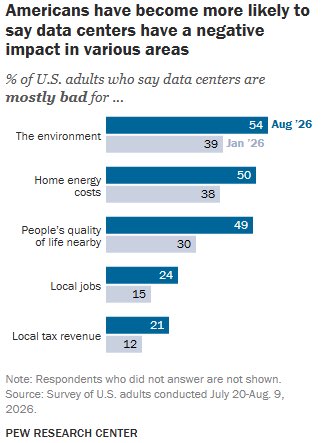
Share of US adults who say data centers are mostly bad for each area | 54% now cite the environment, up from 39% in January, with home energy costs at 50%
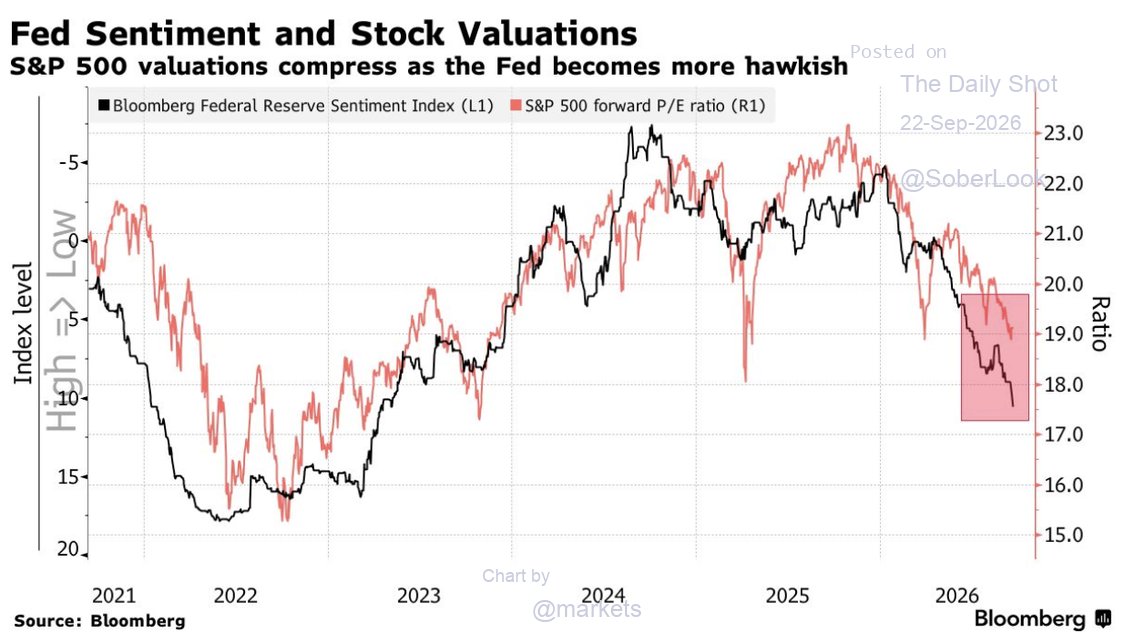
Bloomberg Fed sentiment index vs S&P 500 forward P/E | Forward P/E compressed from above 23x to about 18x as the Fed turned hawkish
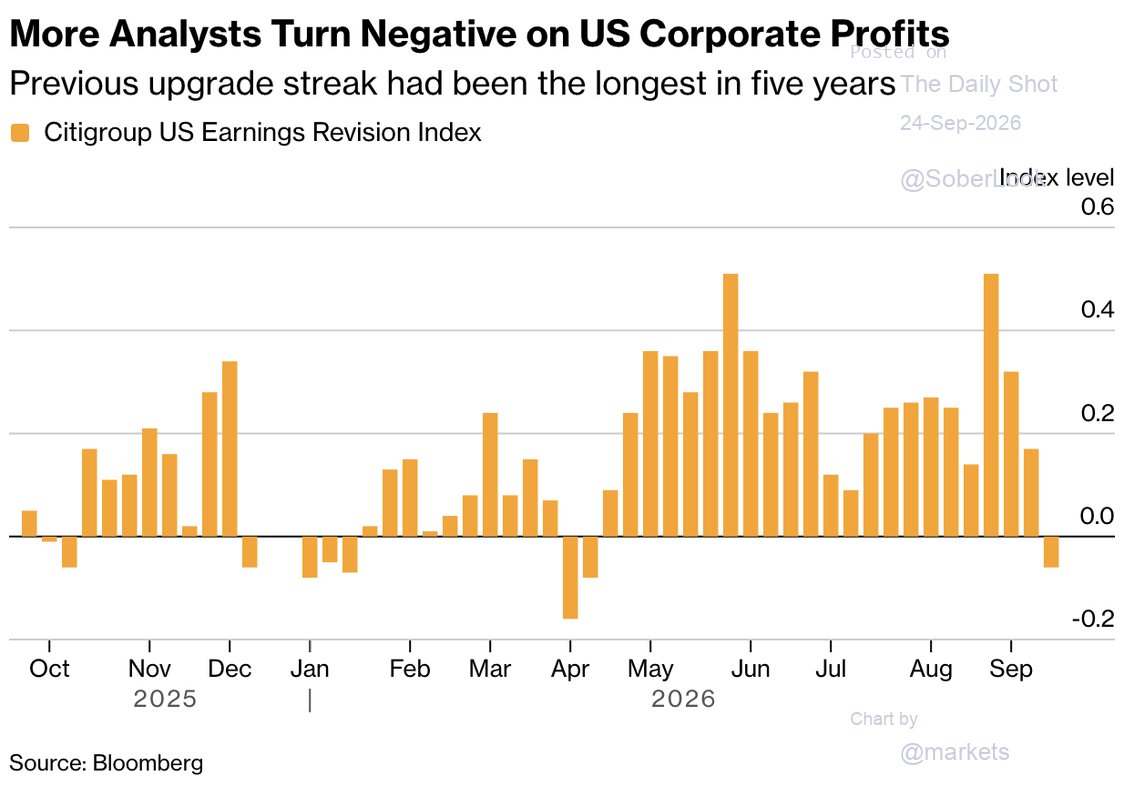
Citigroup US Earnings Revision Index | The latest reading turned negative, ending an upgrade run that had been the longest in five years
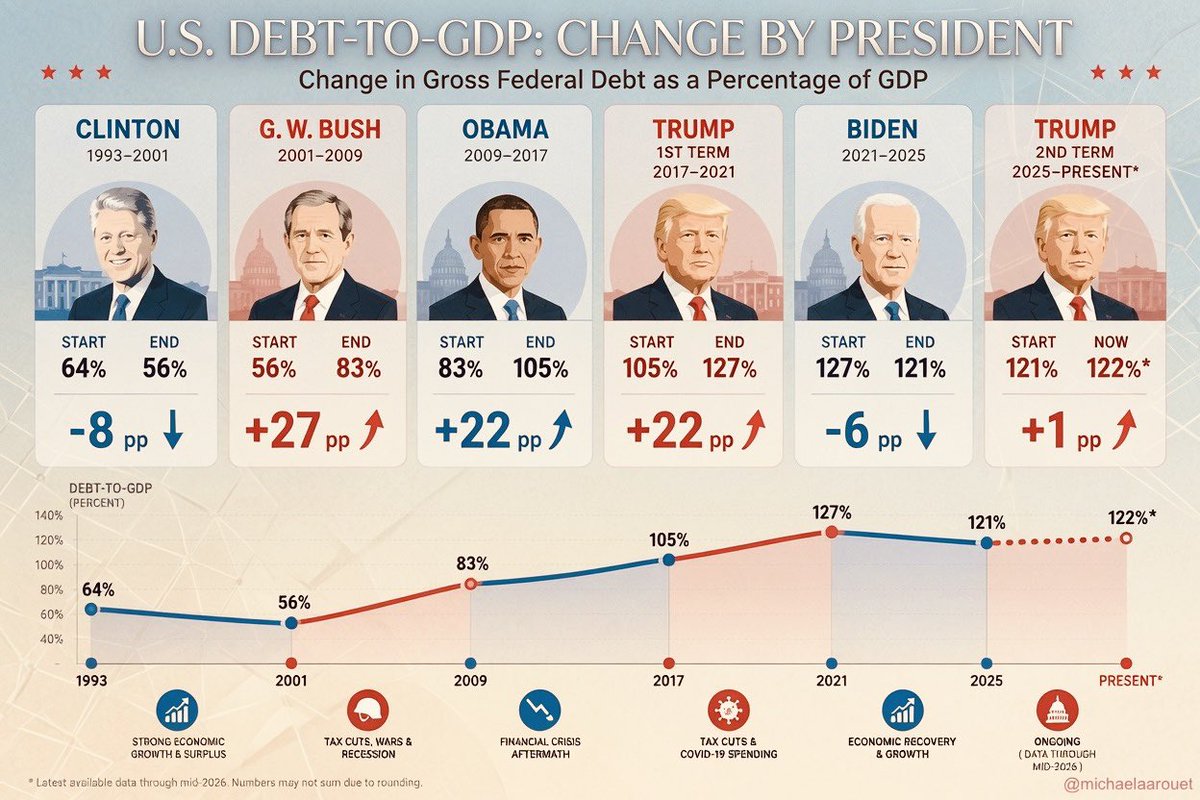
Change in US federal debt as % of GDP by president | Now 122%, up from 56% when Clinton left office, roughly a doubling
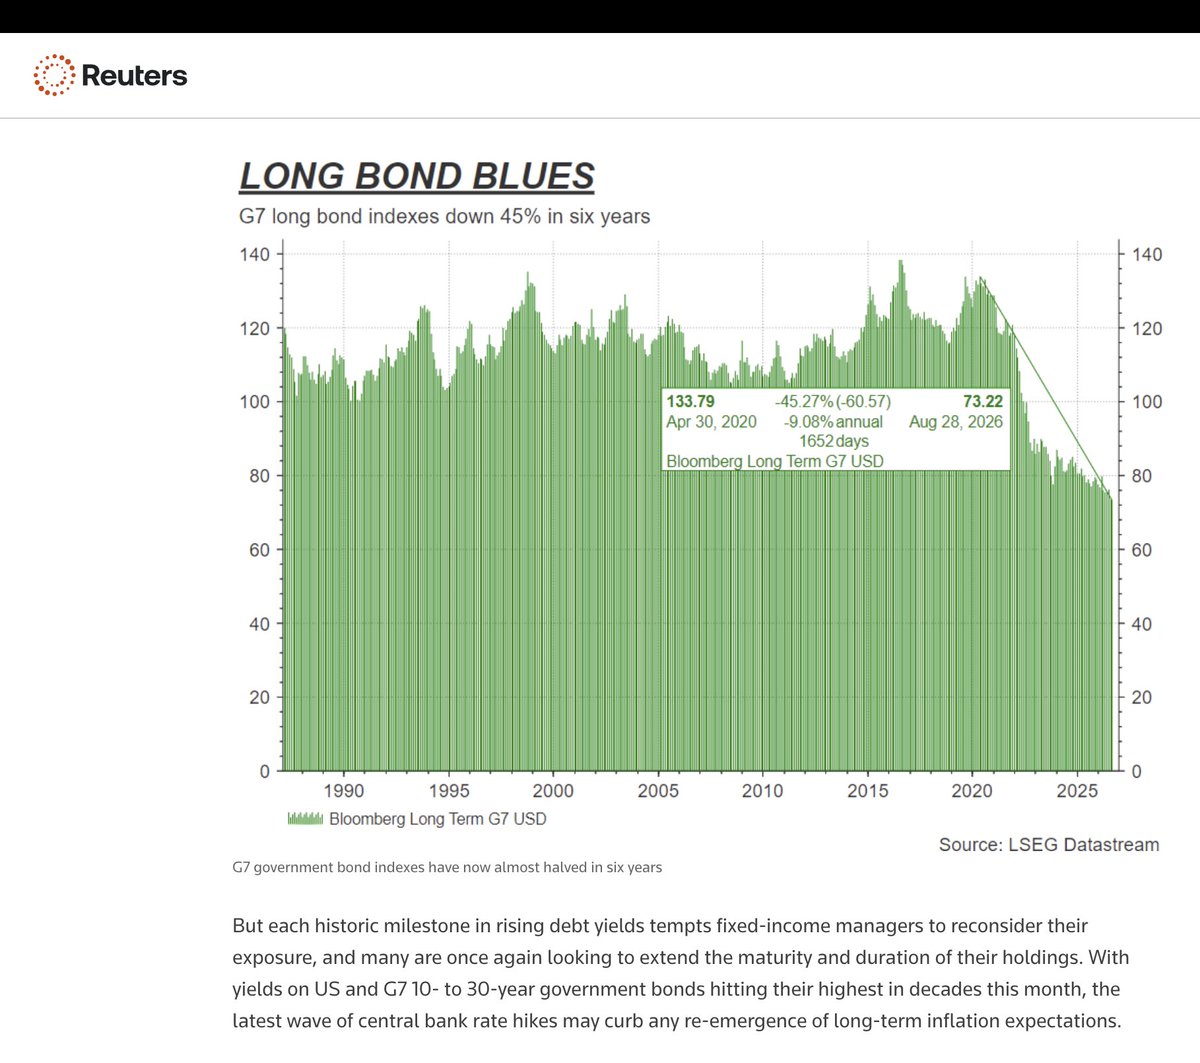
Bloomberg Long-Term G7 government bond index, USD | Down 45% from 133.79 in April 2020 to 73.22 in August 2026, about -9% annually
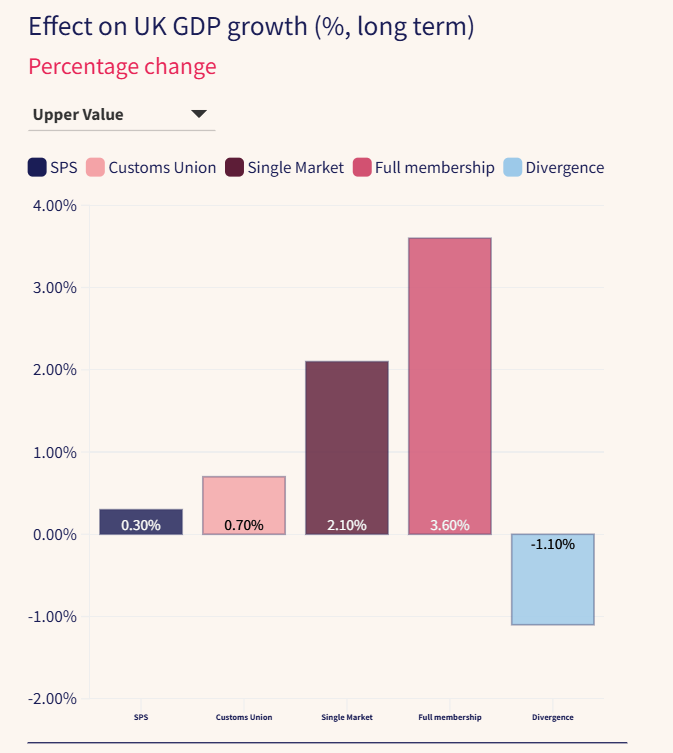
Estimated long-term effect on UK GDP by EU-relationship scenario (%) | Full membership +3.6% and single market +2.1%, versus -1.1% under divergence
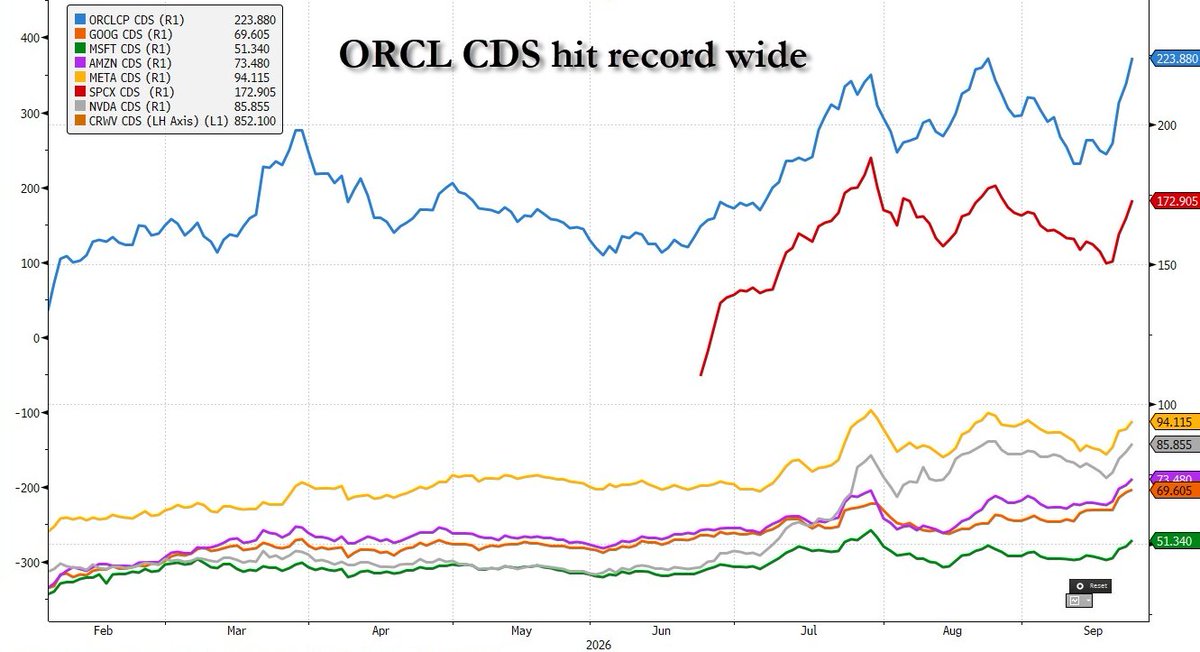
Large-cap tech CDS spreads, basis points | Oracle CDS at a record 223bps, versus Meta at 94 and Nvidia at 86
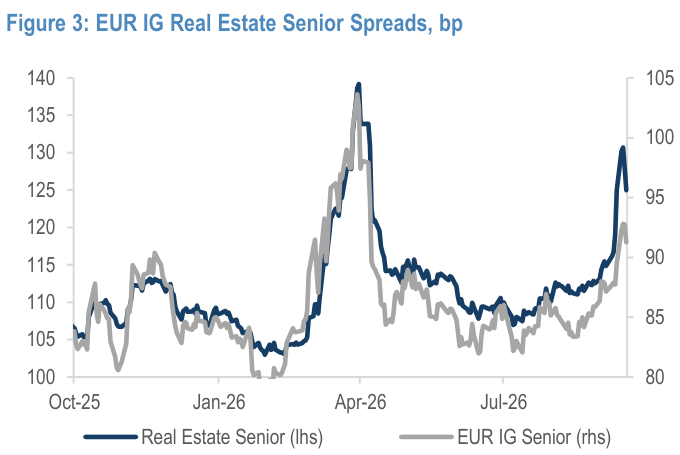
EUR IG real estate vs broad IG senior spreads (bp) | Real estate senior spreads widened 14bp over the month, more than the 8bp move in the broader IG benchmark
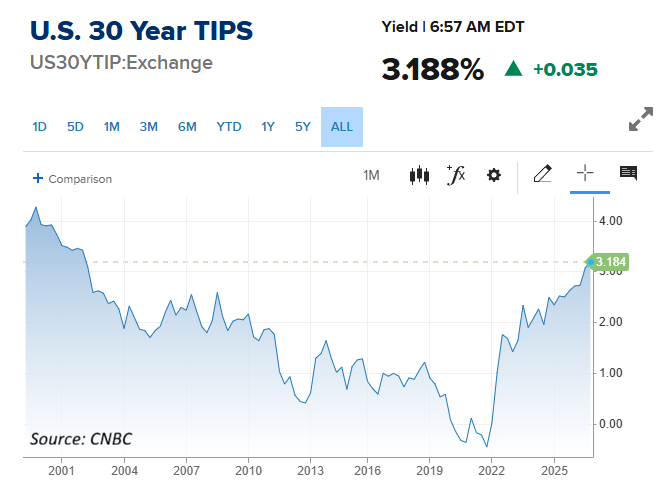
US 30-year TIPS real yield, 2001-2026 | Real yield climbs to 3.19%, the highest since 2002
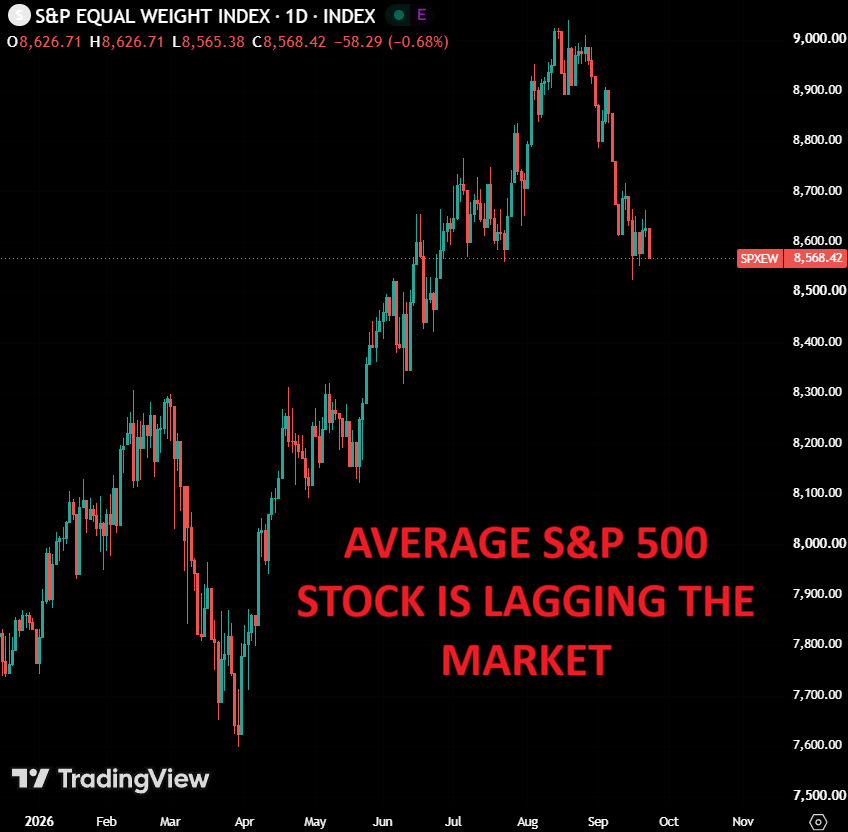
S&P 500 Equal Weight Index, daily (2026) | Down from an August high near 9,050 to 8,568, showing the average stock is trailing the cap-weighted index
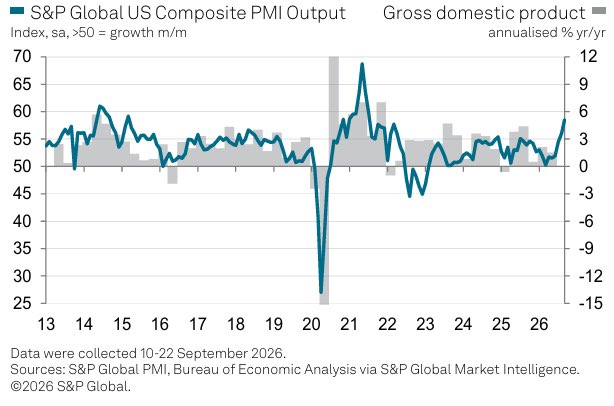
S&P Global US Composite PMI output and GDP, 2013-2026 | September PMI rises to 58.4, a five-year high in growth, led by services
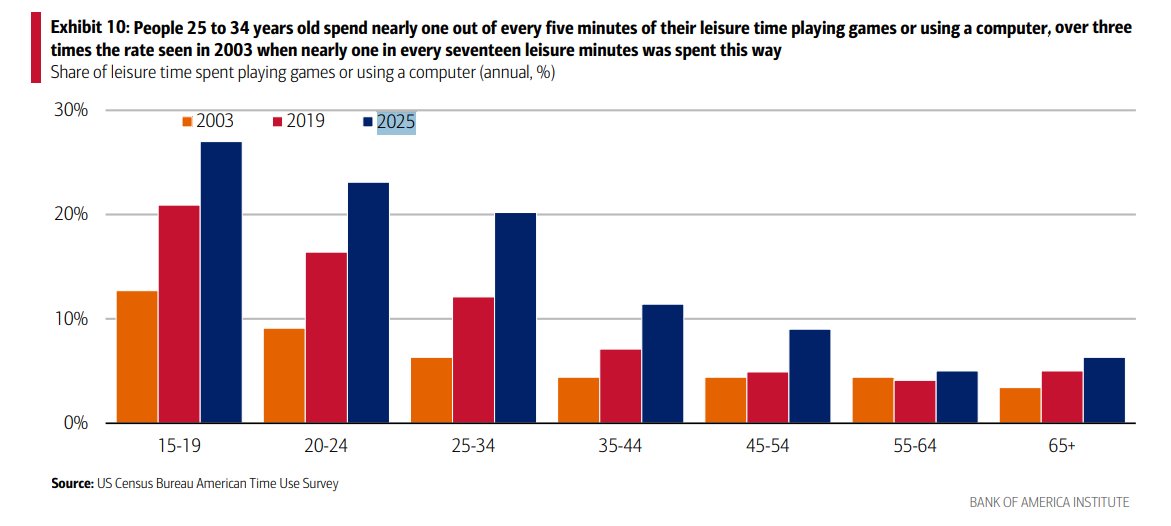
Share of leisure time spent gaming or on a computer by age, 2003/2019/2025 | The 25-34 group reaches ~20% in 2025, over triple the ~6% in 2003
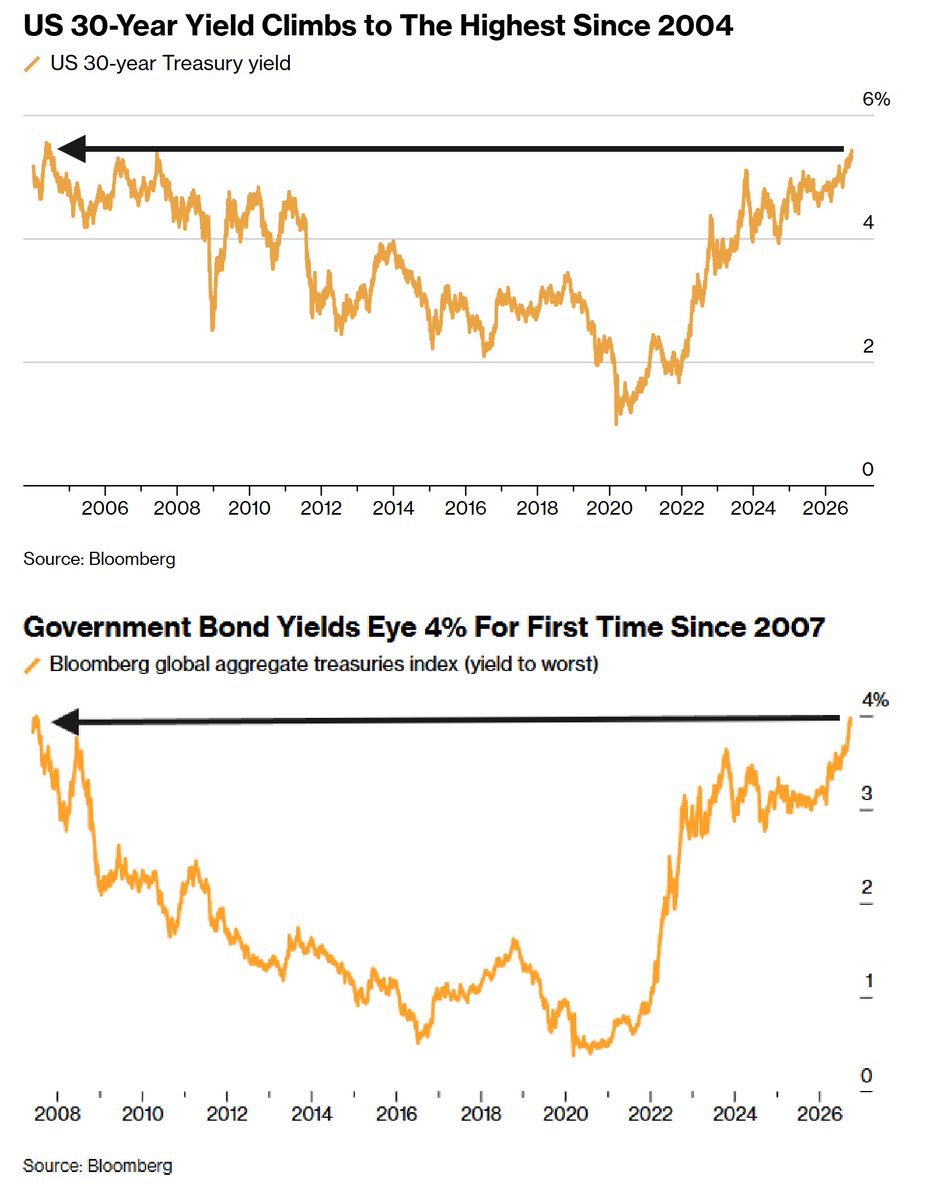
US 30-year yield and Bloomberg global aggregate treasuries yield | 30-year at ~5.4%, highest since 2004; the global index nears 4%, first since 2007
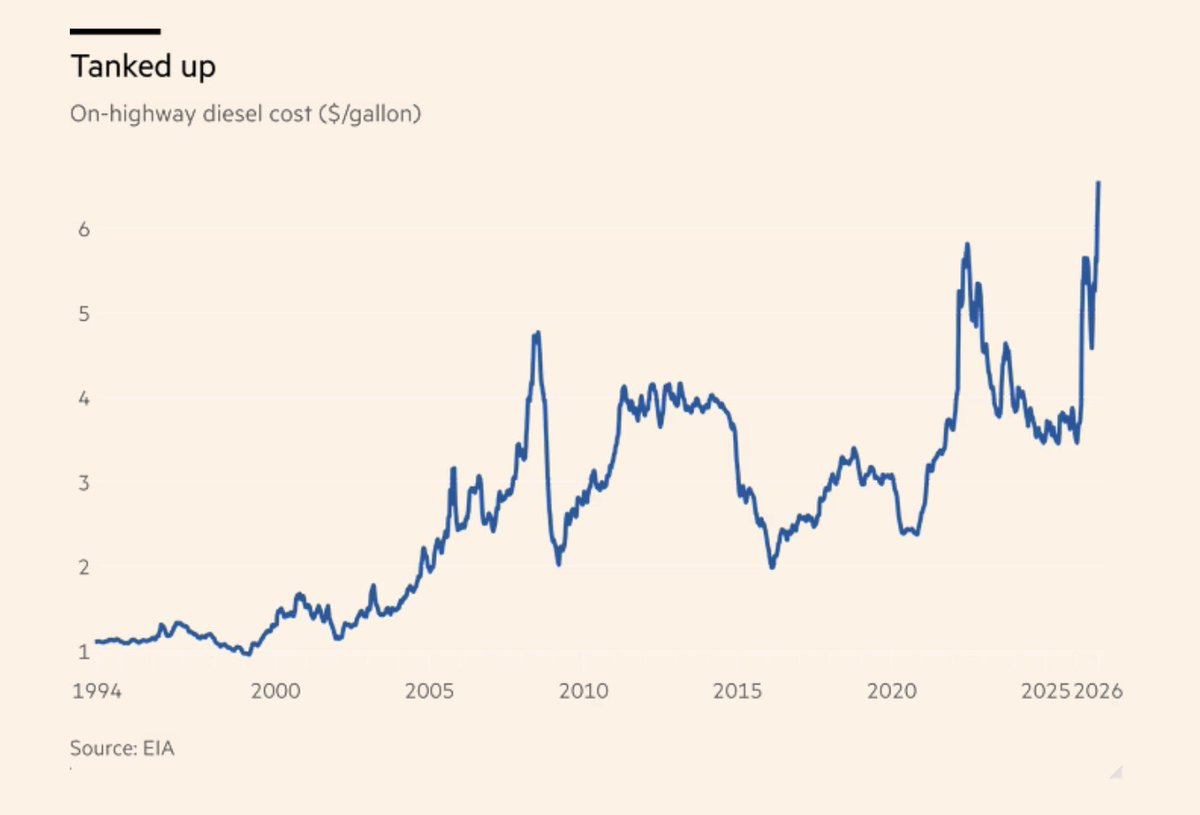
US on-highway diesel retail cost, $/gallon, 1994-2026 | Recently spikes to ~$6.4/gallon, a multi-year high, far above the ~$2 low in 2020
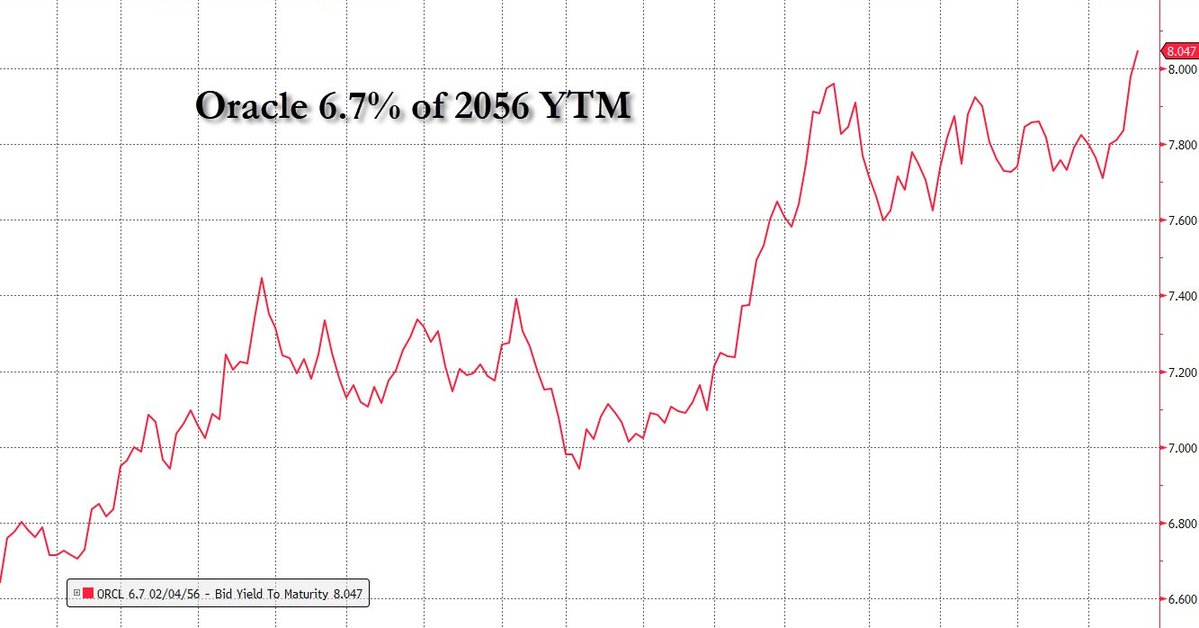
Yield to maturity on Oracle's 6.7% 2056 bond, % | The yield broke above 8% to 8.05%, a record for the note
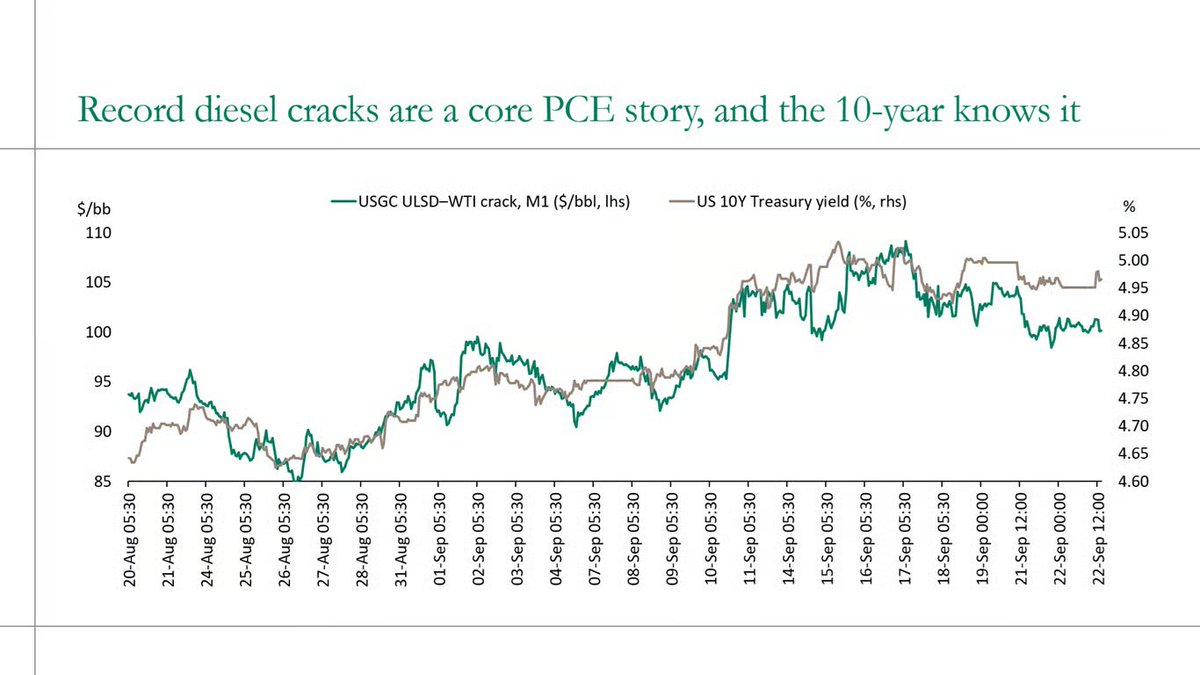
USGC ULSD-WTI diesel crack vs US 10Y yield (Aug 20 to Sep 22) | The crack rose from about $85 to above $105/bbl while the 10Y yield climbed to about 5.0%
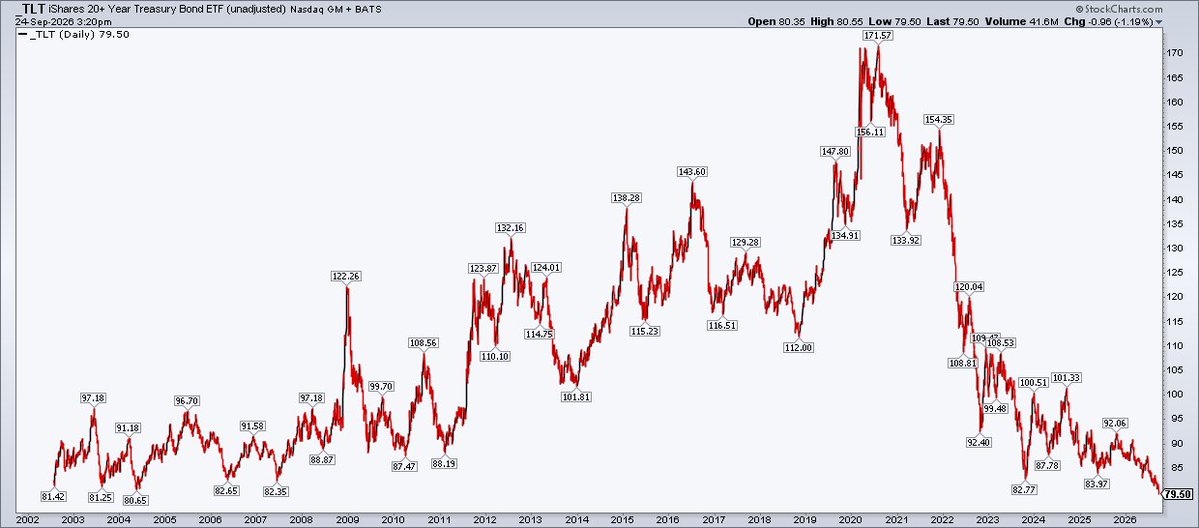
iShares 20+ Year Treasury Bond ETF (TLT), daily, 2002-2026 | Last at 79.50, a record low, about 54% below its 2020 peak of 171.57
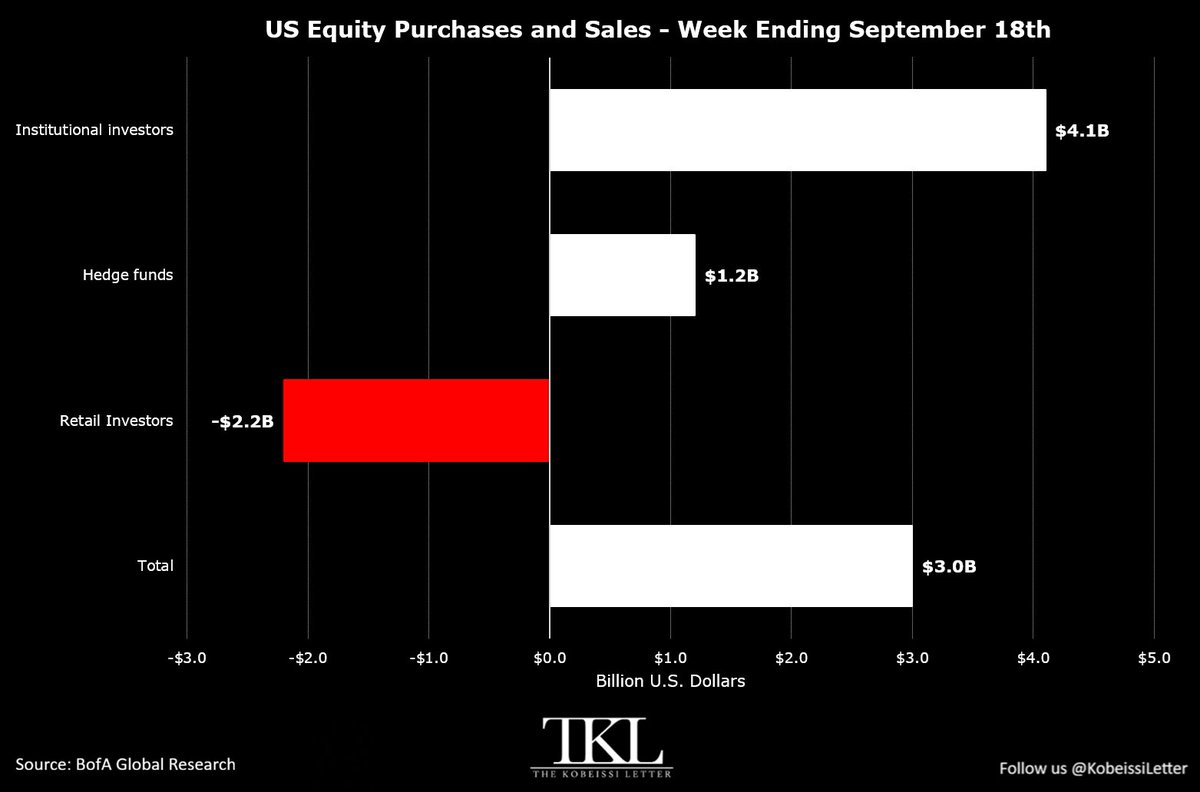
US equity flows by investor type, week ending Sept 18 (USD bn) | Institutions +$4.1B and hedge funds +$1.2B, retail -$2.2B, net +$3.0B
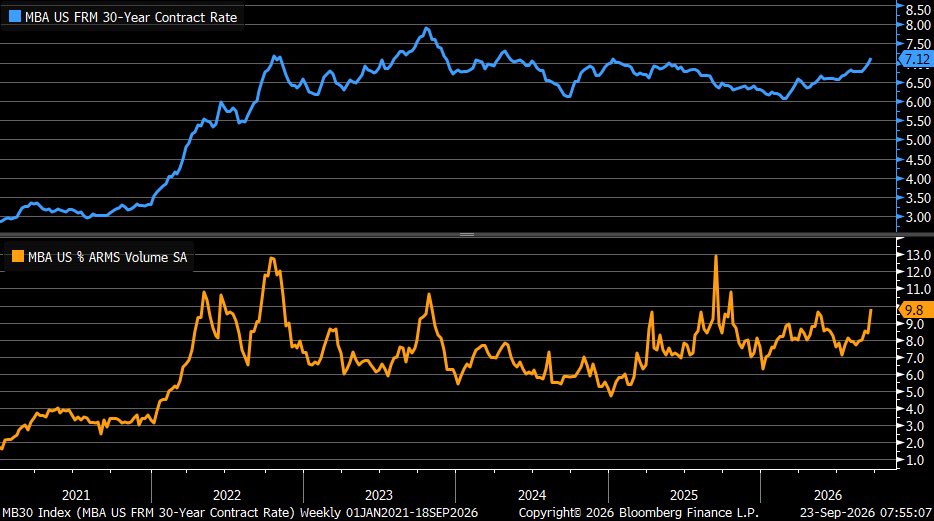
MBA 30-year fixed mortgage rate and ARM share, 2021-2026 | Fixed rate now 7.12% while the ARM share rebounds to 9.8%, near multi-year highs
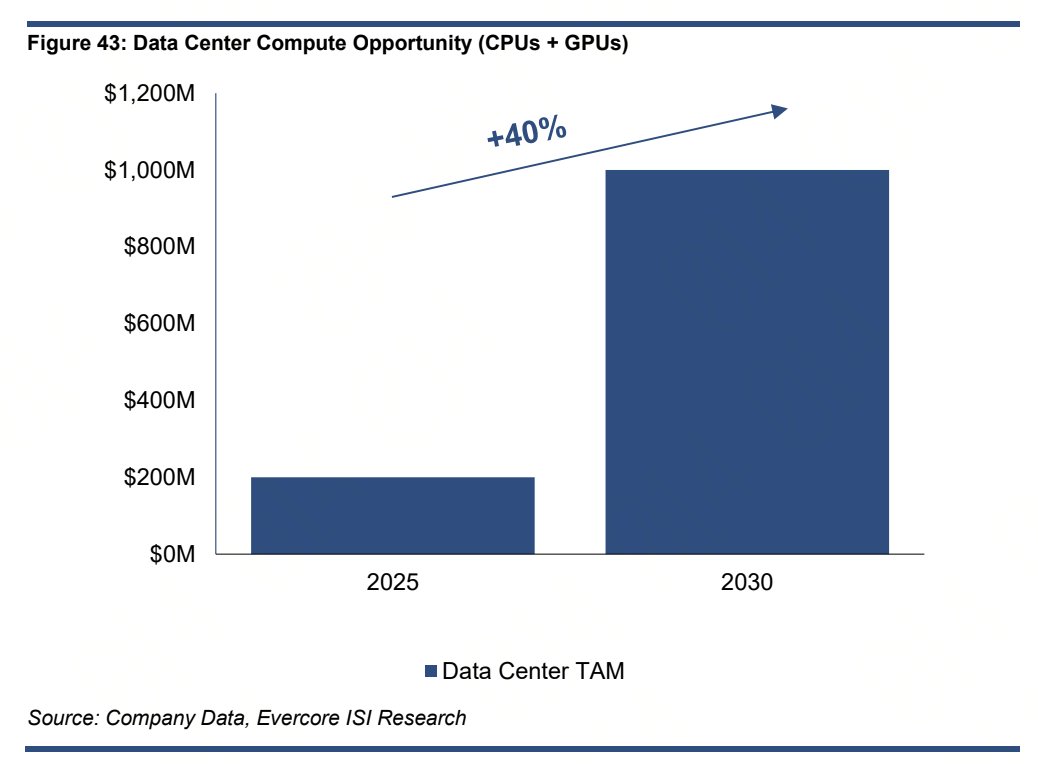
Data-center compute (CPU+GPU) TAM | Forecast 40% CAGR from 2025 to 2030, with the market reaching roughly $1 trillion
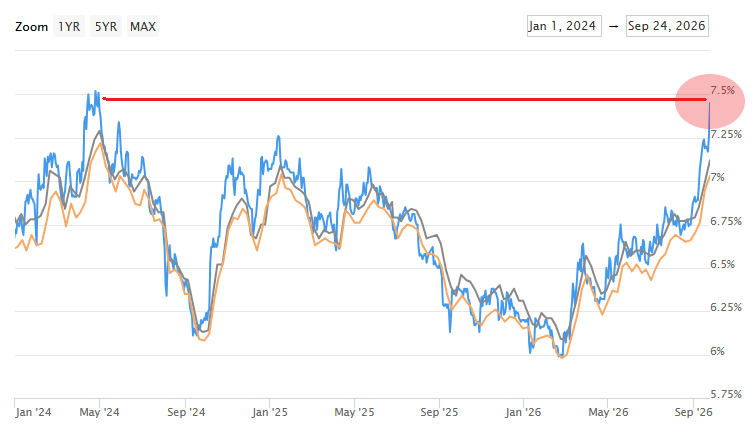
US 30-year mortgage rate, 2024-2026 | Rate climbs to 7.45%, the highest level since April 2024
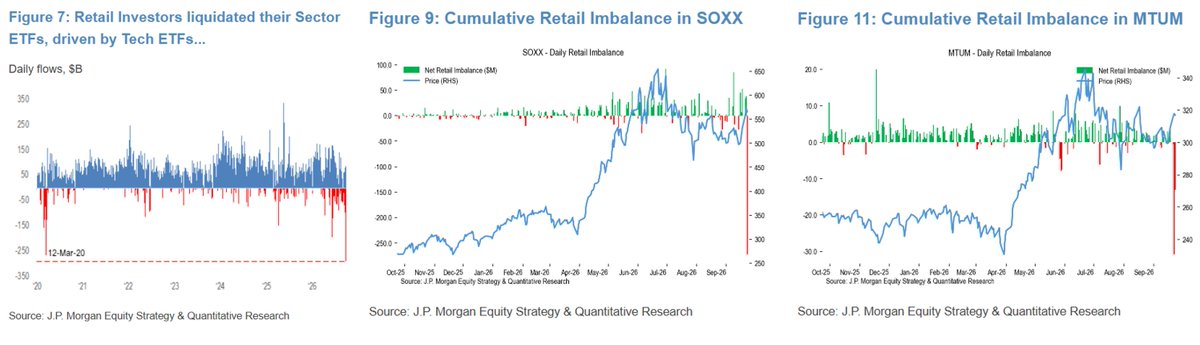
JPMorgan retail ETF flows (sector, SOXX, MTUM) | Retail net-sold tech-sector ETFs, with record single-day outflows in SOXX and momentum ETF MTUM
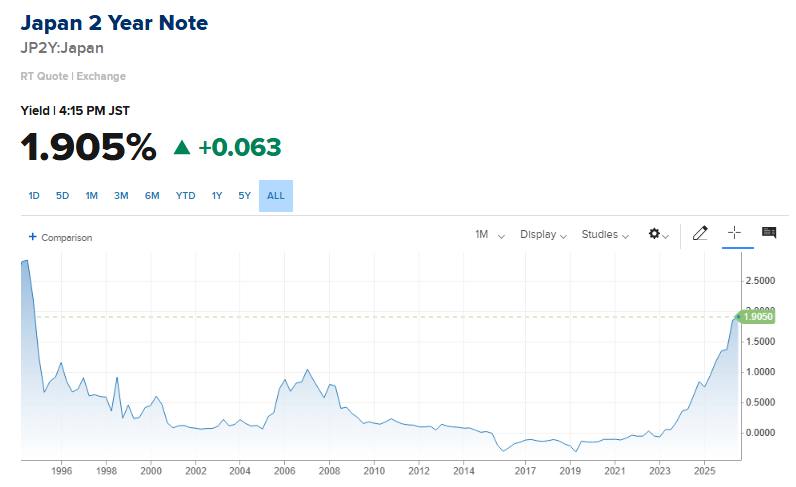
Japan 2-year government bond yield, full history | Now 1.905%, up 0.063 point on the day, the highest in more than 31 years
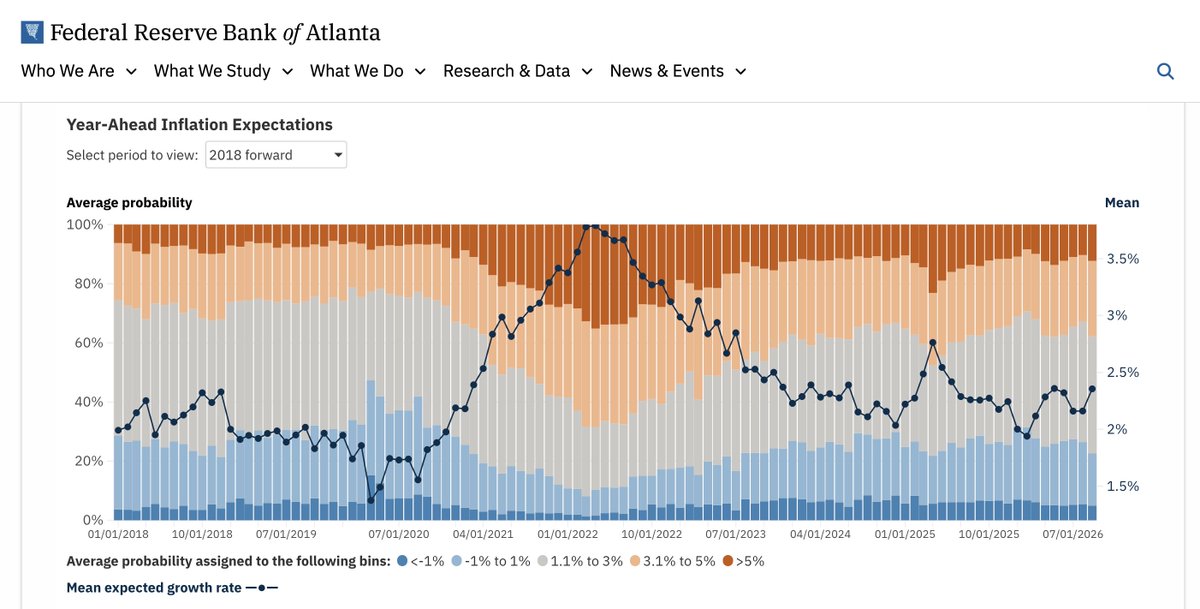
Atlanta Fed year-ahead inflation expectations, 2018-2026 | Mean expectation edges up to 2.4% as the probability distribution shifts higher
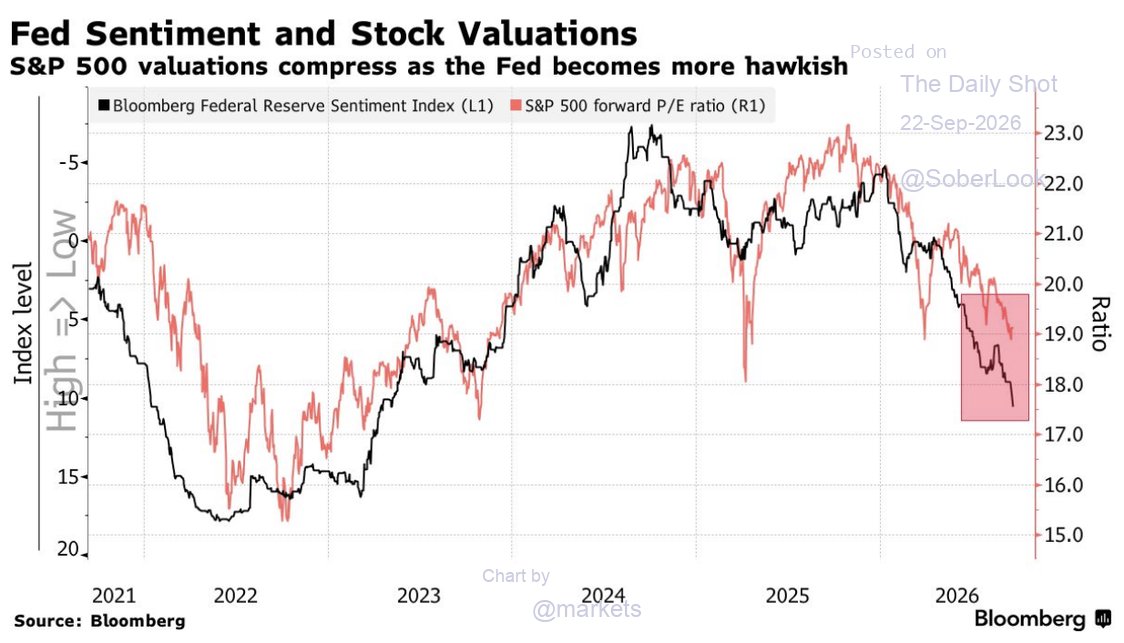
Bloomberg Fed sentiment index vs S&P 500 forward P/E | Forward P/E compressed from above 23x to about 18x as the Fed turned hawkish
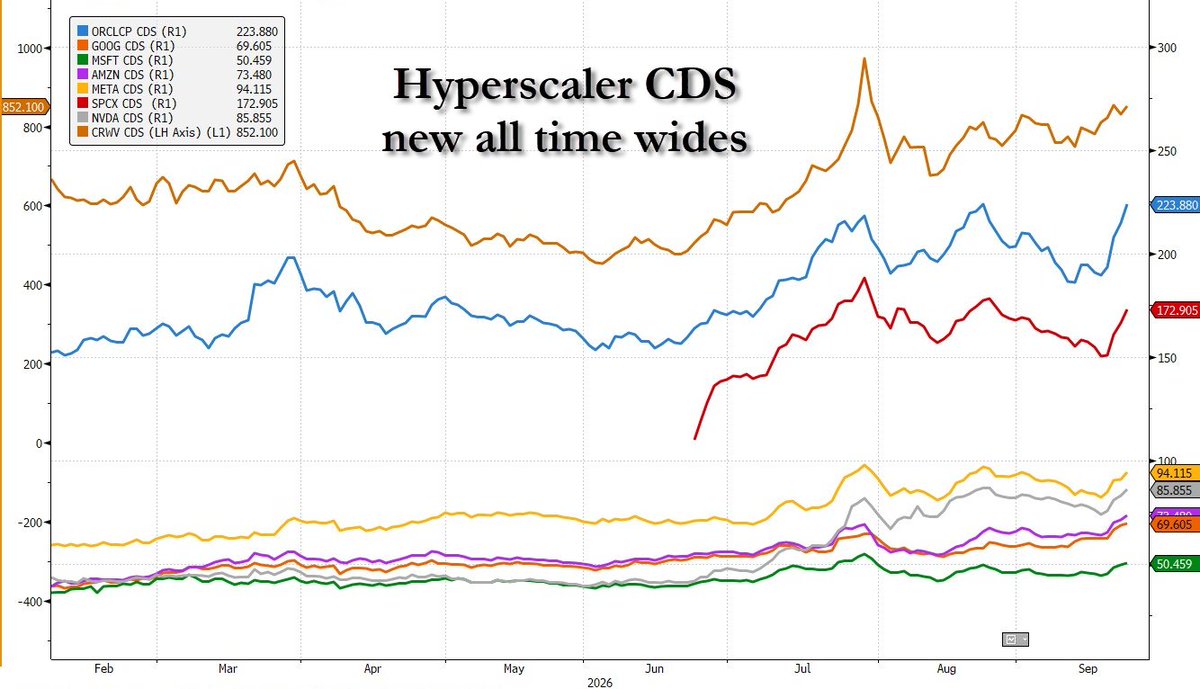
Major hyperscaler 5-year CDS spreads, 2026 | Oracle at 224 bps and CoreWeave at 852 bps, with several hitting record wides
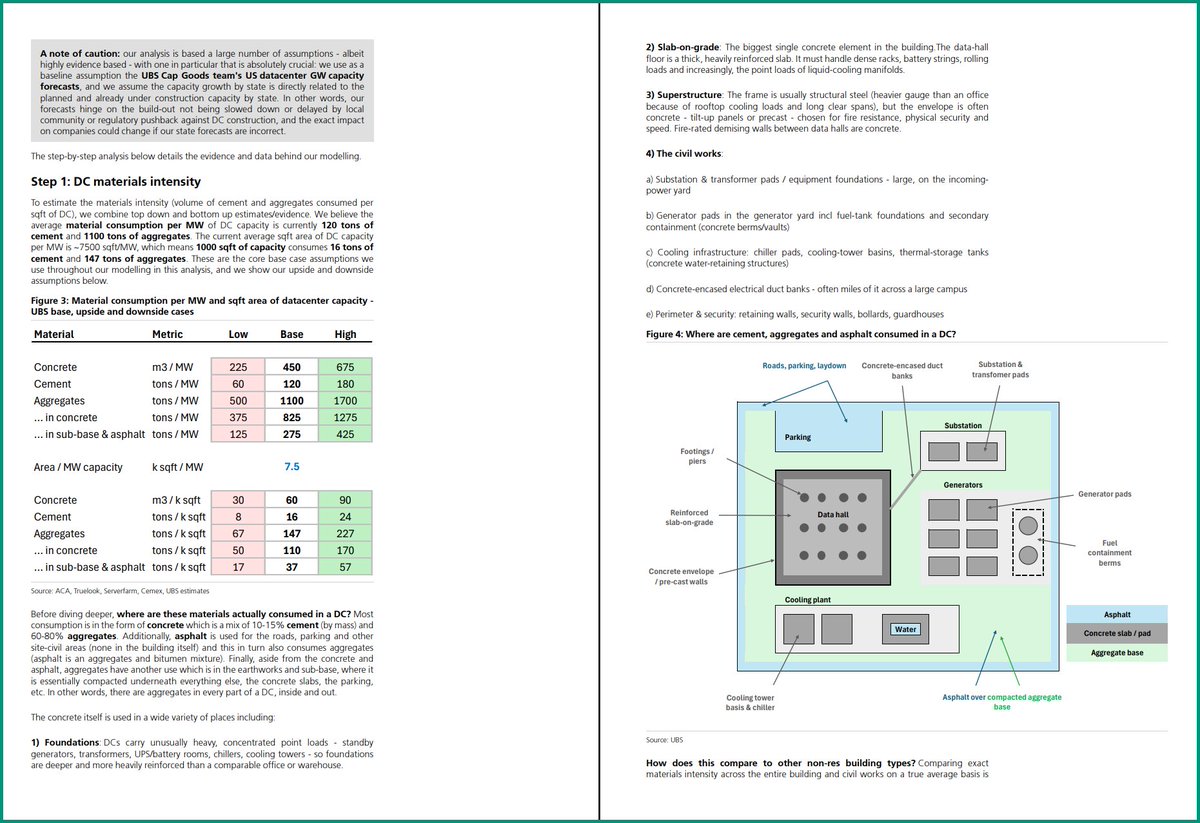
UBS estimates of data center materials intensity, per MW and per k sqft | Roughly 120 tons of cement and 1,100 tons of aggregates per MW, framing AI buildout as a heavy-materials supercycle
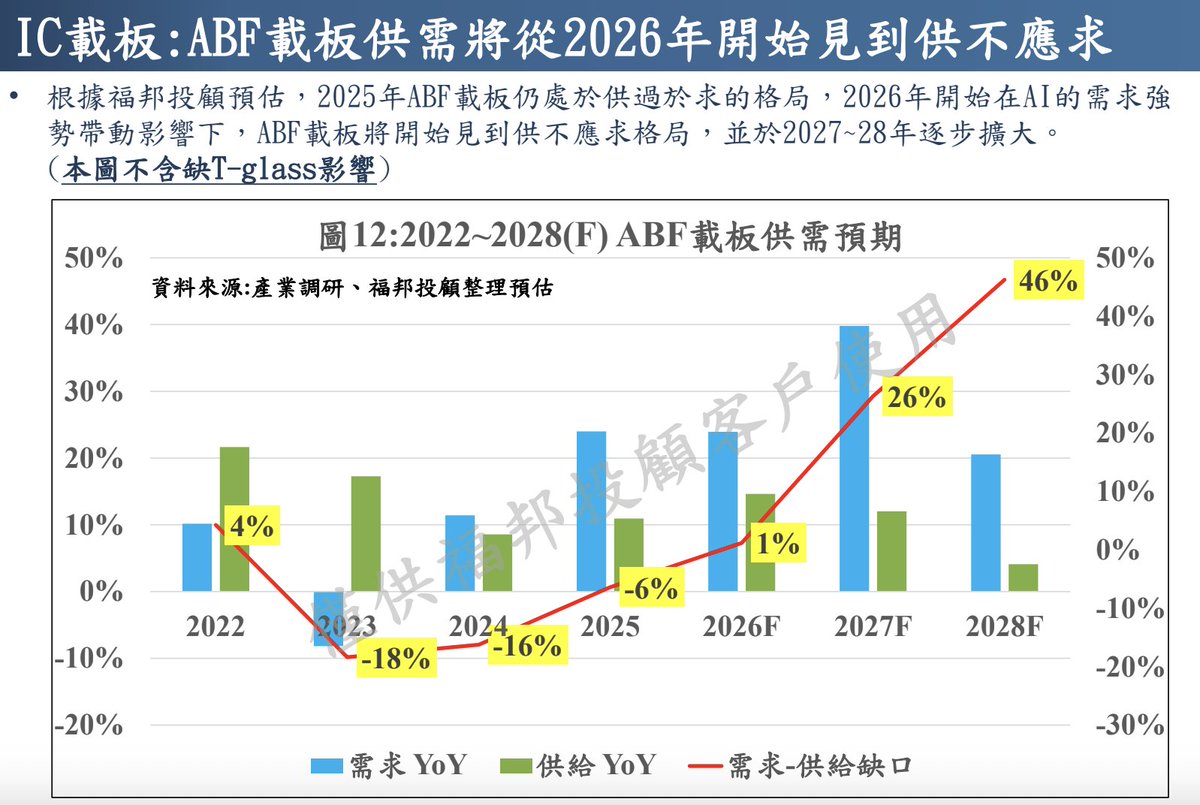
ABF substrate demand YoY, supply YoY and the gap, % | The supply-demand gap widens from 1% in 2026 to 46% in 2028 on AI demand
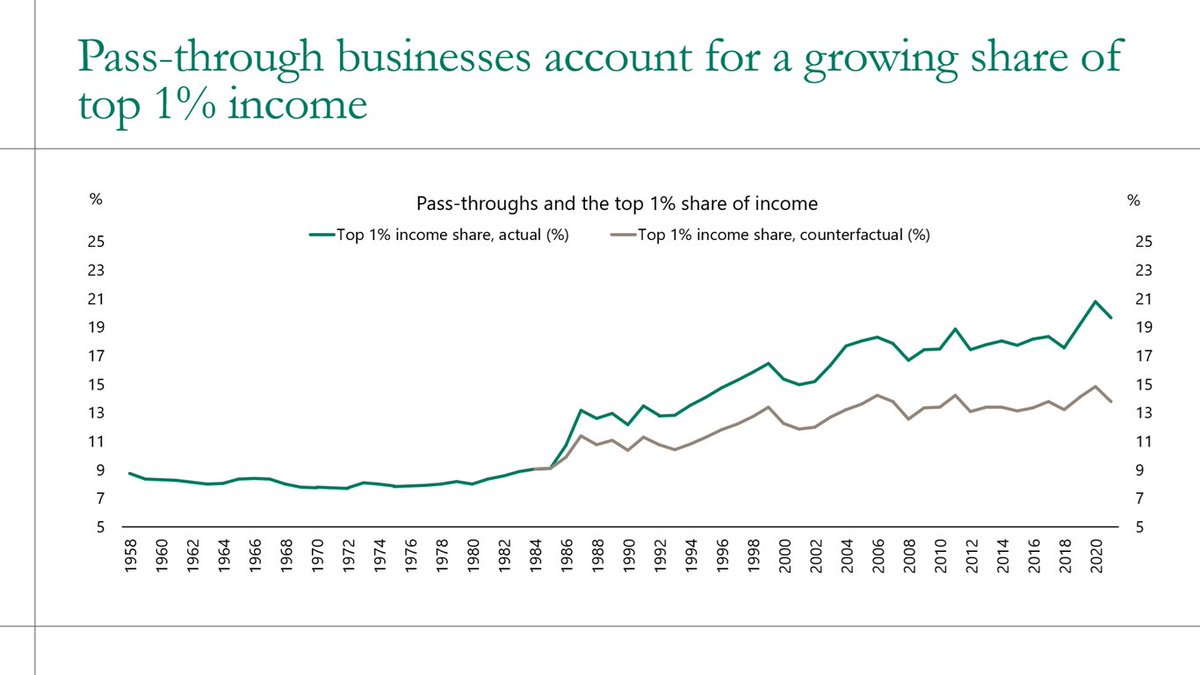
US top 1% income share, actual vs counterfactual, 1958-2020 | Actual near 20% vs ~14% counterfactual; over half the rise since 1985 came via pass-through businesses
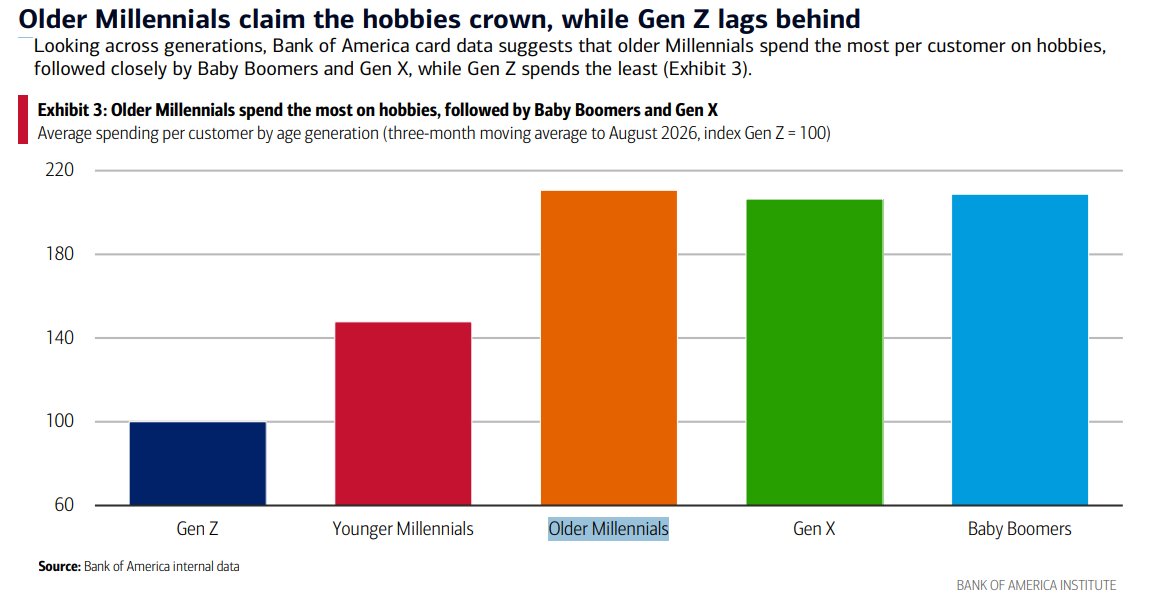
Average hobby spending per customer by generation, index Gen Z=100 | Older Millennials ~211 and Boomers ~210, with Gen Z lowest at 100
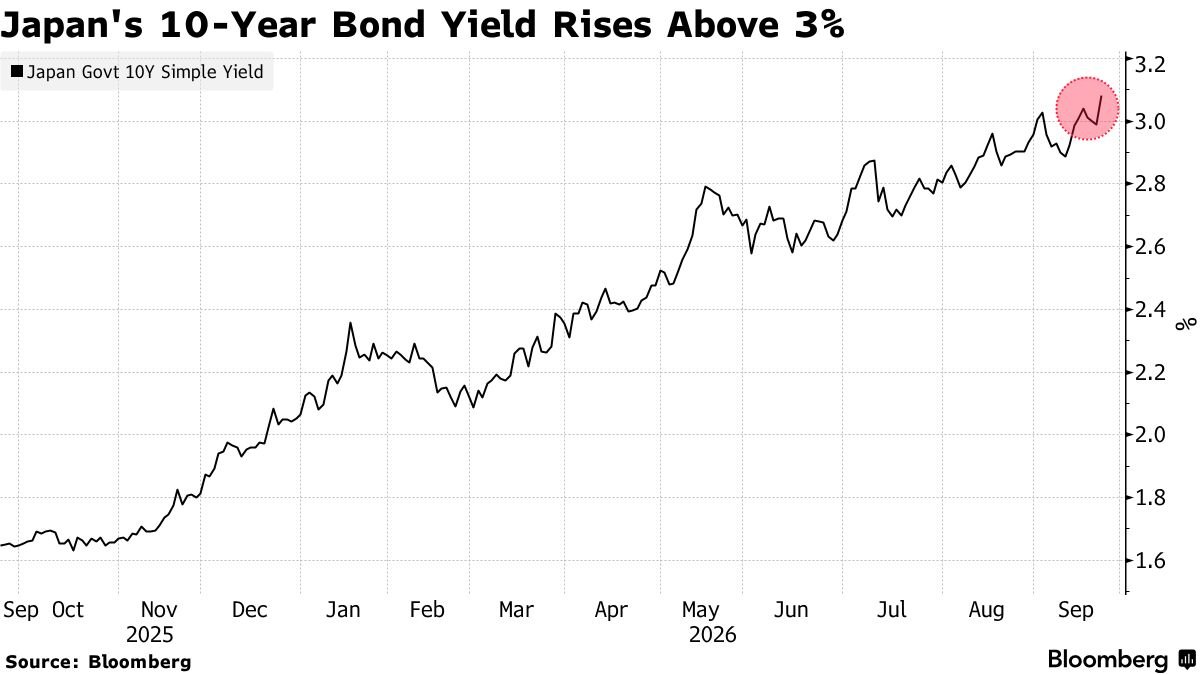
Japan government 10-year simple yield (2025-2026) | Up from about 1.6% a year ago to above 3.0%, the highest level since 1996
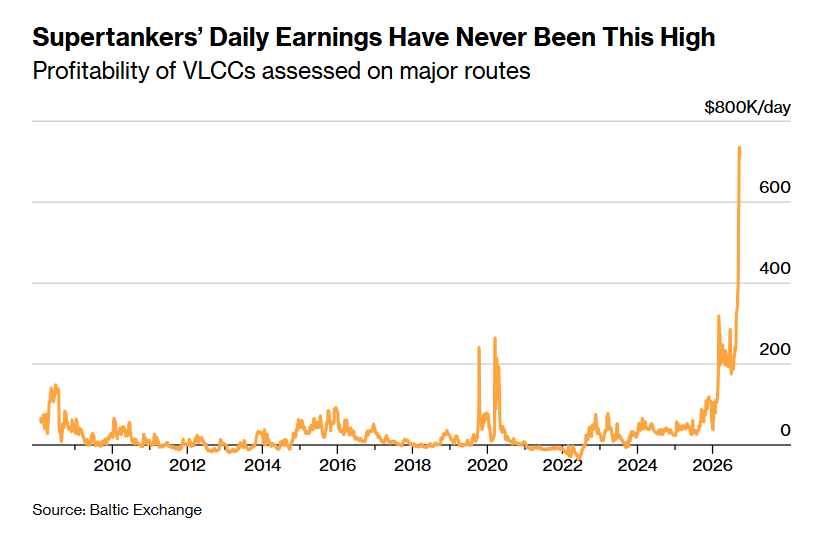
VLCC daily earnings on major routes (2009-2026) | Rates have spiked above $700K/day, a record high, far above the sub-$100K levels typical for most of the period
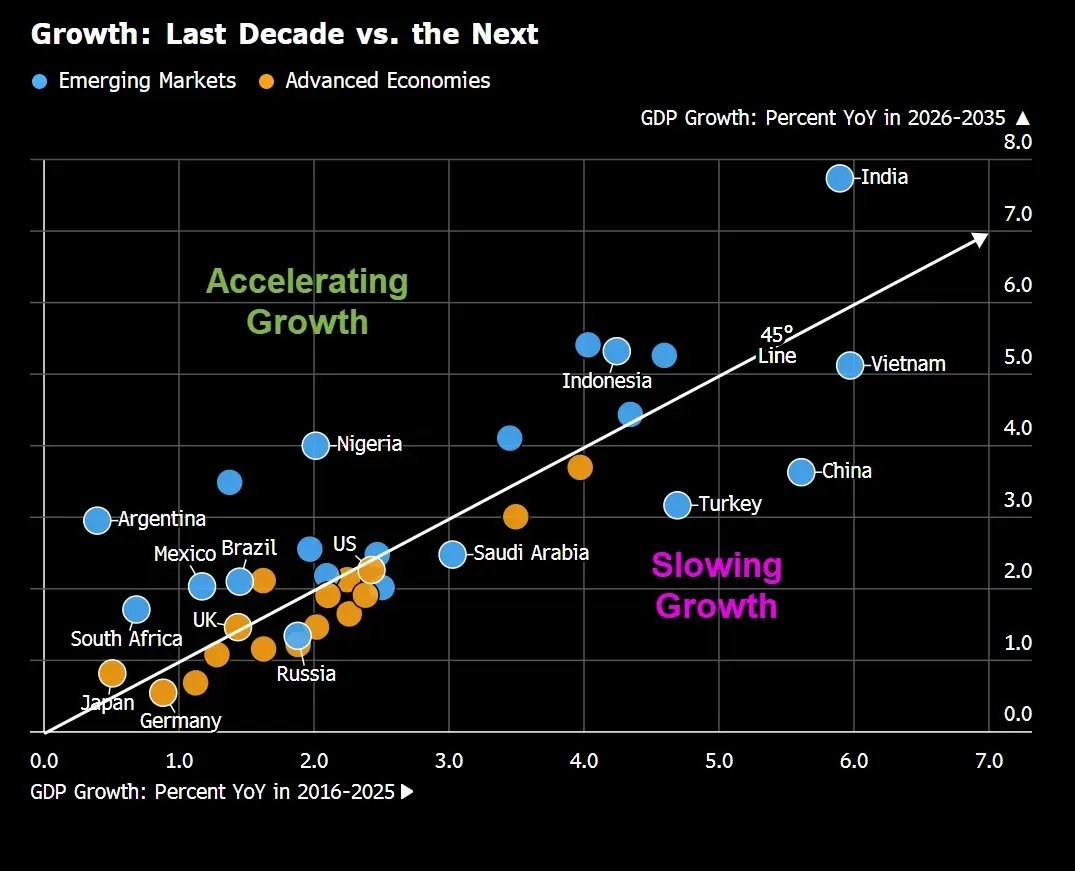
GDP growth by country, 2016-25 vs 2026-35 (scatter) | India's 2026-35 growth estimated above 7%, with Indonesia and Vietnam in the accelerating zone
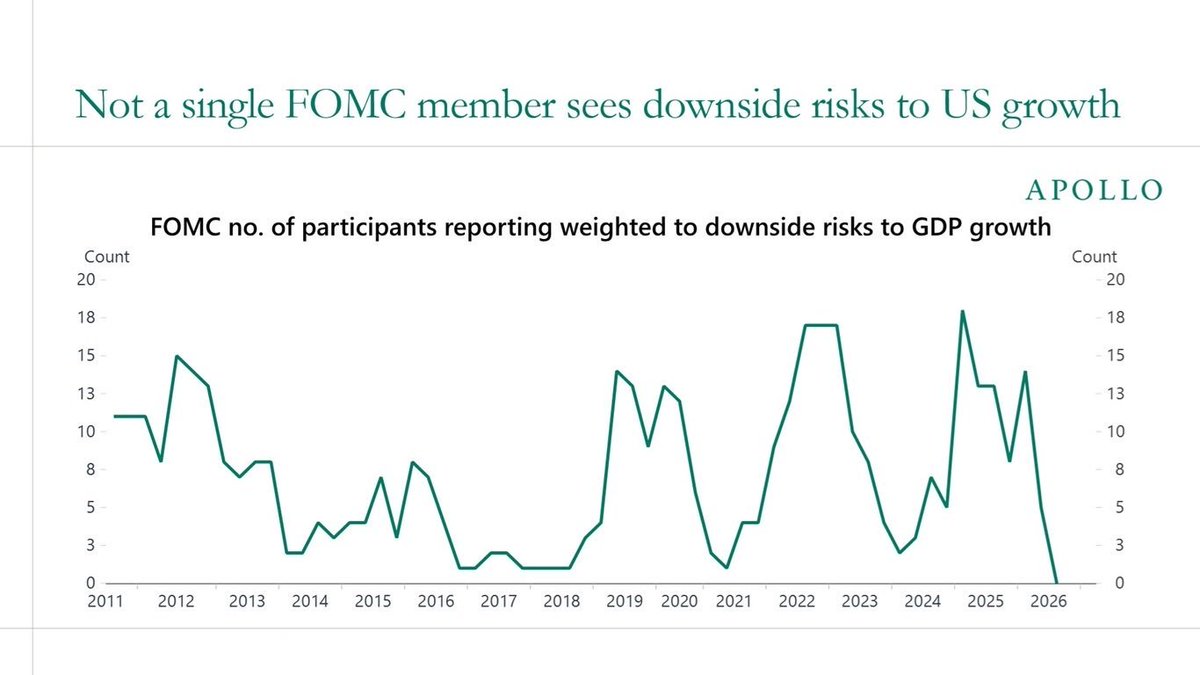
FOMC participants weighting risks to GDP growth as downside, 2011-2026 | Falls to 0 in 2026, matching prior extremes seen in 2018 and 2021
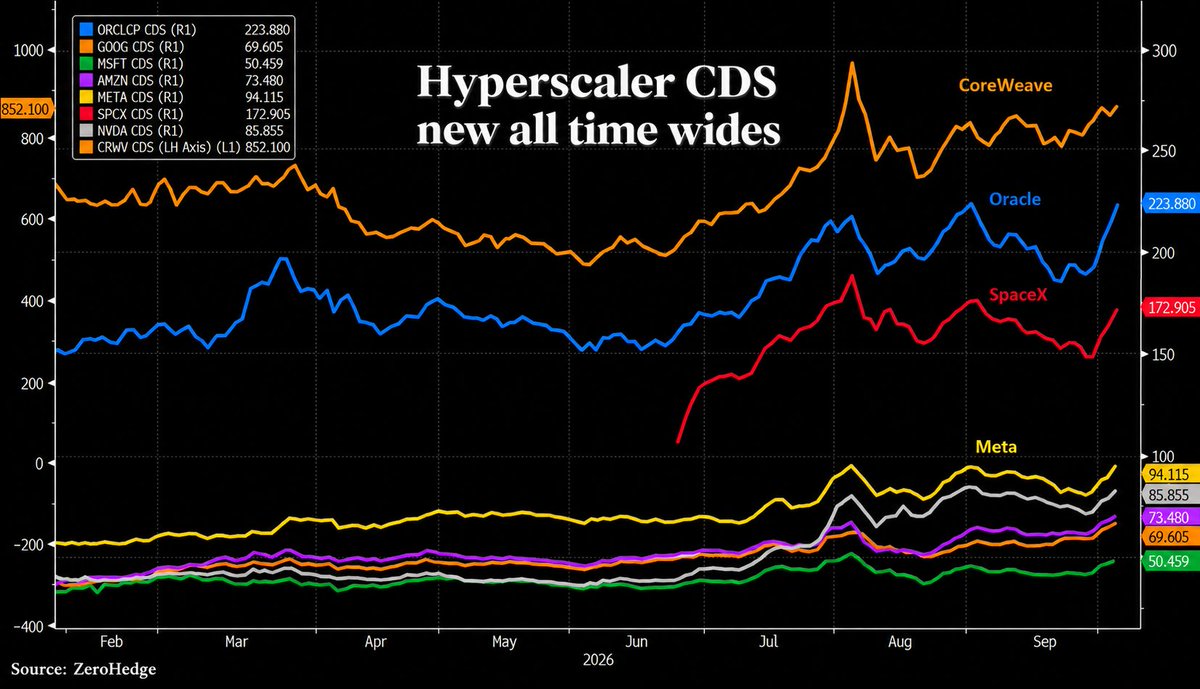
Major hyperscaler 5-year CDS spreads, 2026 | Oracle above 220 bps, surpassing its 2008 crisis peak, while CoreWeave reaches 852 bps
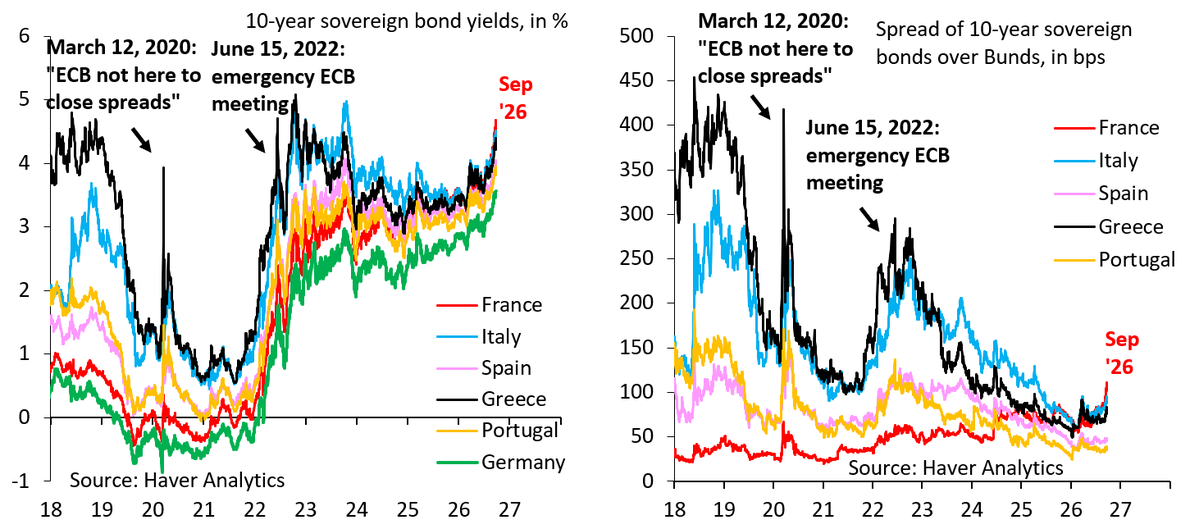
Euro-area 10-year sovereign yields and spreads over Bunds (2018-2026) | Yields have risen toward 4-5% across countries, yet spreads to Bunds have compressed to roughly 50-100bps, a multi-year low
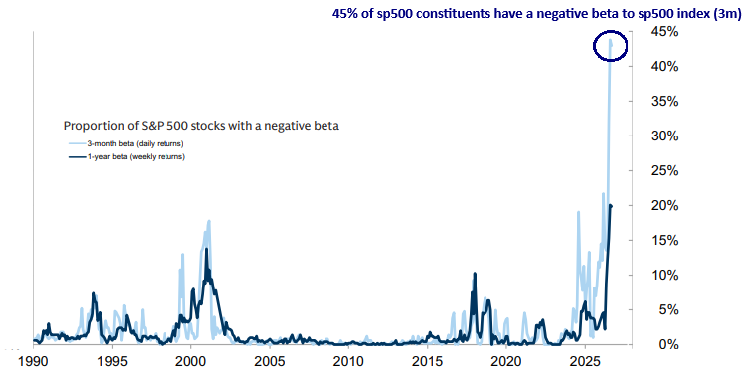
Share of S&P 500 members with negative beta, 3-month and 1-year (1990-2026) | The 3-month measure hit 45%, the highest since the 2000-01 tech bubble, signaling deep market divergence
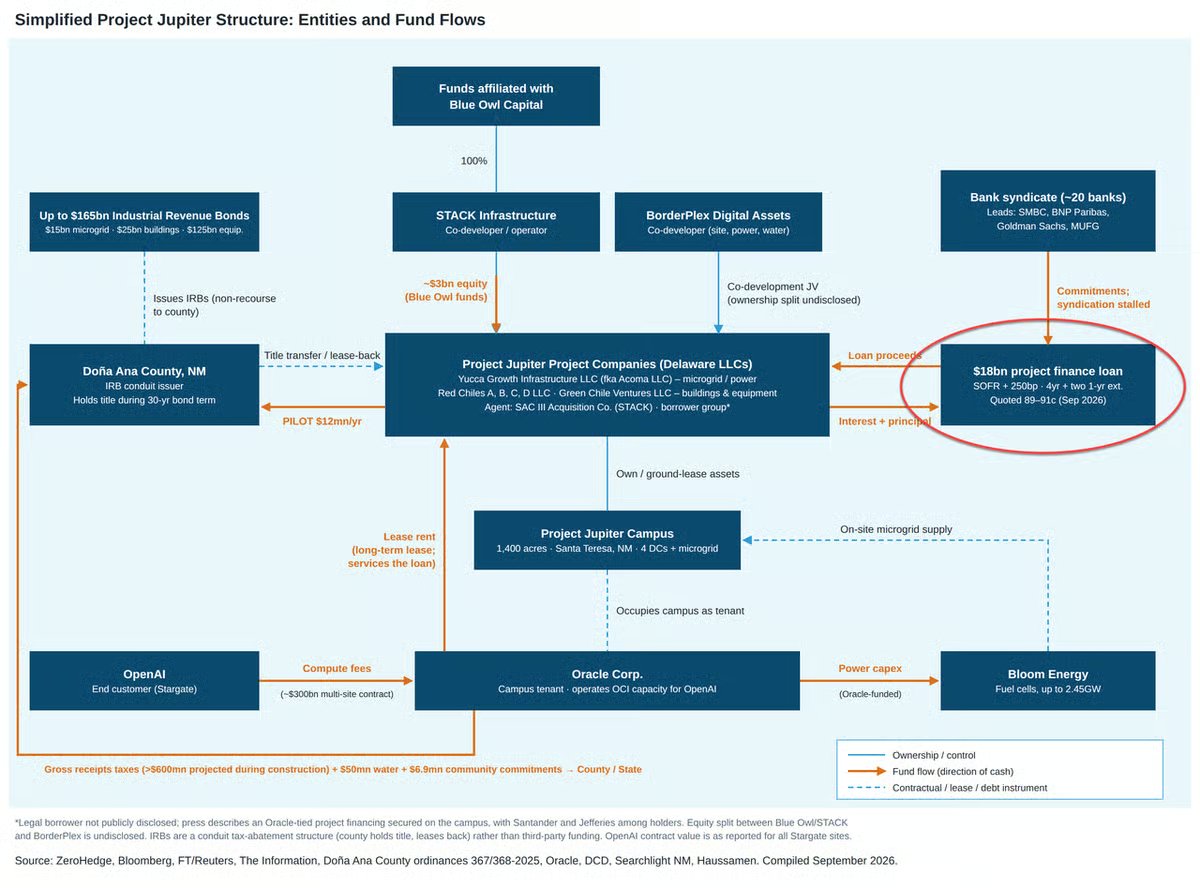
Project Jupiter financing structure | An $18bn project loan and up to $165bn in revenue bonds underpin a roughly $300bn OpenAI compute contract
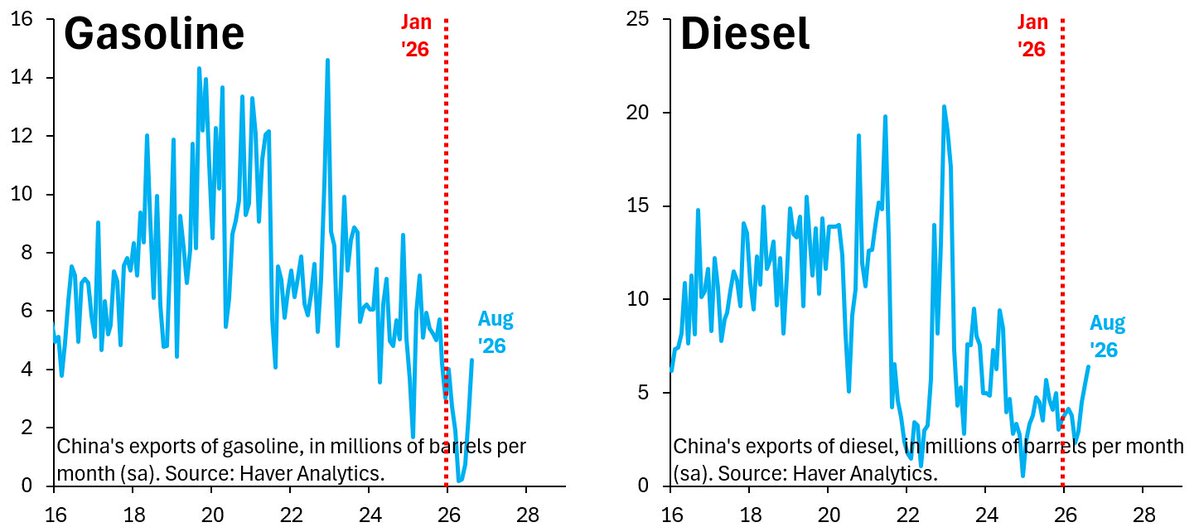
China's gasoline and diesel exports, million barrels/month (sa) | Both rebounded off lows in August 2026 but remain far below their 2020 highs
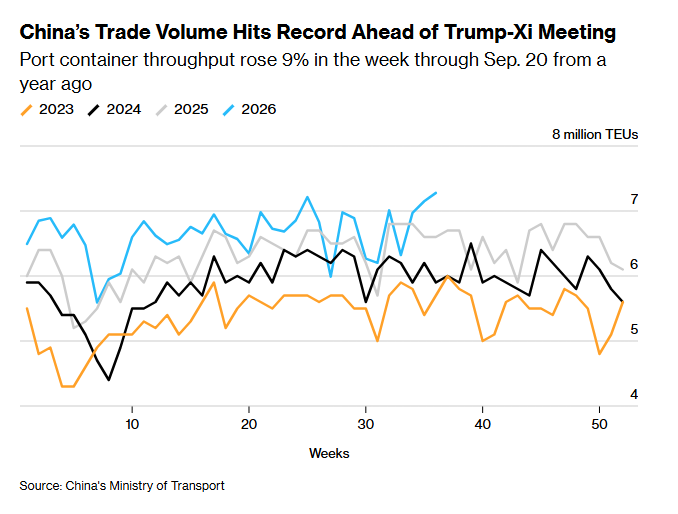
China weekly port container throughput, million TEUs by year | Up 9% YoY in the week to Sep 20, with 2026 near 7M TEUs, a seasonal record
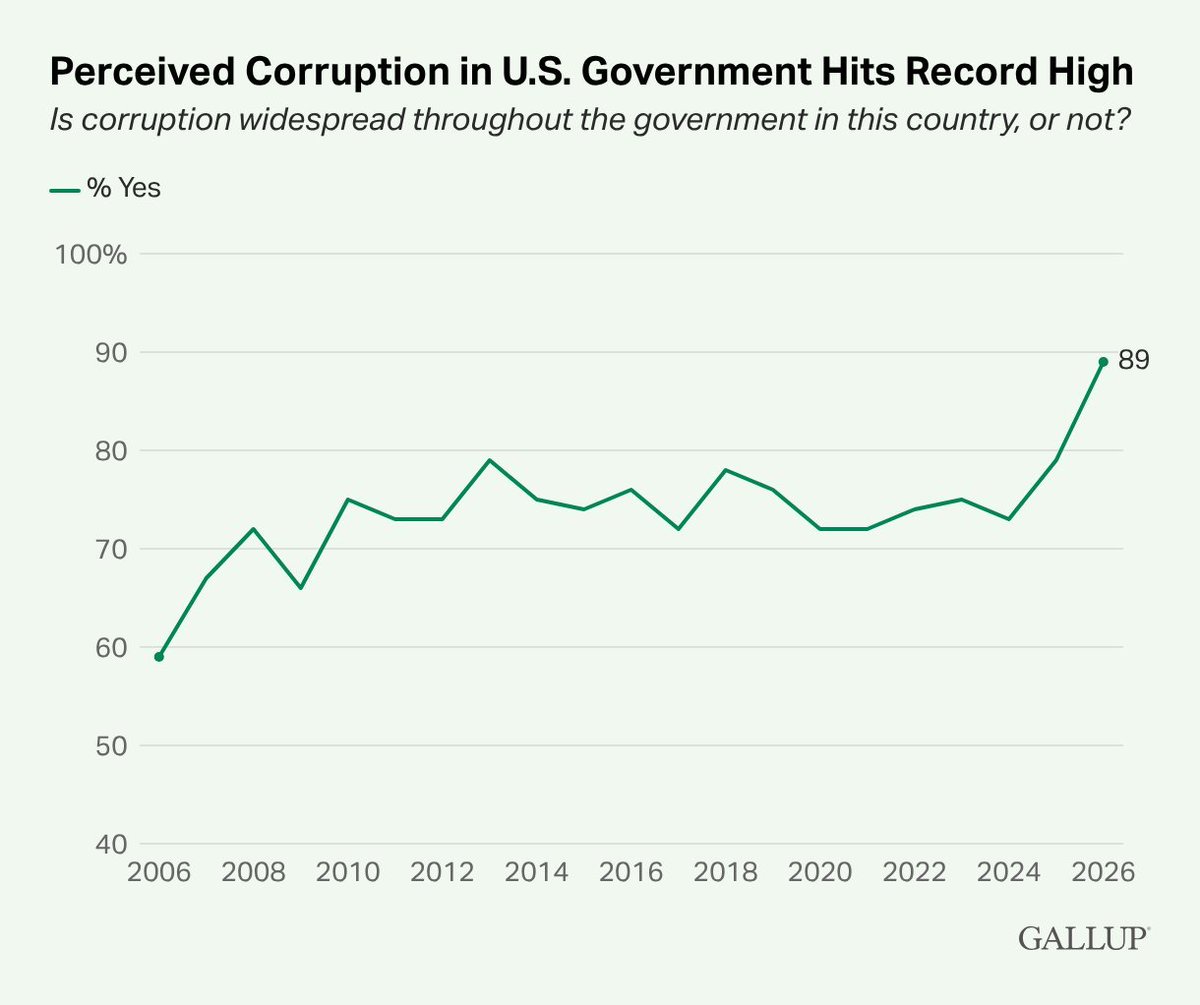
Share of Americans saying corruption is widespread in the US government (2006-2026) | Now 89%, a record high, up sharply from 59% in 2006
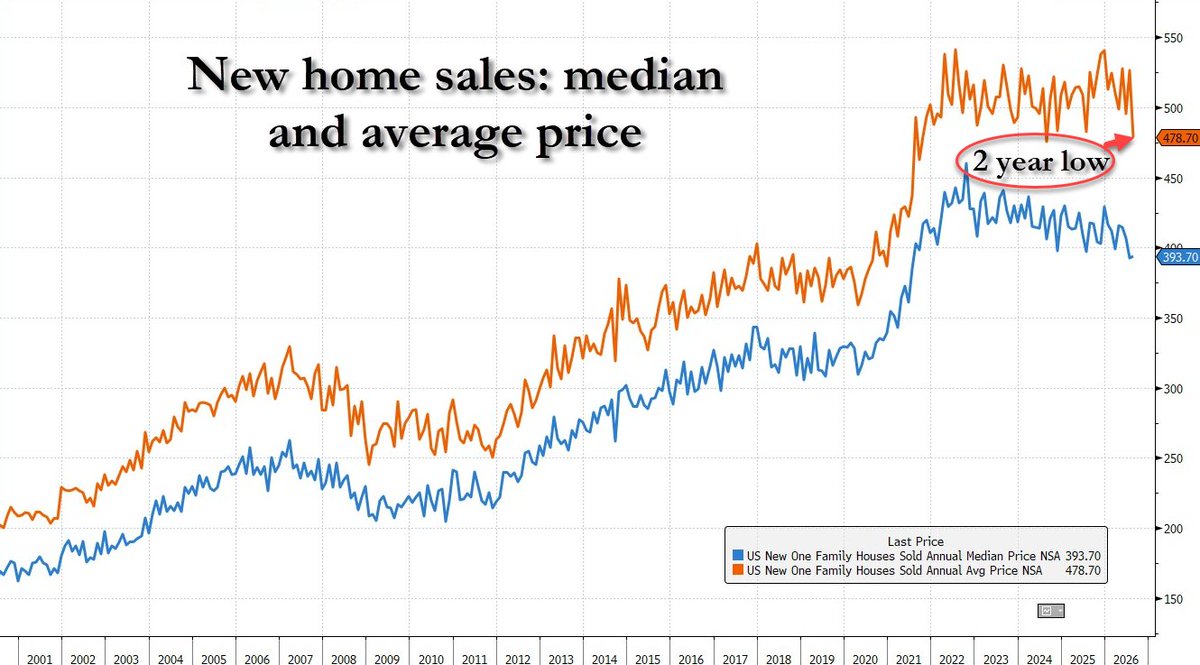
US new home median and average sale price, 2001-2026 | Average price falls to $478,700 with a record monthly drop; median at $393,700
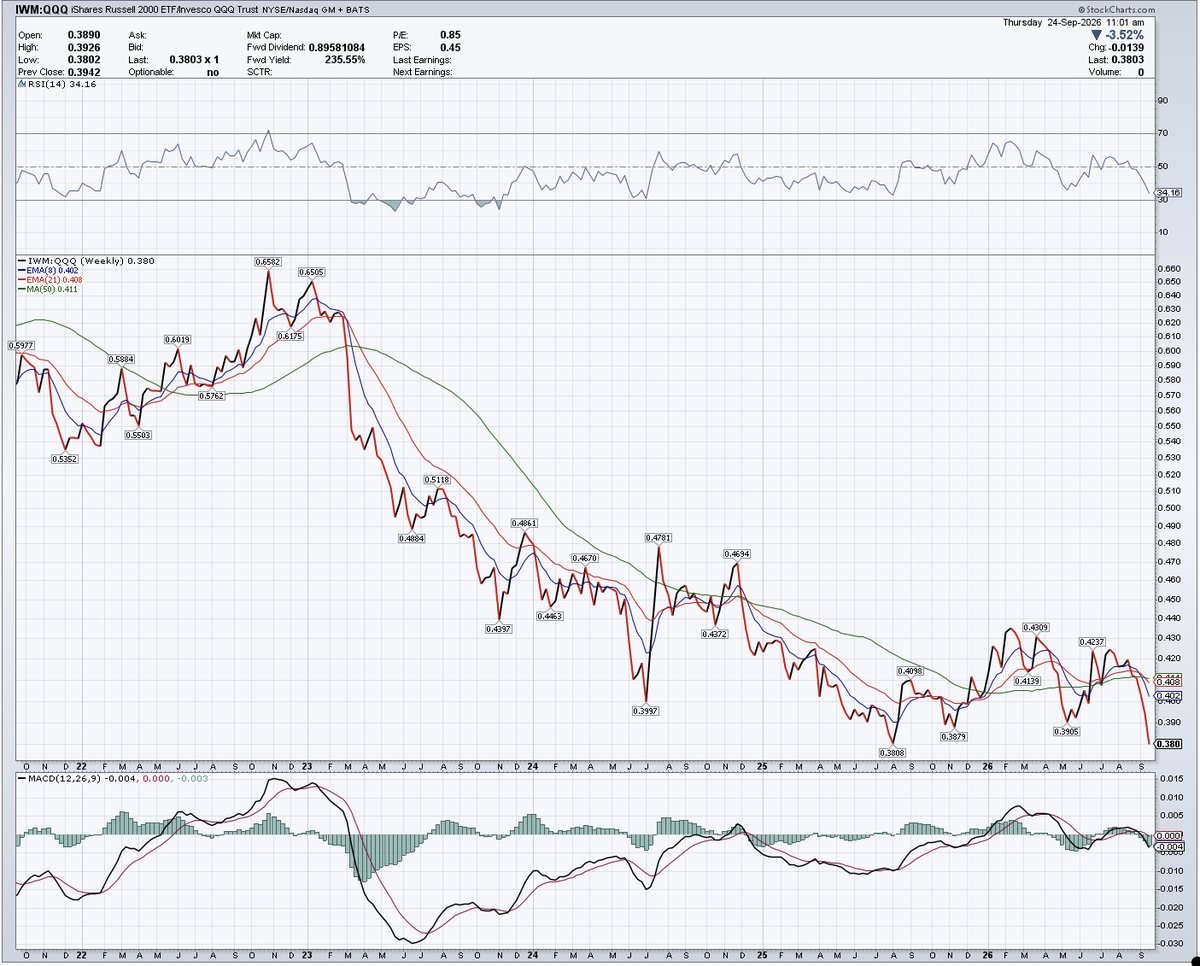
IWM/QQQ weekly ratio (2022-2026) | The ratio has dropped to 0.38, a multi-year low, down sharply from about 0.66 in 2022 as small caps keep lagging
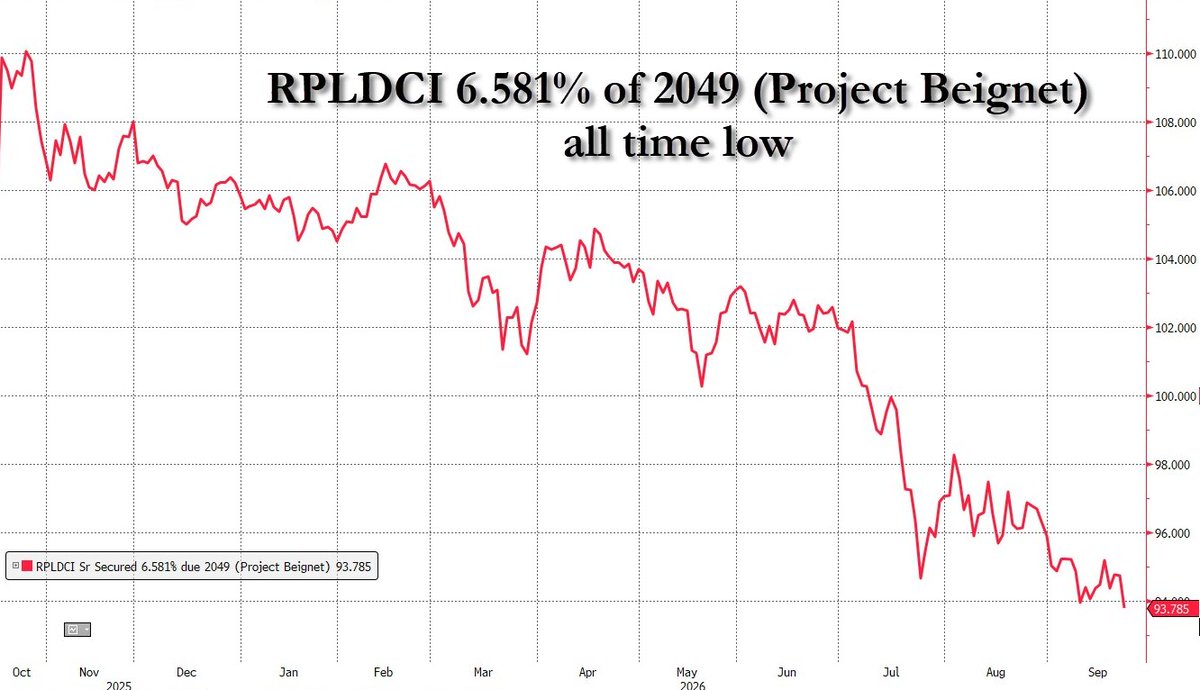
RPLDCI 6.581% senior secured bond due 2049 (2025-2026) | The price has dropped from about 110 to 93.785, an all-time low, as data-center-linked financing comes under pressure
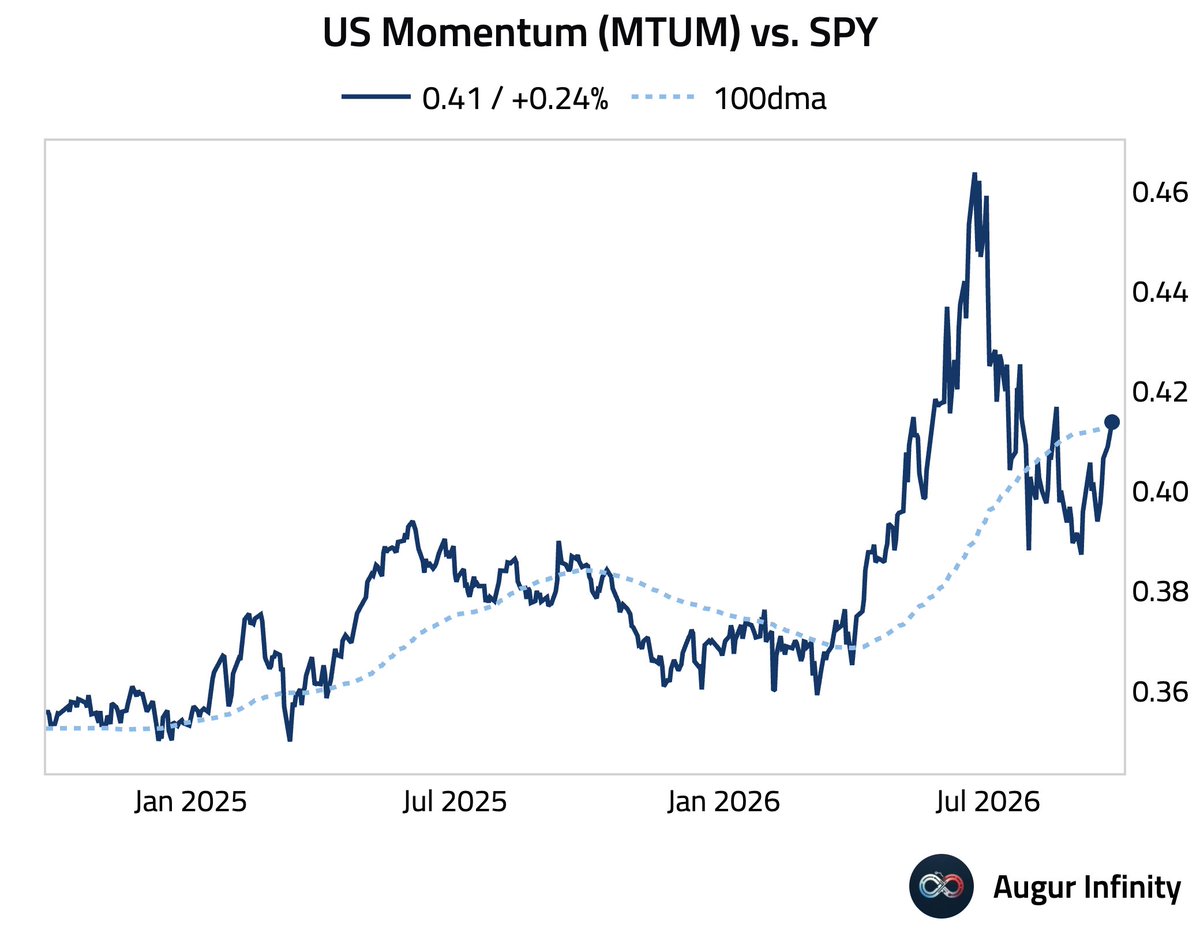
MTUM/SPY relative-strength ratio with 100-day average (2025-2026) | The ratio has recovered to 0.41 and crossed back above its 100-day average, with momentum leading again
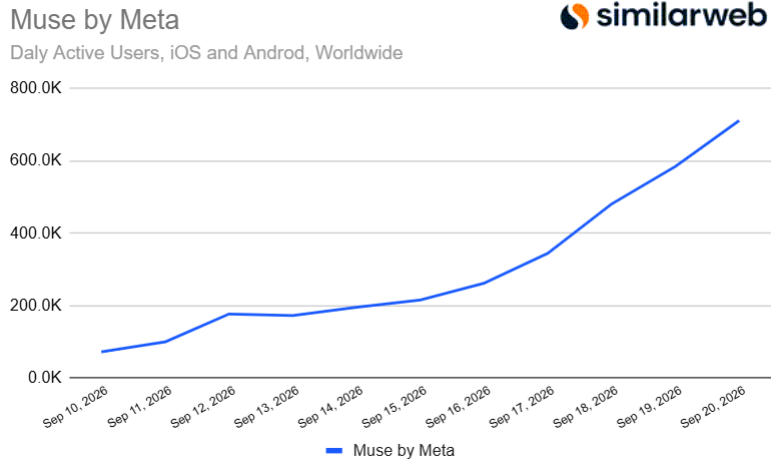
Muse by Meta daily active users, iOS and Android worldwide (Sep 10 to Sep 20) | DAUs climbed from about 70K to roughly 710K, about a tenfold rise in ten days
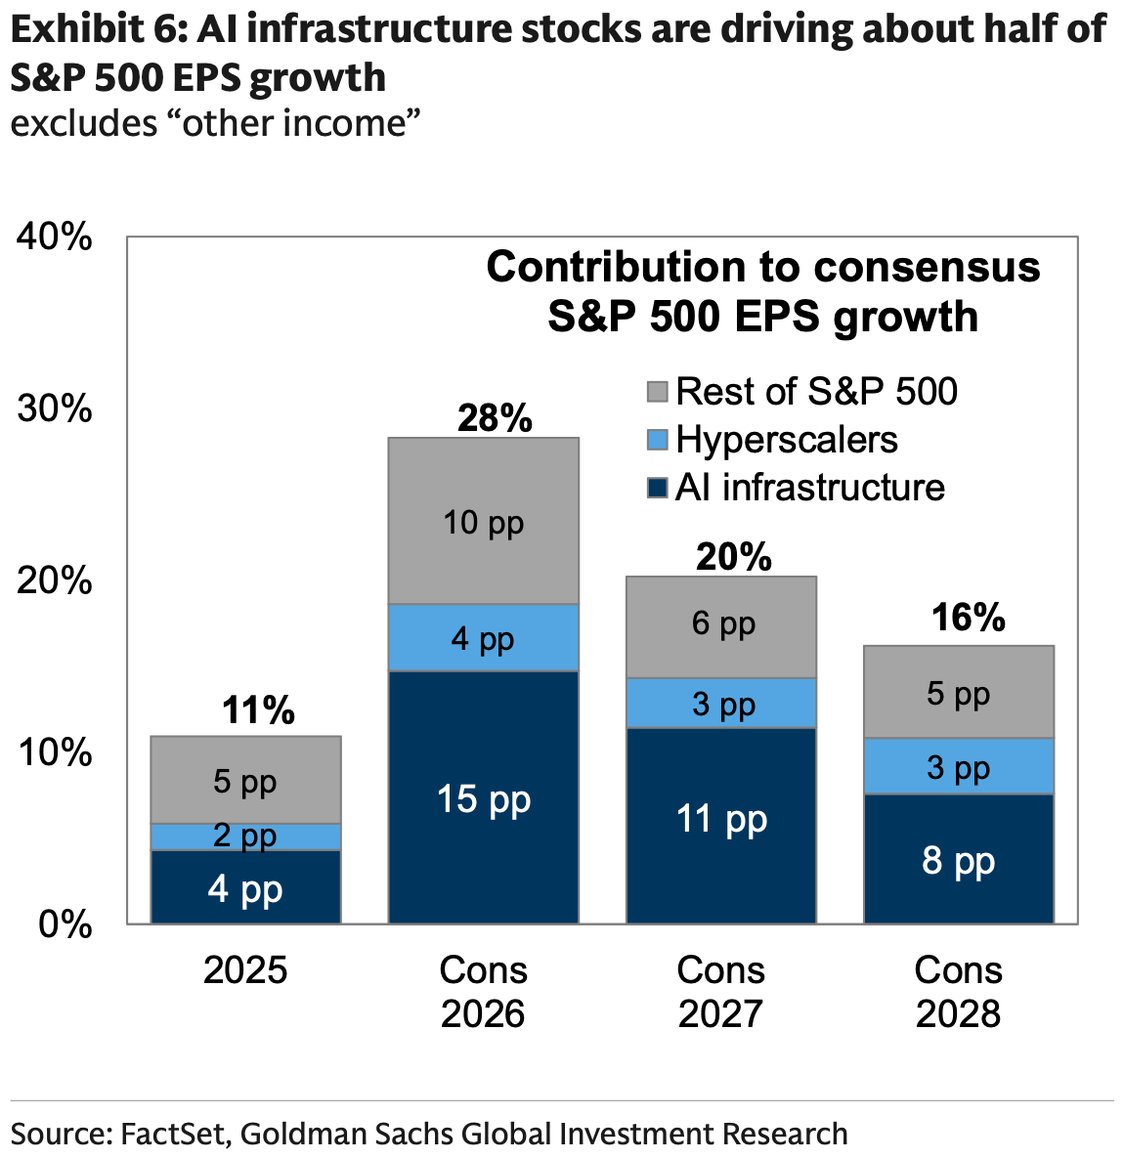
Contribution to consensus S&P 500 EPS growth, AI infrastructure and hyperscalers (2025-2028) | AI infrastructure adds 15pp of the 28% 2026 growth, fading to 8pp by 2028
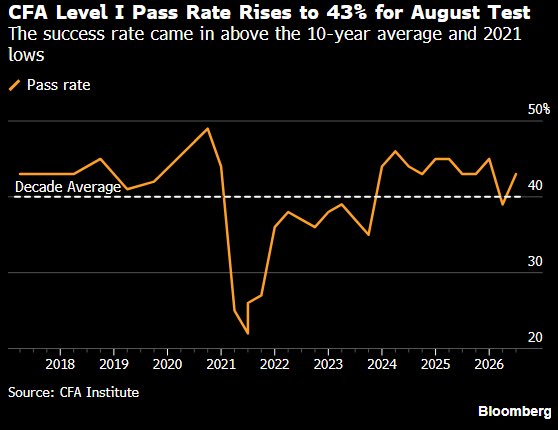
CFA Level I exam pass rate, 2018-2026 | August pass rate rises to 43%, above May's 39% and the 40% decade average
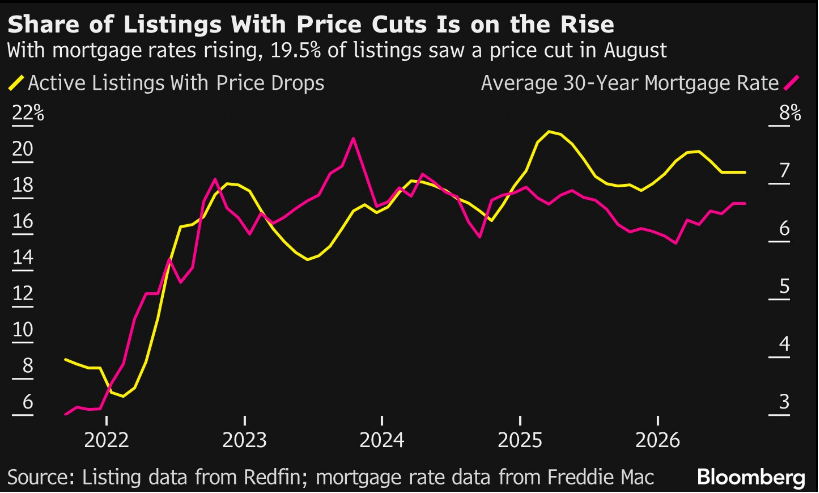
Share of US listings with price cuts vs the 30-year mortgage rate | 19.5% of listings cut prices in August as mortgage rates rose to about 7%
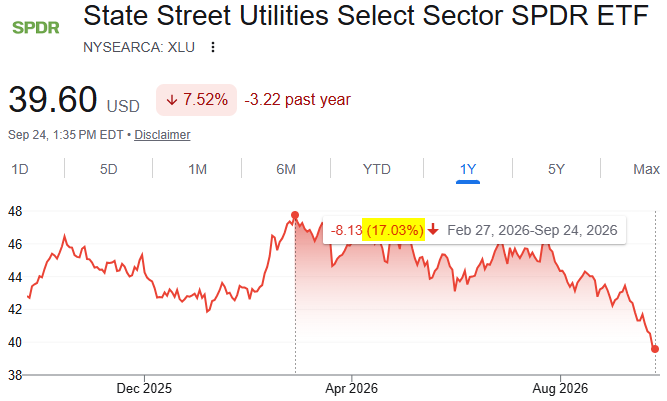
Utilities Select Sector SPDR ETF (XLU), past year | Down 17.03% from its Feb 27 high to $39.60, and 7.52% lower over the year
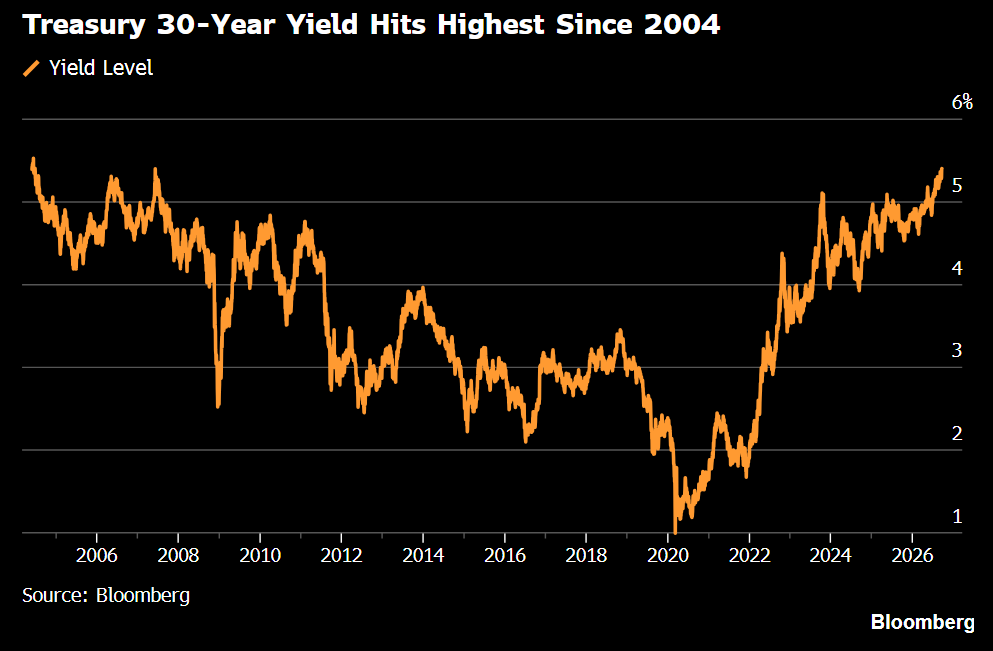
US 30-year Treasury yield, 2005-2026 | Yield rises to ~5.4%, the highest level since 2004
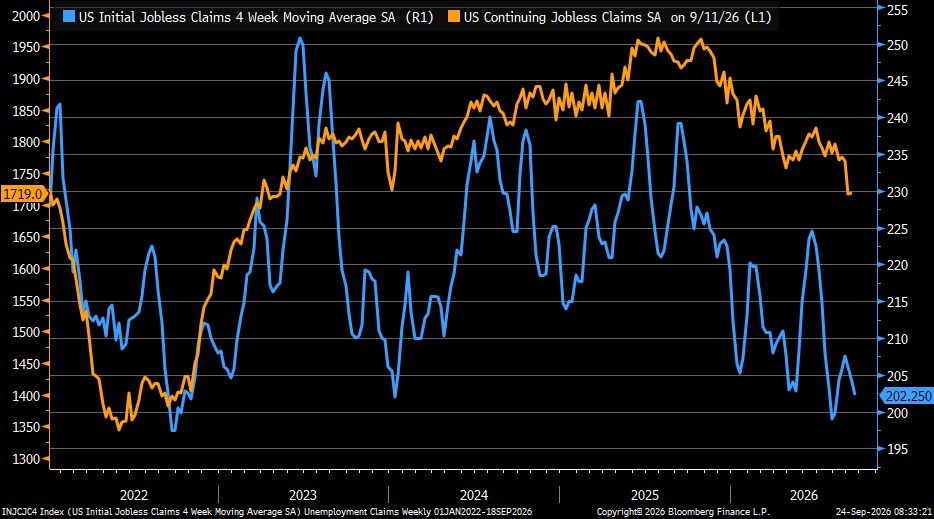
US initial (4-wk avg) and continuing jobless claims, weekly | Continuing claims at 1.72M, a recent low, with the initial 4-wk average near 200k
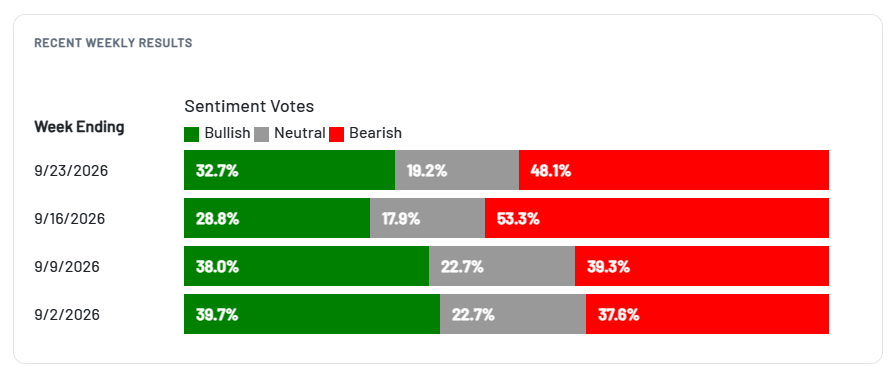
AAII investor sentiment, bullish/neutral/bearish, last four weeks | Week of 9/23 shows 48.1% bearish vs 32.7% bullish and 19.2% neutral
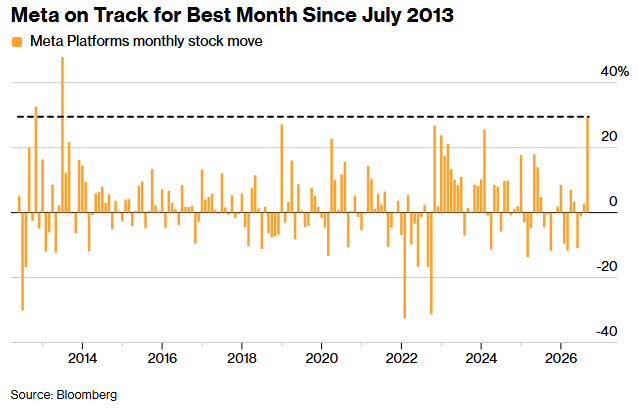
Meta Platforms monthly stock return, % | Up more than 30% in September, the biggest monthly gain since July 2013
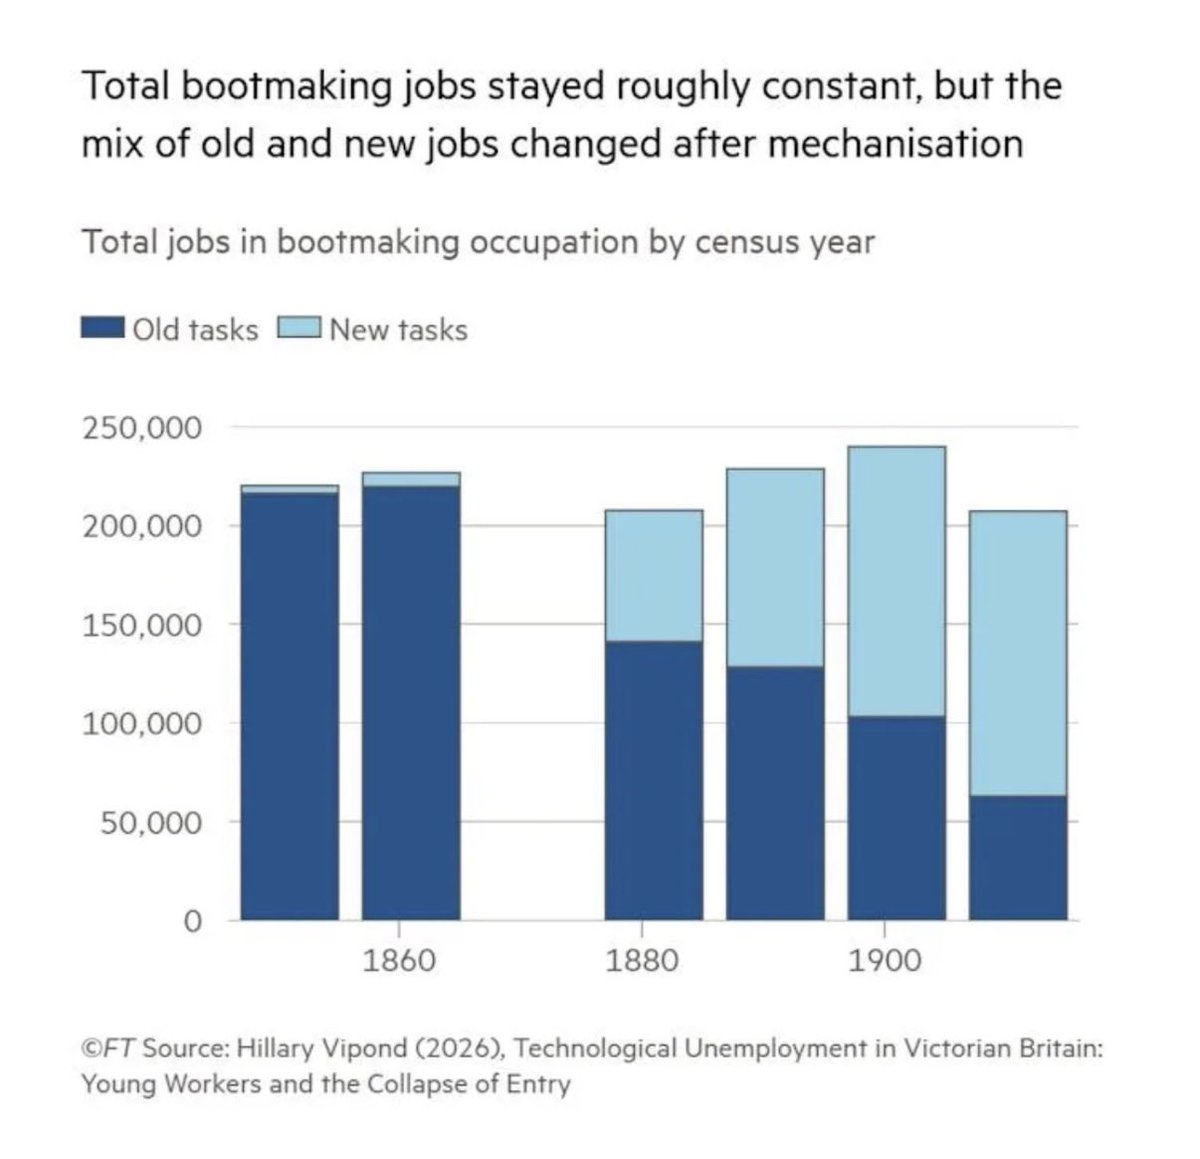
UK bootmaking employment by census year, old vs new tasks | The total held around 200-240k while old-task jobs fell from about 215k to 63k, with new tasks filling the gap
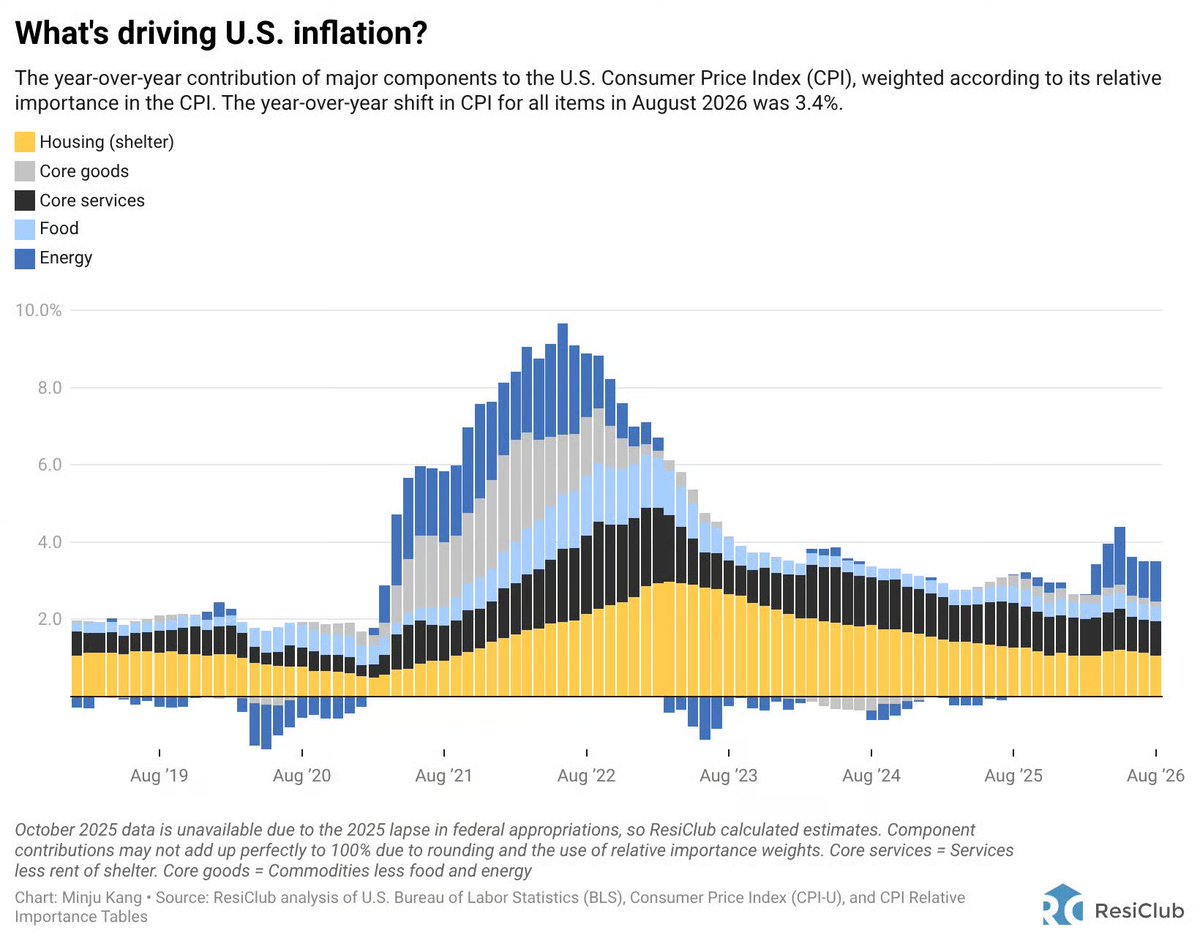
Year-over-year contributions to US CPI by component (Aug 2019 to Aug 2026) | August CPI rose 3.4%, led by shelter and core services, with energy turning into a positive contributor
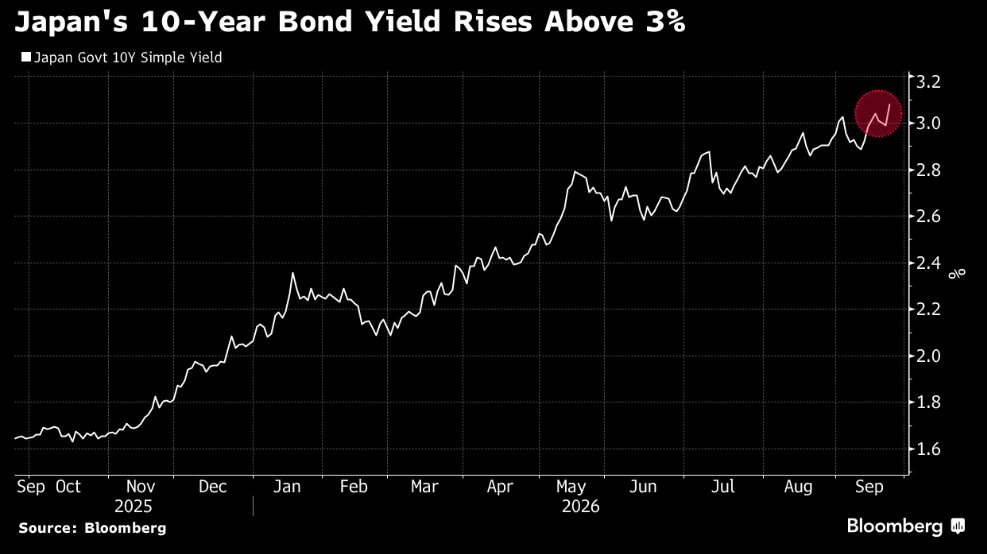
Japan 10-year government bond yield, 2025-2026 | Yield tops 3.0%, the highest since 1996 after nearly doubling in a year
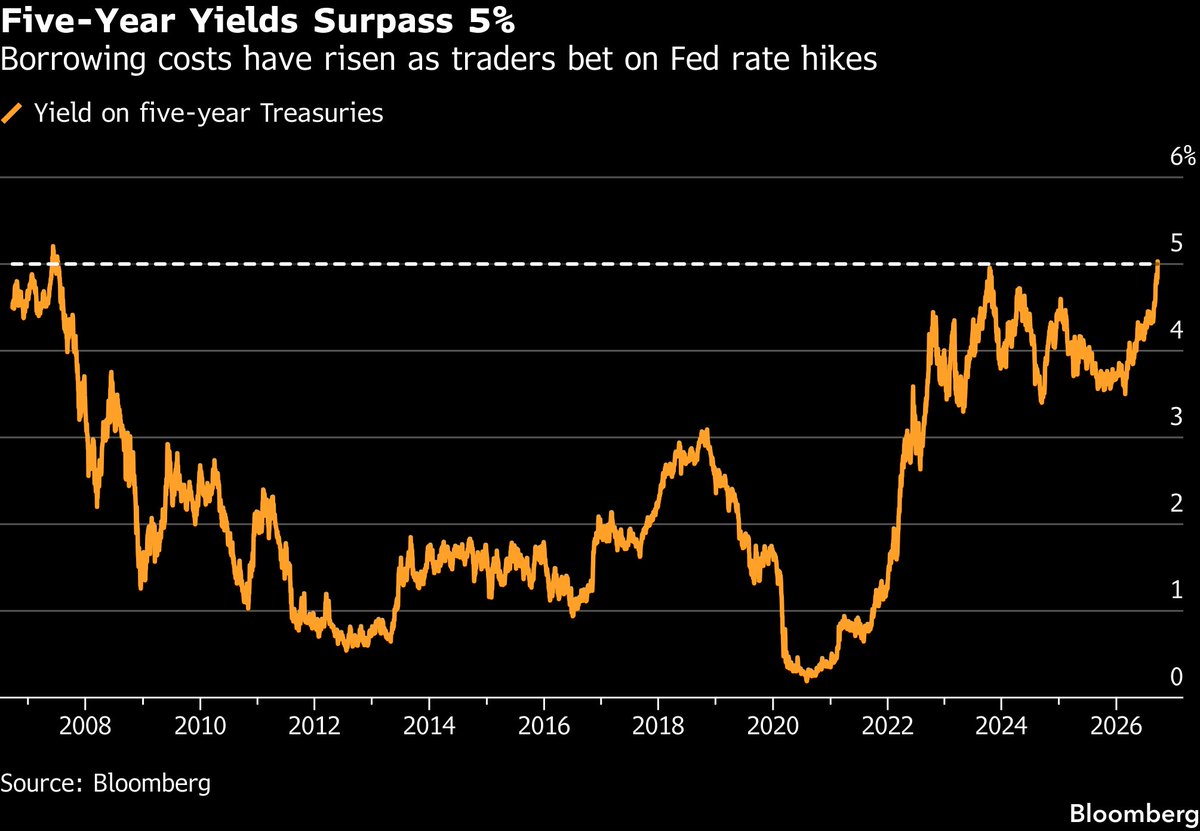
Yield on five-year US Treasuries, 2008-2026 | Yield tops 5% (~5.03%), the first time above that level since 2007
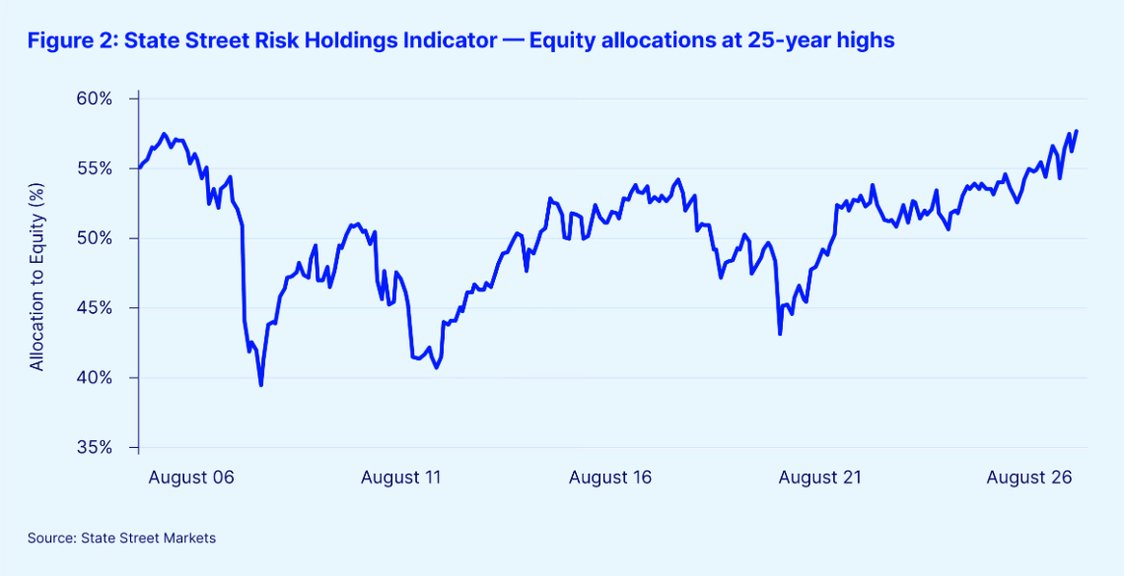
State Street Risk Holdings Indicator, allocation to equity, 2006-2026 | Allocation rises to ~58%, near the highest in 25 years
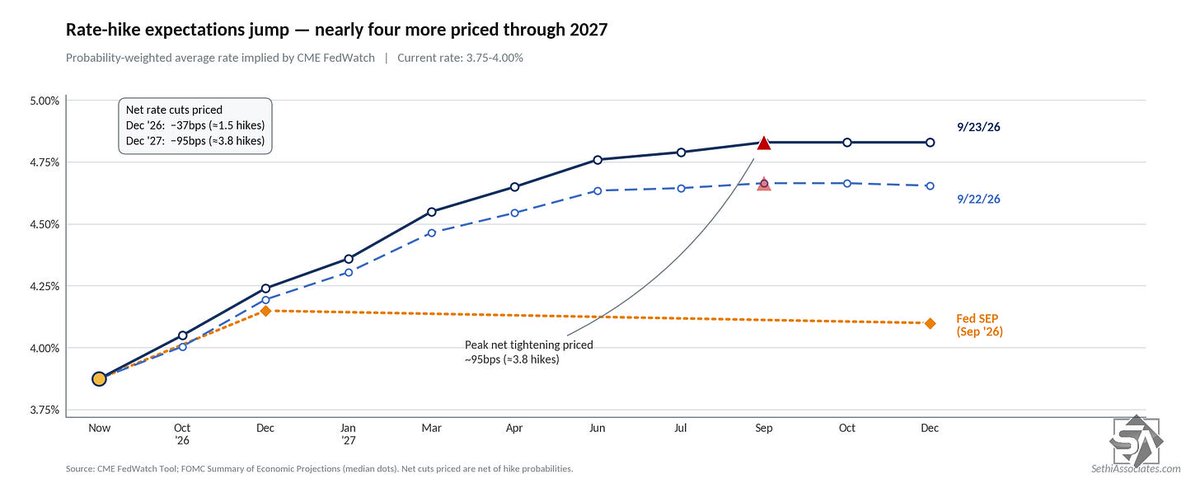
Probability-weighted policy rate path implied by CME FedWatch, through 2027 | The 9/23 curve shifts above 9/22, pricing ~95 bps (near four hikes) by end-2027