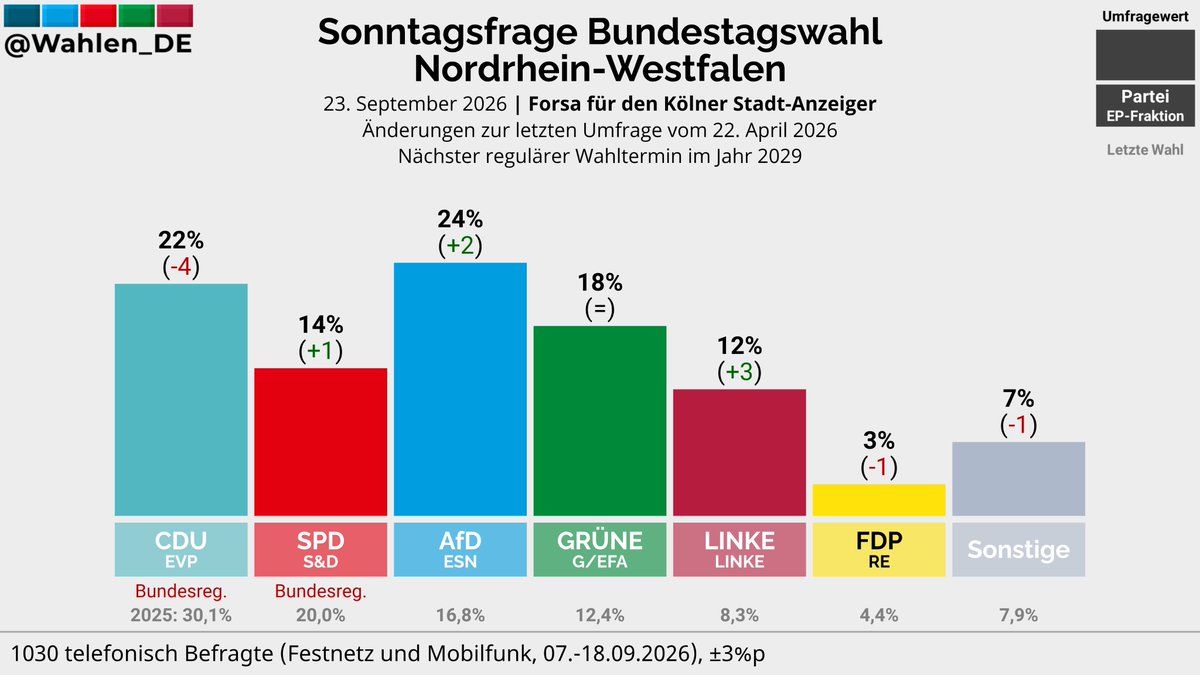
AfD Overtakes CDU in North Rhine-Westphalia Poll at 24% vs 22%
North Rhine-Westphalia federal-election poll (Forsa), Sept 2026 | AfD rises to 24% (+2), passing CDU at 22% (-4); Greens 18%, SPD 14%
English financial charts and market context published in 2026-09, page 35.
North Rhine-Westphalia federal-election poll (Forsa), Sept 2026 | AfD rises to 24% (+2), passing CDU at 22% (-4); Greens 18%, SPD 14%
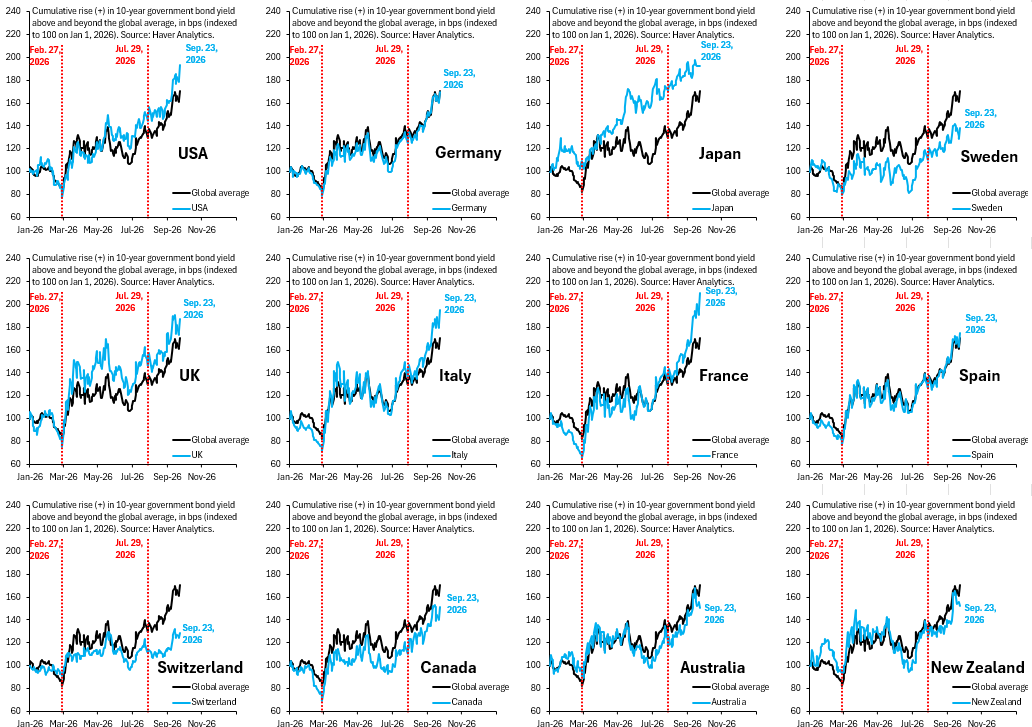
Cumulative rise in 10-year government bond yields above the global average, in bps, indexed to 100 on Jan 1, 2026 | US, Japan, Italy and France exceed 180 as global bond markets weaken together
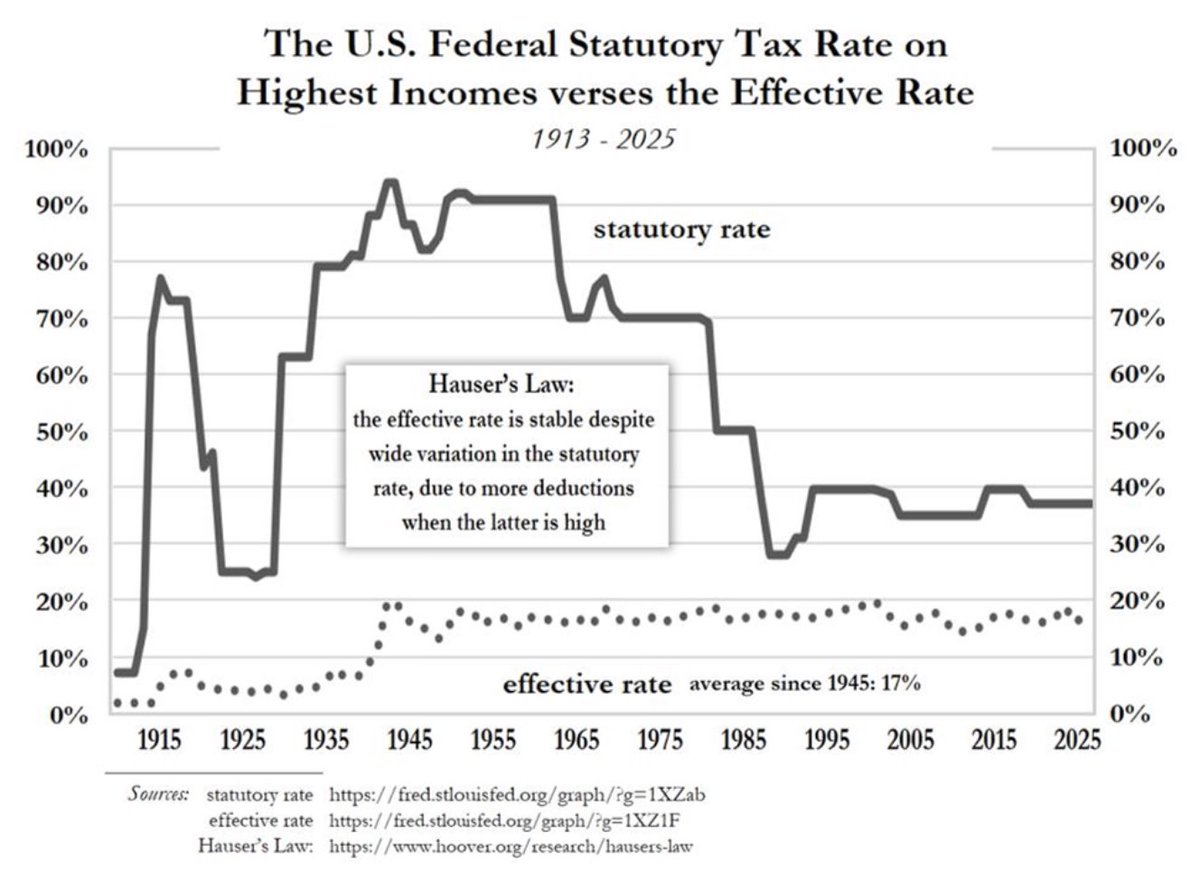
US top statutory vs effective income tax rate, 1913-2025 (%) | Statutory rate once topped 90%; effective rate has averaged ~17% since 1945
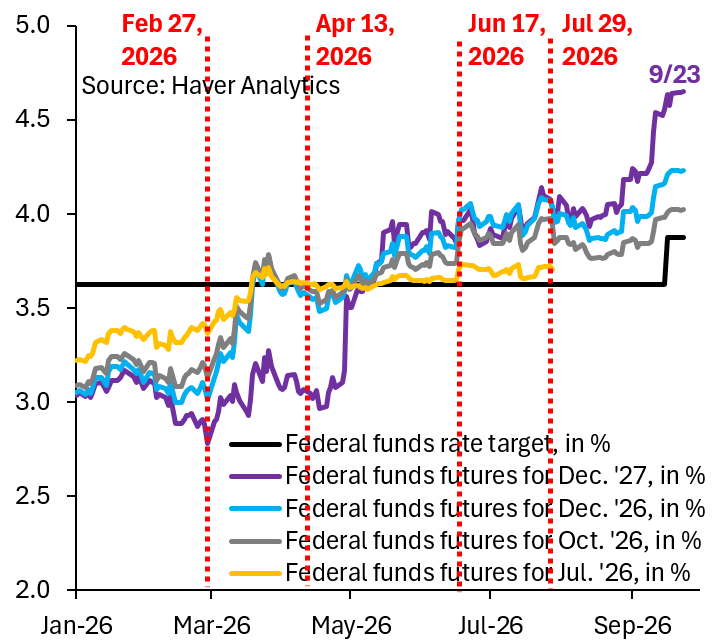
Fed funds futures-implied rates, Jan-Sep 2026 | Dec-27 contract rose to 4.65% on 9/23, above the 3.875% current target
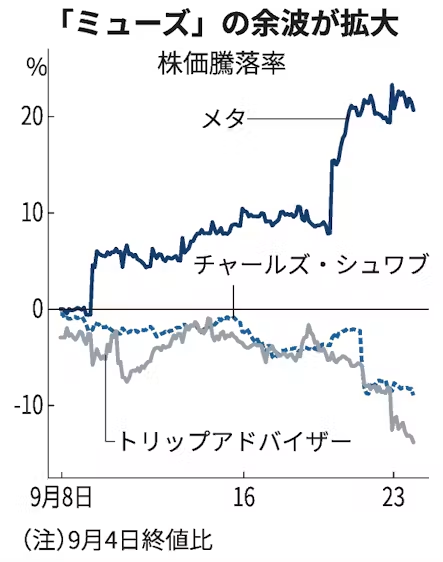
Share-price change for Meta, Schwab and TripAdvisor, Sep 8-23 | Meta up over 20% while TripAdvisor drops ~13%, indexed to the Sep 4 close
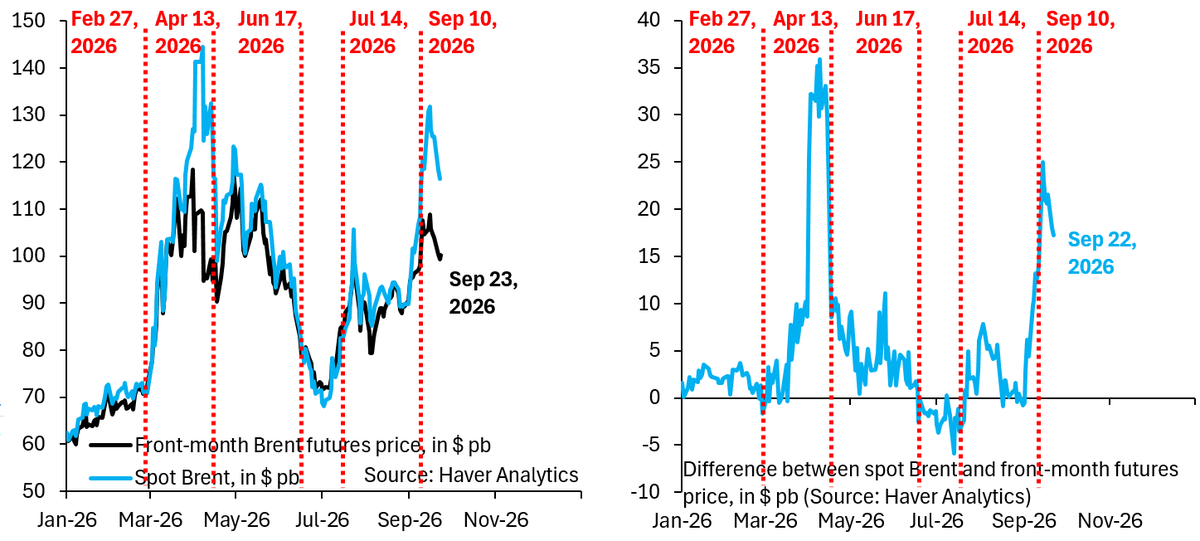
Spot vs front-month Brent crude and their spread ($/bbl), 2026 | Spot Brent recently spiked to ~$130, widening its premium over front-month futures to ~$20-25
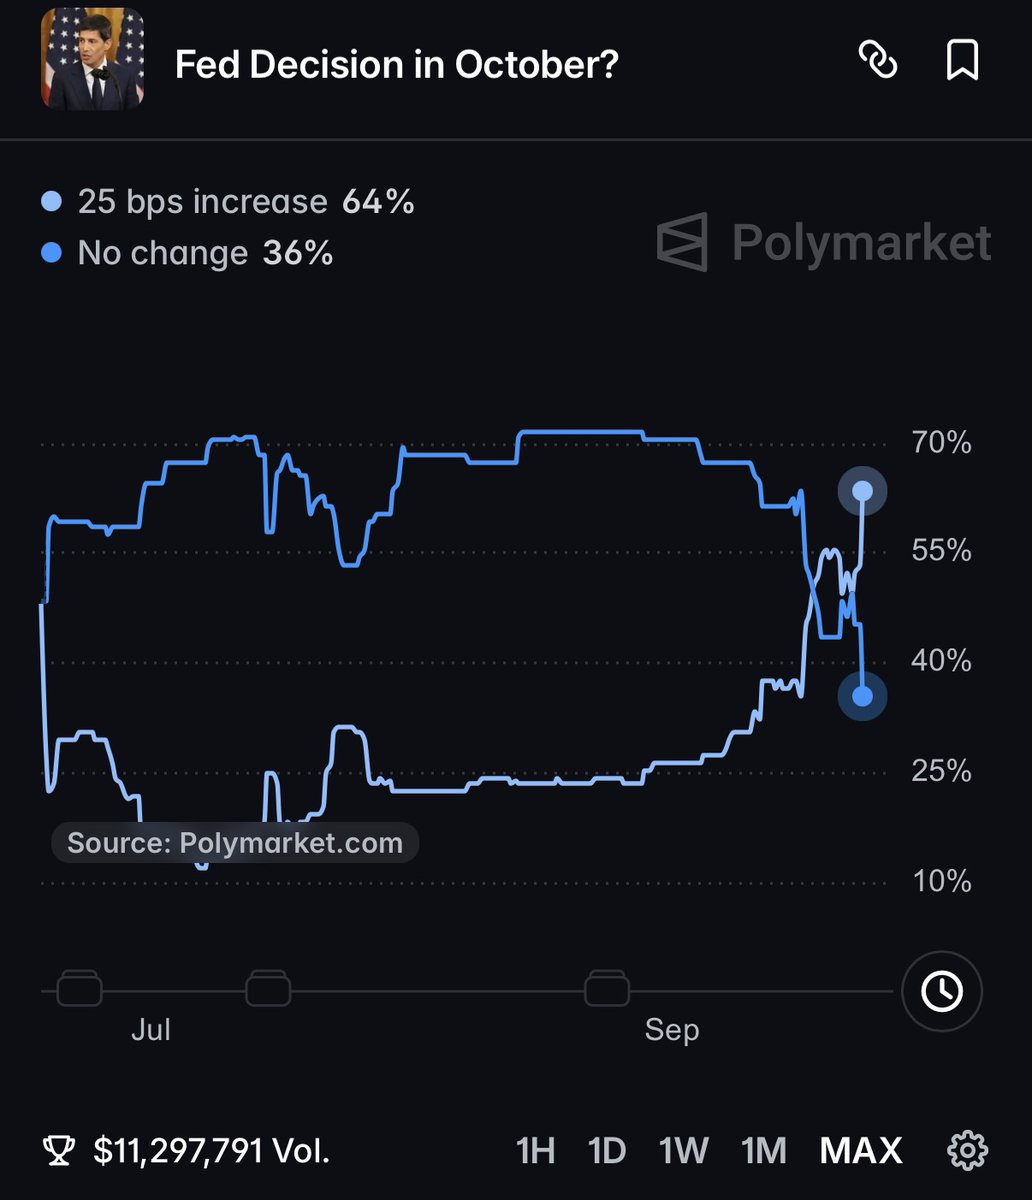
Polymarket-implied probabilities for the October Fed decision | A 25bp increase at 64% versus no change at 36%, a sharp recent swing toward a hike
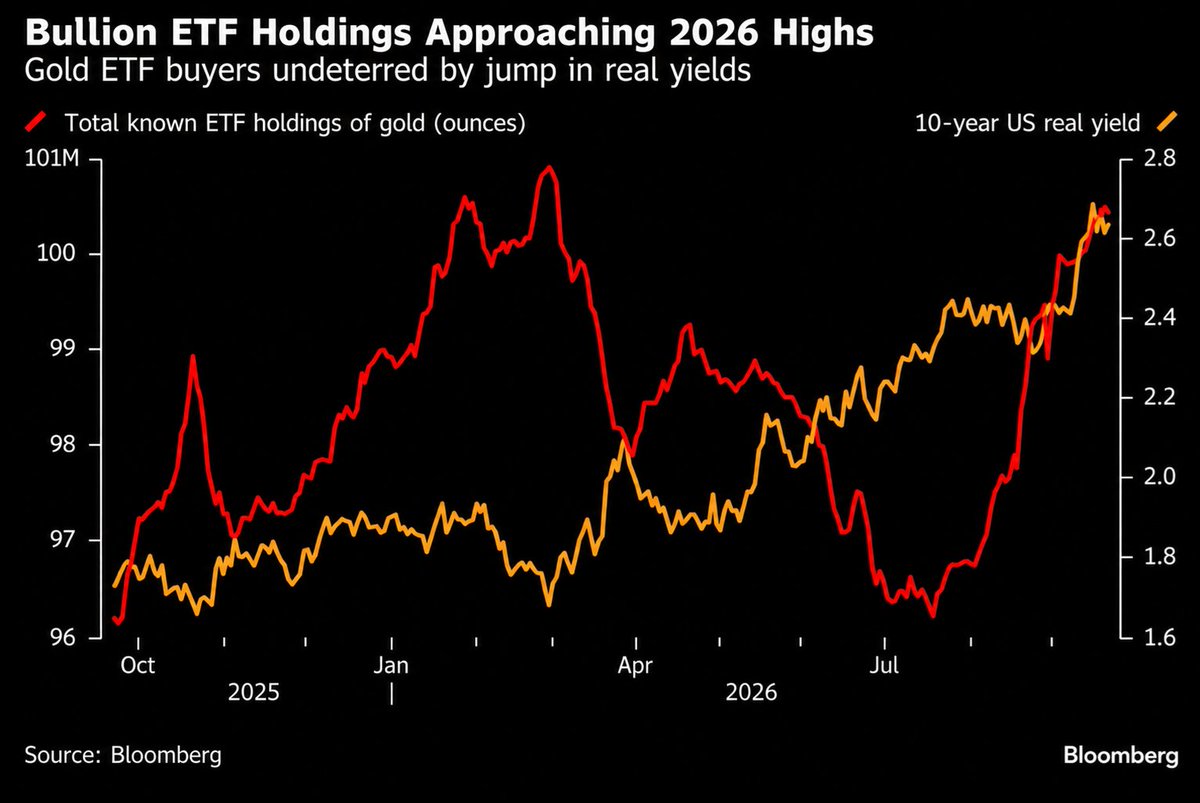
Total known gold ETF holdings in ounces vs the 10-year US real yield | Holdings rise to about 100.5 million ounces while the real yield jumps above 2.6%, leaving demand undeterred
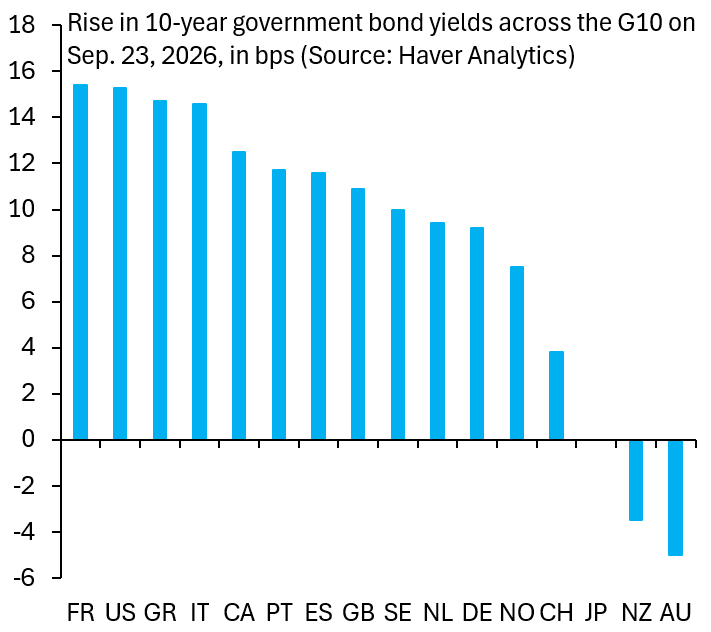
One-day change in G10 10-year government bond yields (bps), 2026-09-23 | France +15.4bps leads, ahead of the US +15.3bps; only Japan, NZ and Australia fell, Australia -5bps
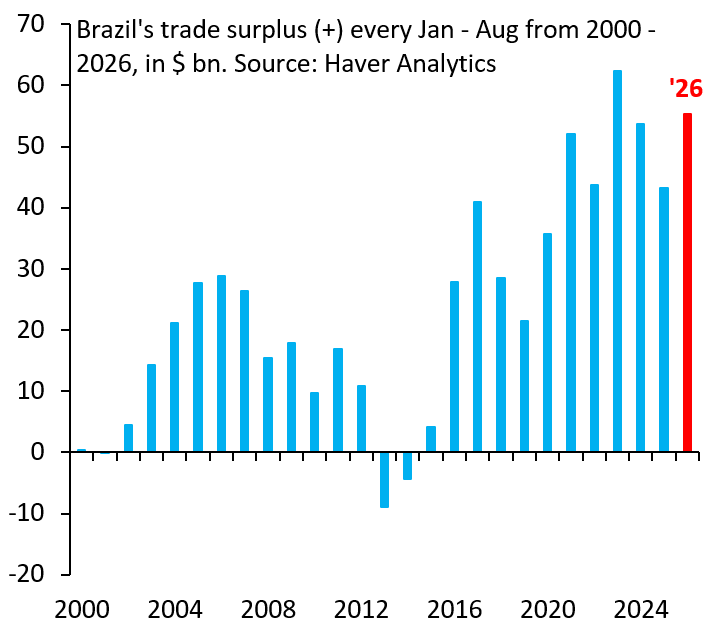
Brazil's Jan-Aug trade surplus, $bn | ~$55bn in 2026, second only to the ~$62bn record set in 2023
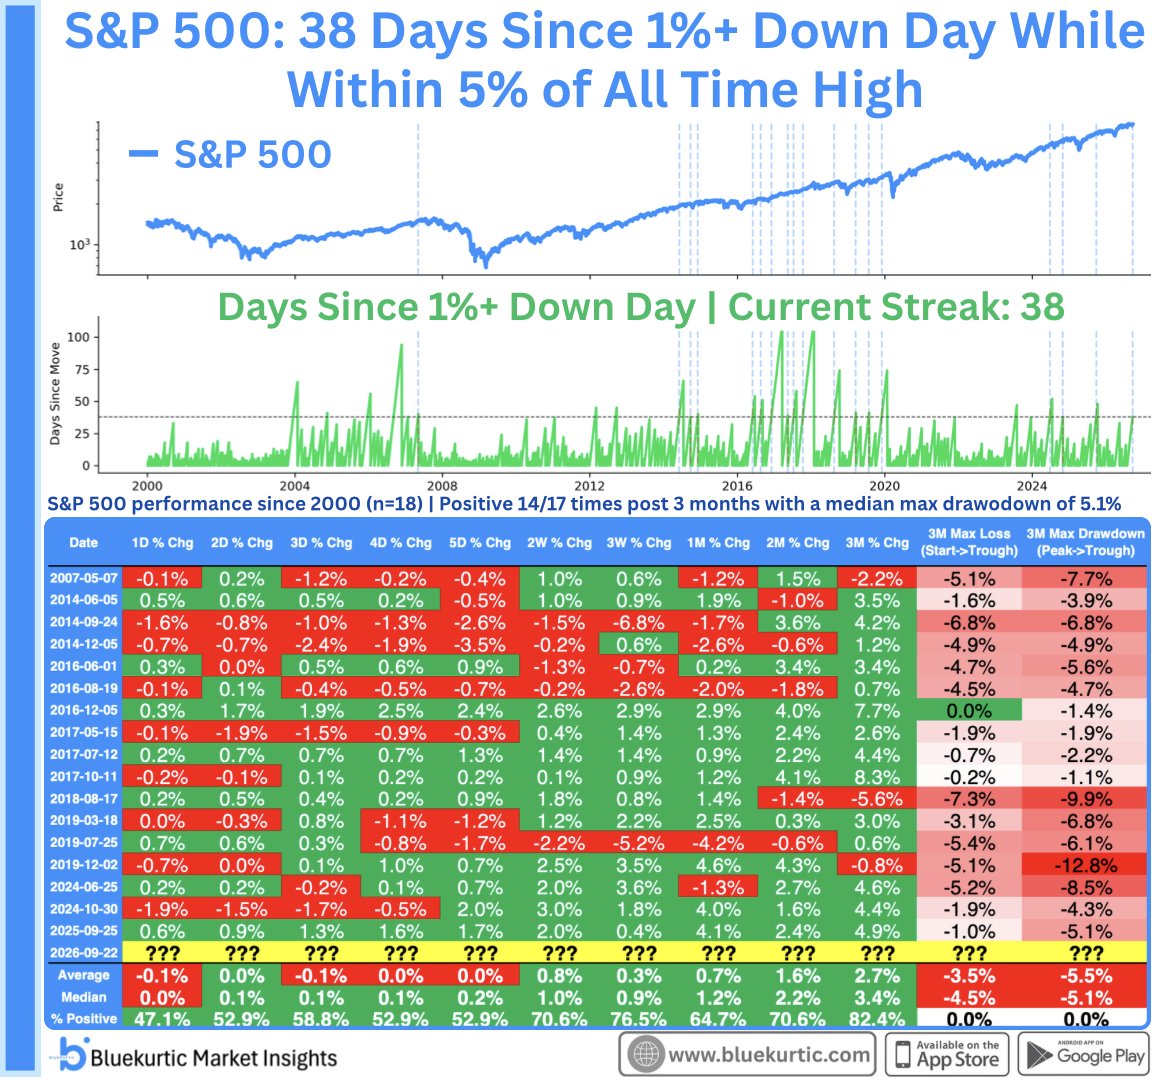
S&P 500 calm streaks and subsequent returns since 2000 (n=18) | Current run is 38 days without a 1% decline; in past cases the index was higher 3 months later 14 of 17 times, with a median max drawdown of 5.1%
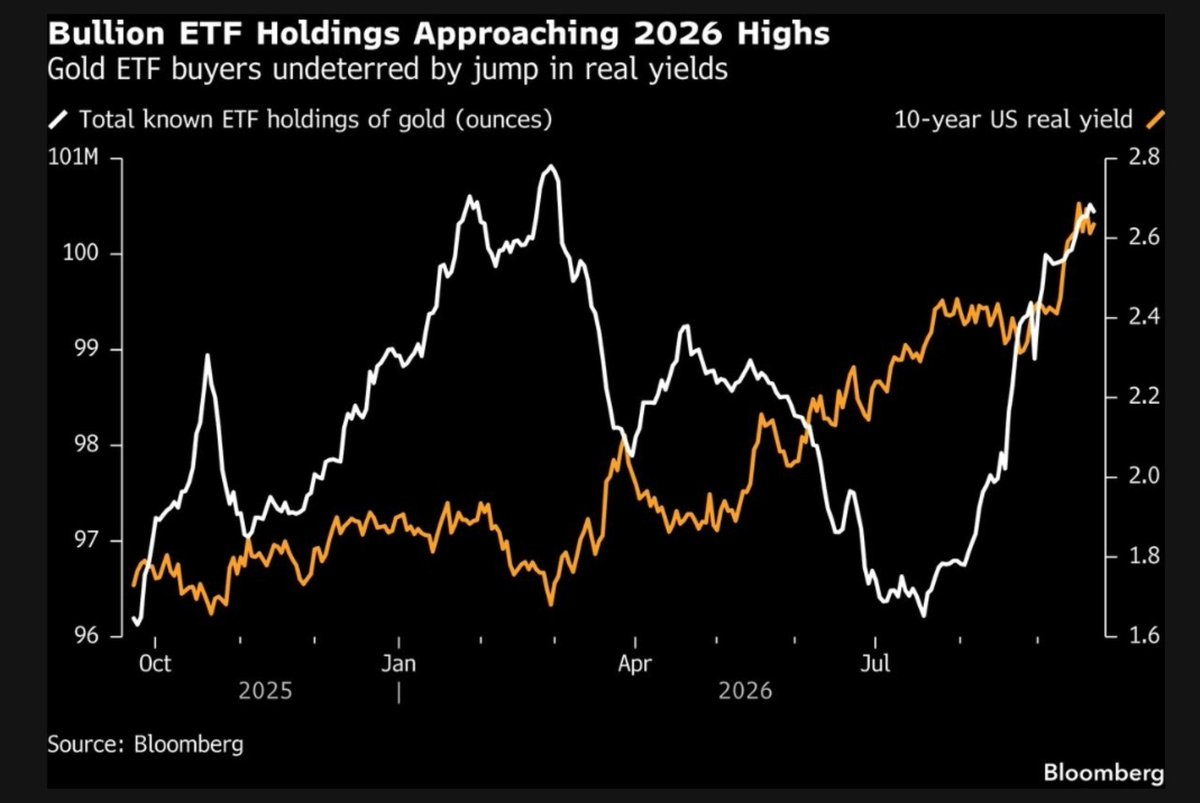
Total known gold ETF holdings (ounces) vs the US 10-year real yield | Holdings near a 101M-ounce high as the 10-year real yield climbs to ~2.65%, with buyers undeterred
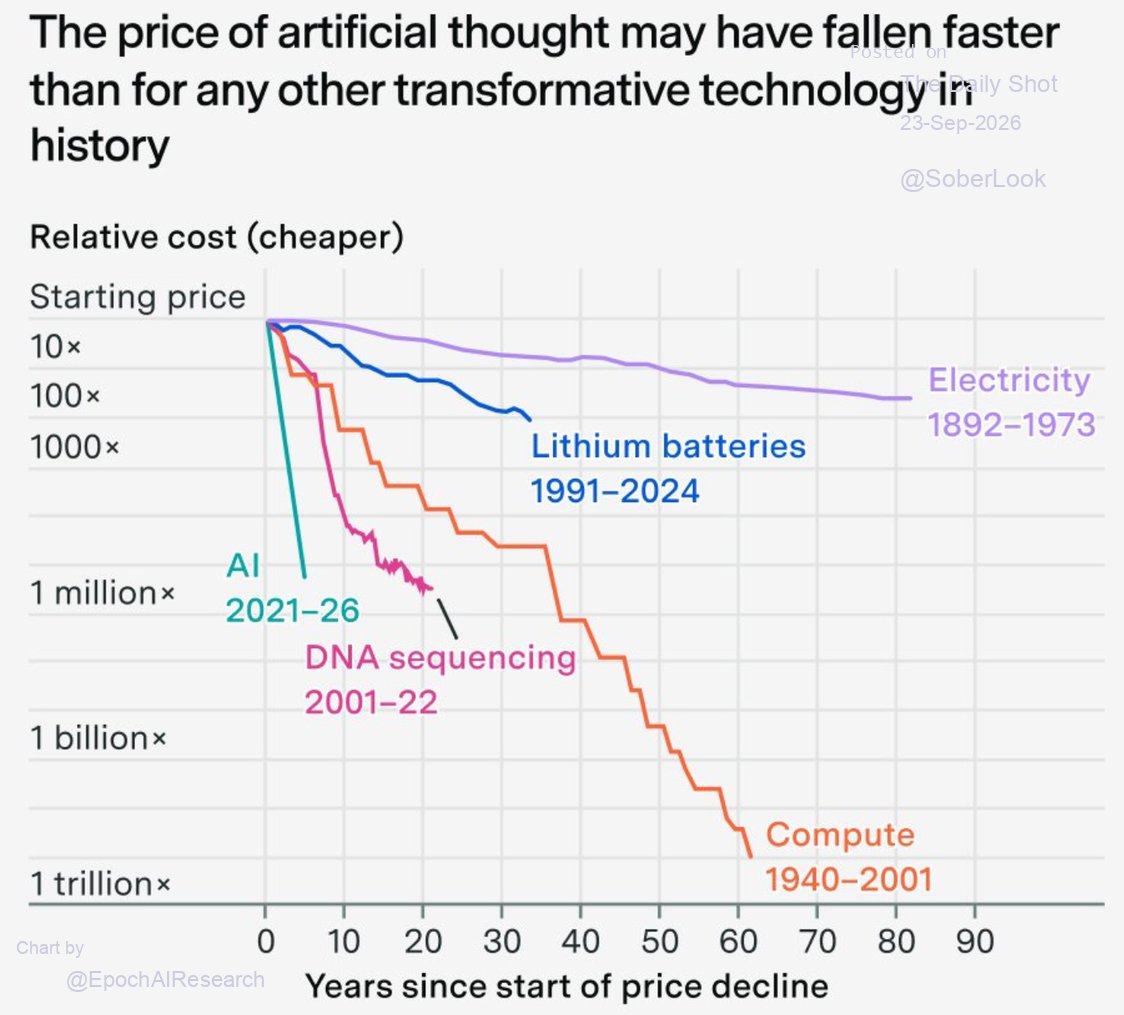
Relative cost decline of five transformative technologies | AI drops about 1,000,000x in roughly 5 years, far steeper than compute's 60-year or electricity's 80-year path
Nvidia price to estimated profits, 2016-2026 | Recently down to about 15x, the lowest in more than a decade
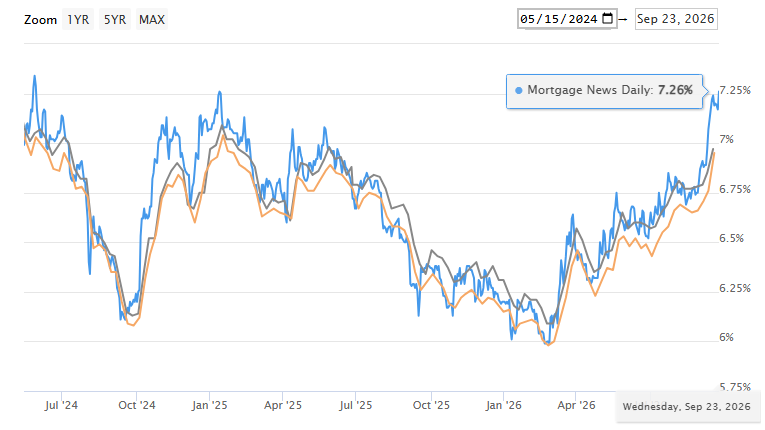
US 30-year mortgage rate, Mortgage News Daily | Up to 7.26%, the highest since May 2024
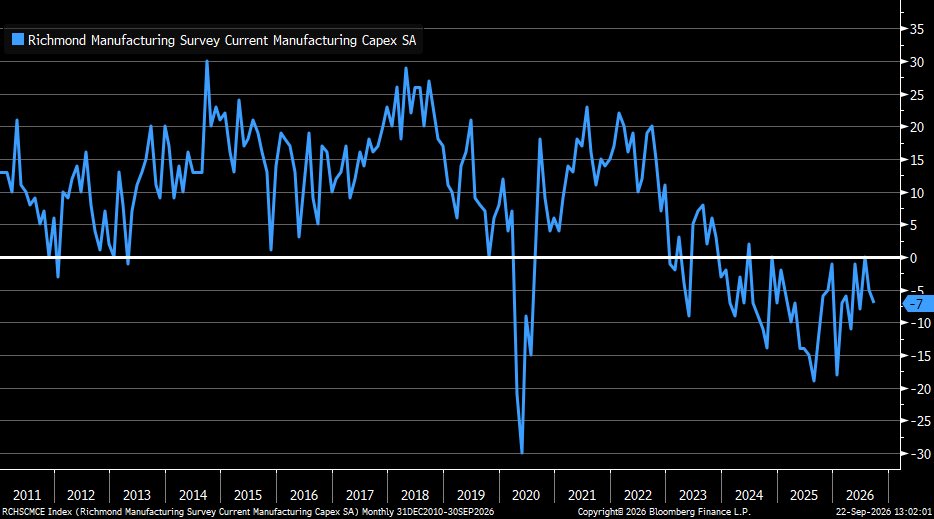
Richmond Fed Manufacturing Survey current capex, SA | Around -7 in September, still contracting after more than two years
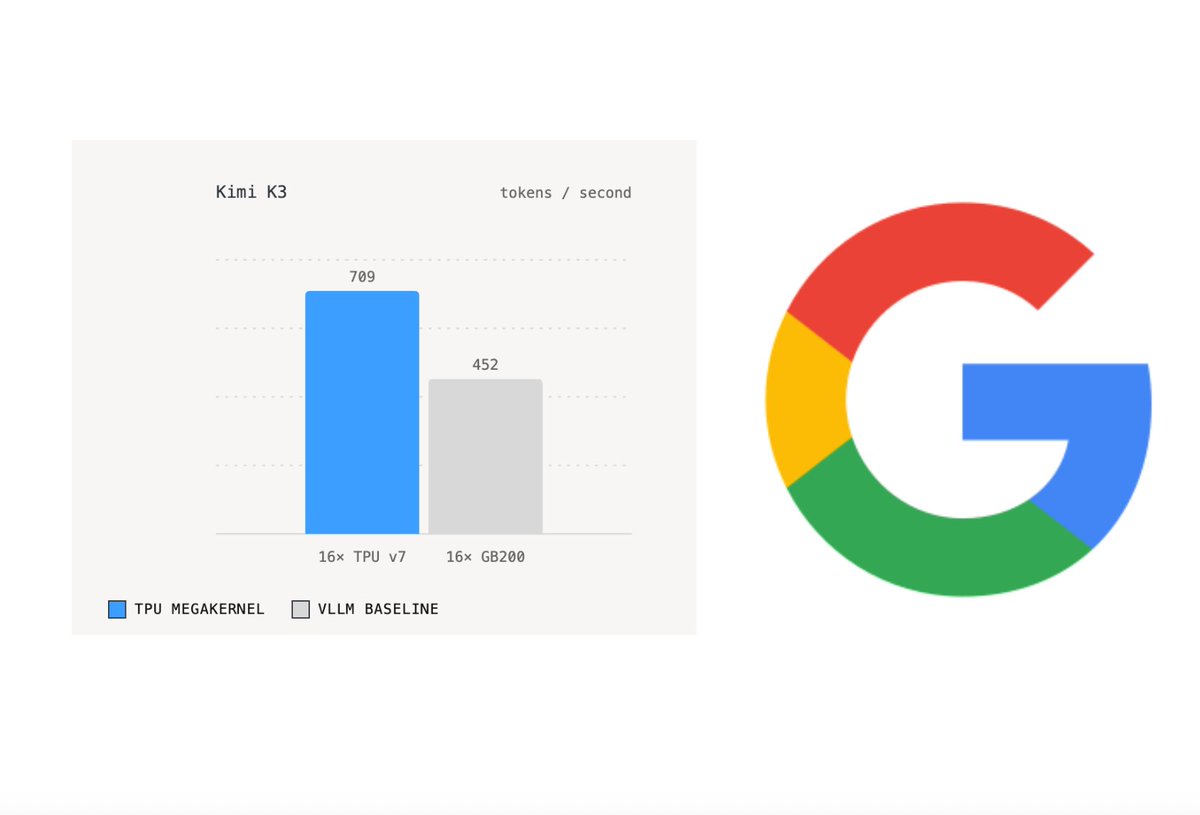
Kimi K3 inference throughput, tokens/sec, TPU v7 vs GB200 | 16× TPU v7 at 709 tok/s, ~57% above 16× GB200's 452
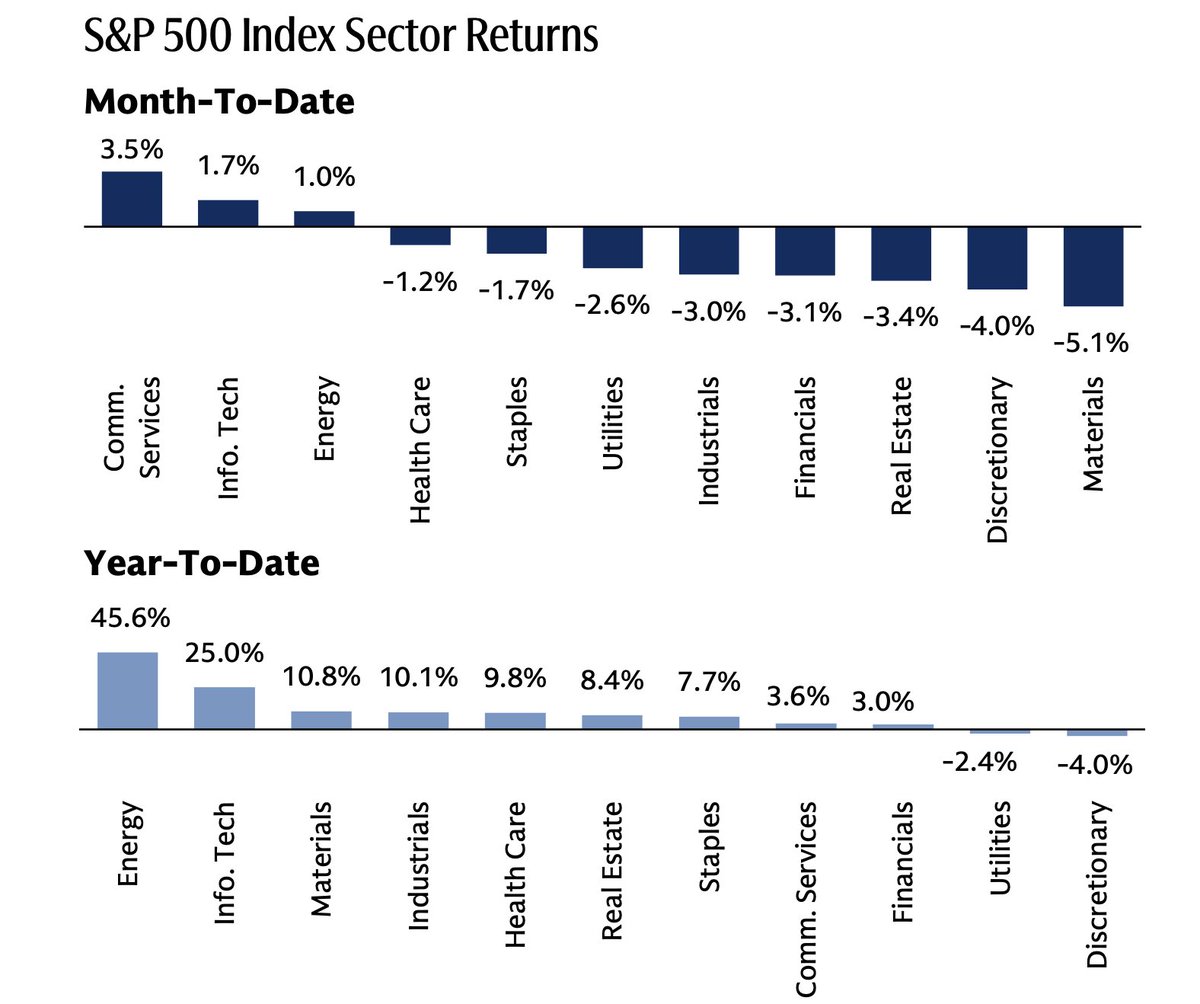
S&P 500 sector returns, month-to-date and year-to-date | Energy +45.6% and Info Tech +25.0% lead YTD; Materials -5.1% is the worst MTD
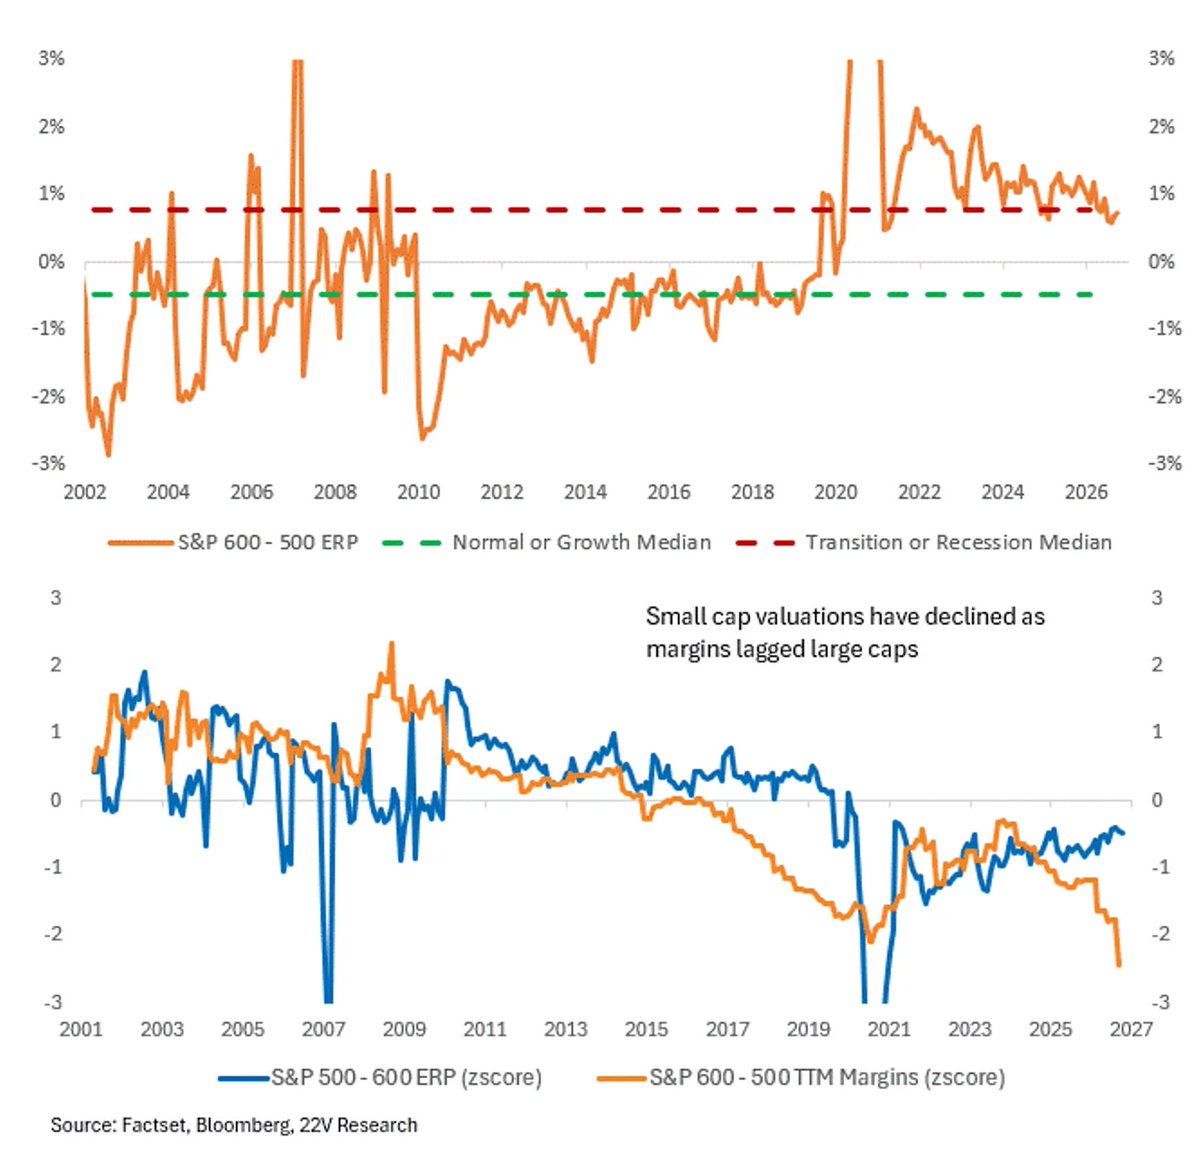
Small vs large-cap equity risk premium and margins (z-scores), 2001-2026 | The S&P 600 minus 500 margin z-score fell to ~-2.5 as small-cap valuations declined with lagging profits
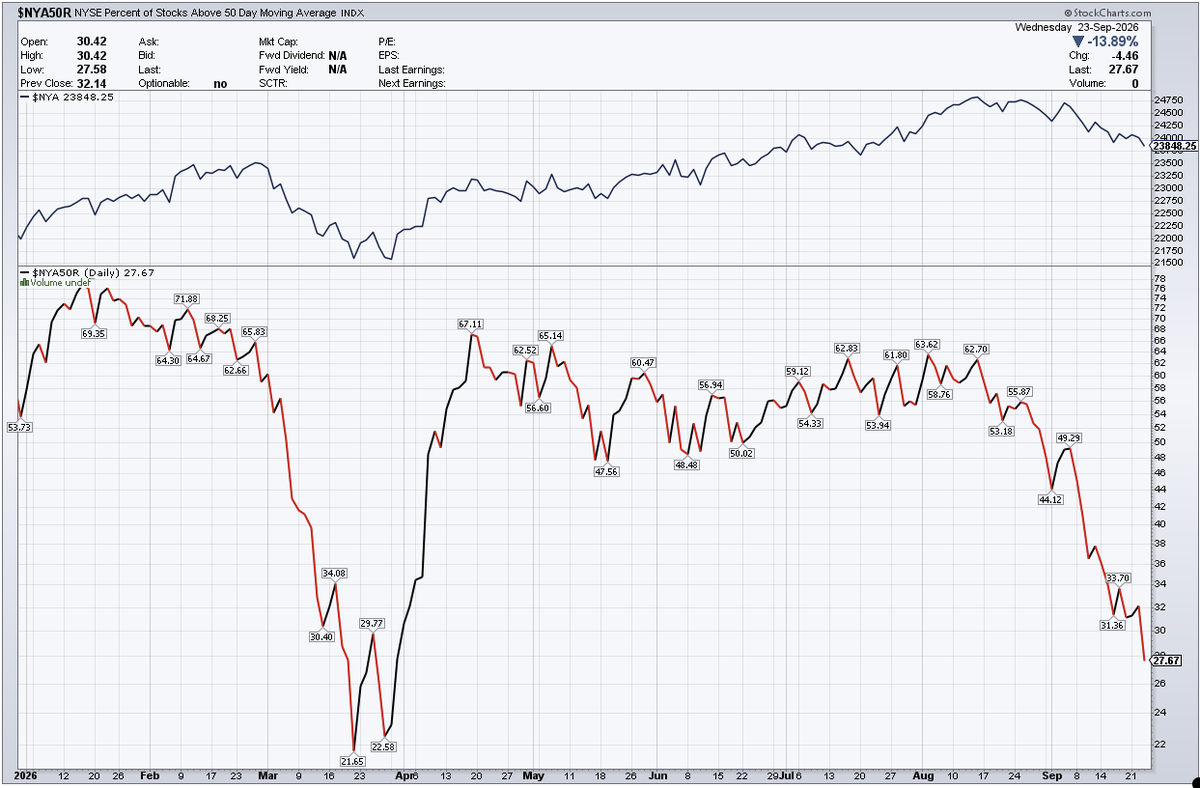
NYSE % of stocks above the 50-DMA | Down to 27.67% (-13.9% on the day), approaching the March low near 21.65%
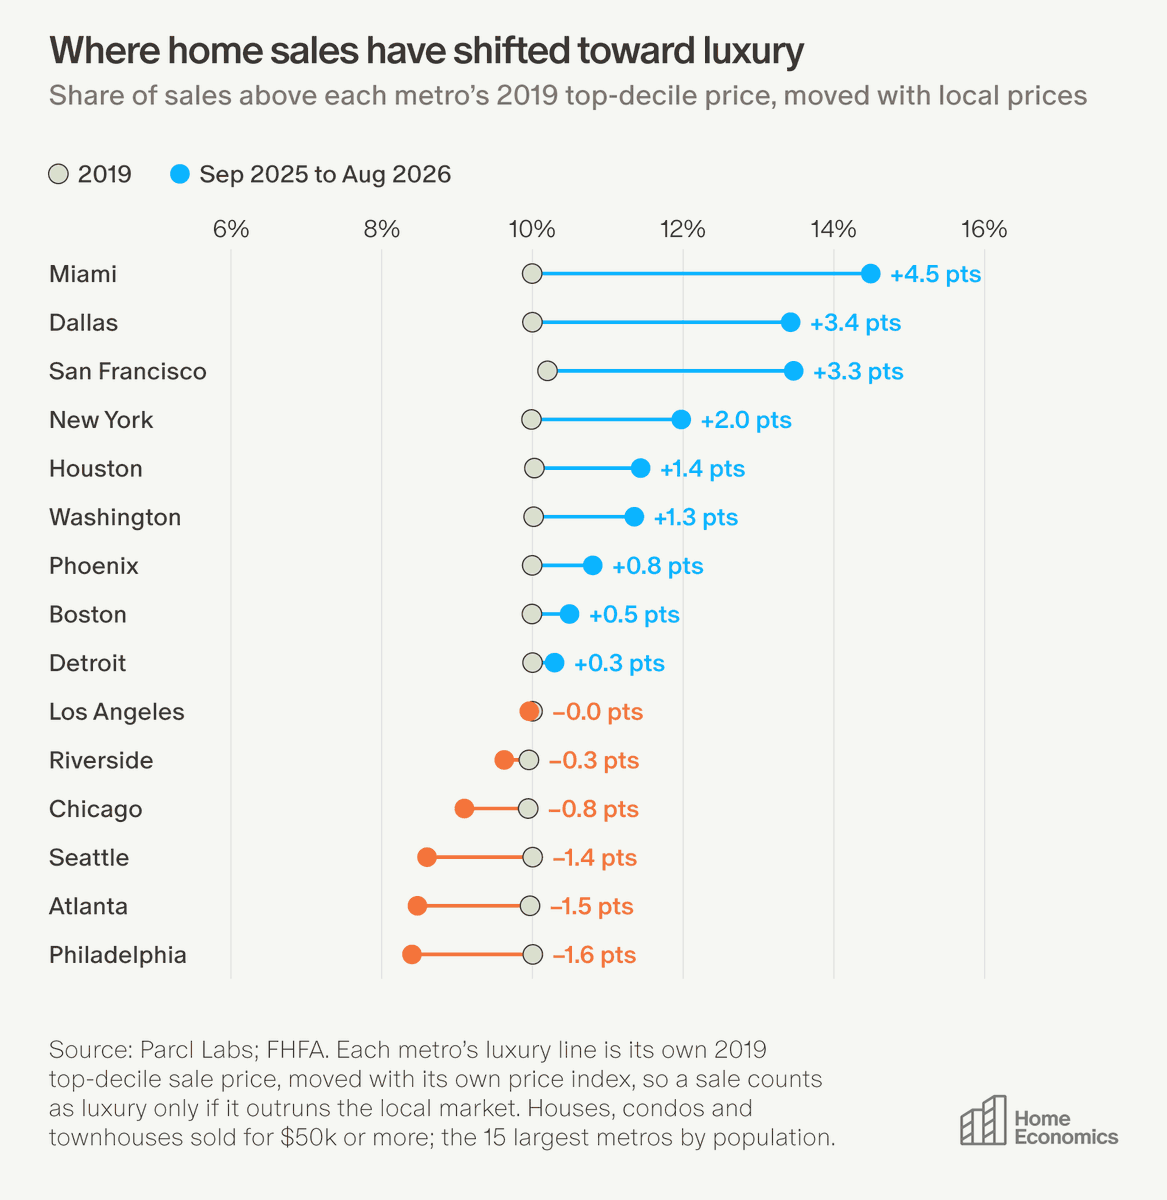
Change in luxury share of home sales by metro vs 2019, Sep 2025-Aug 2026 | Miami +4.5pts leads, Dallas and SF up 3+pts, Philadelphia -1.6pts
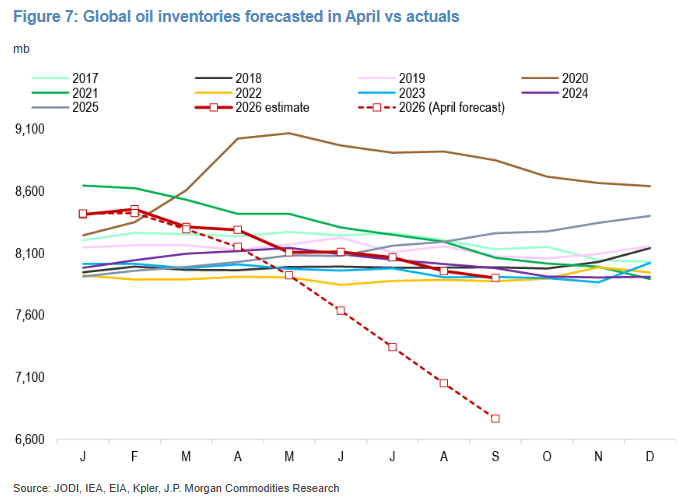
Global oil inventories (mb), seasonal by month | April forecast saw a draw to ~6,700, but actuals hold near ~7,900
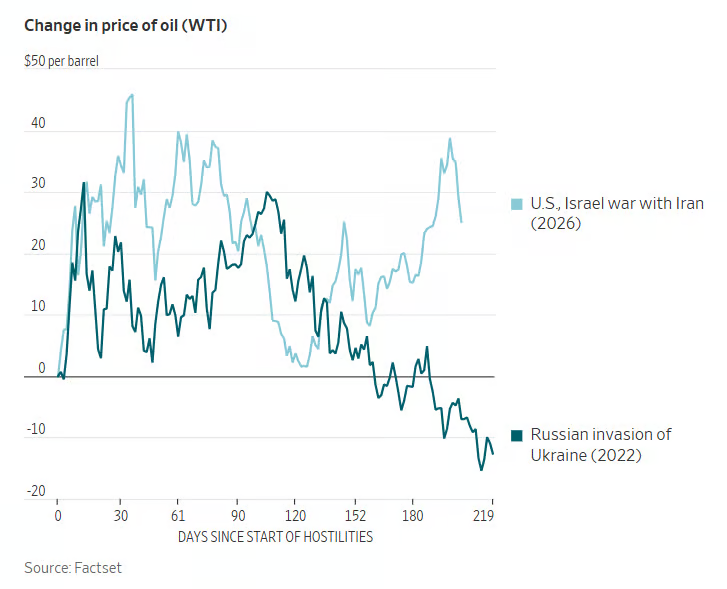
WTI oil change vs pre-invasion price | ~$25 above after 200 days, versus ~$7 below at the same point post-Ukraine
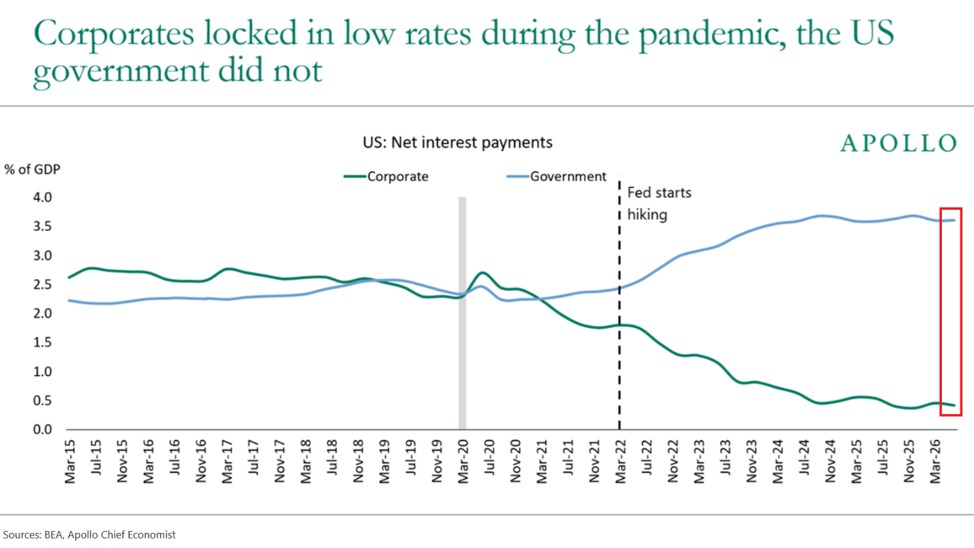
US net interest payments as a share of GDP, corporate vs government, 2015-2026 | Corporate falls to about 0.4% while government climbs to about 3.6%, diverging sharply after the Fed's hikes
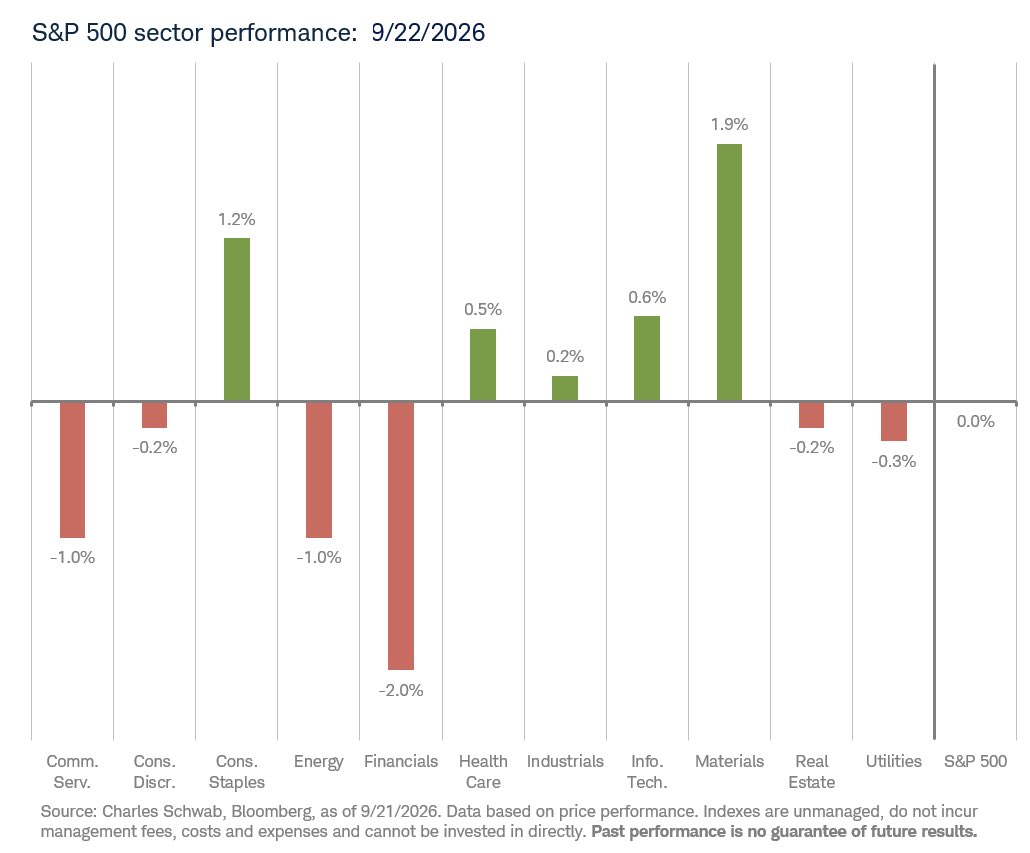
S&P 500 sector daily performance, 2026-09-22 | Materials +1.9% and Consumer Staples +1.2% lead; Financials -2.0% is the weakest, with the index flat
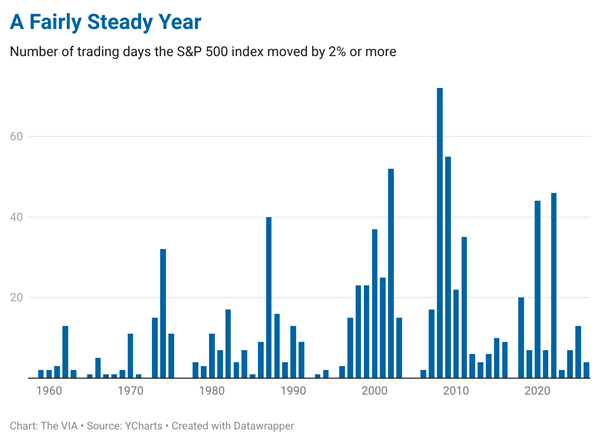
Trading days the S&P 500 moved 2% or more, by year, 1960-2026 | 2008 saw 70+ such days, the most on record; 2026 has very few, marking a low-volatility year
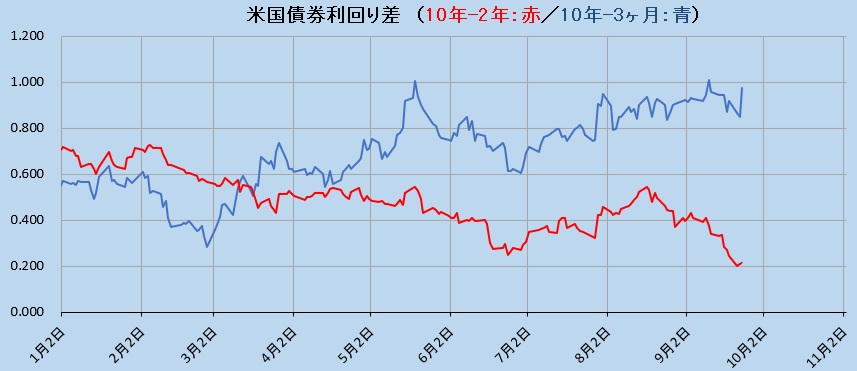
US Treasury yield spreads (pp): 10Y minus 2Y and 10Y minus 3M | 10Y-2Y recently narrowed to ~0.2, 10Y-3M around 0.9
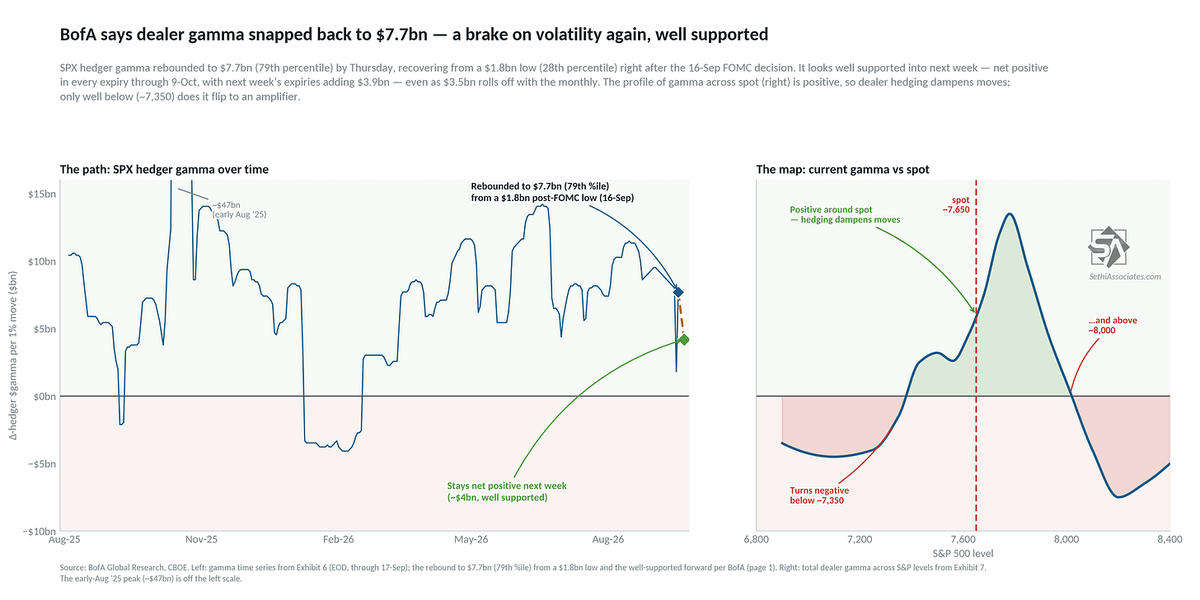
BofA SPX dealer gamma, two panels | Gamma back to $7.7bn (79th pct); flips to a volatility amplifier only below ~7,350
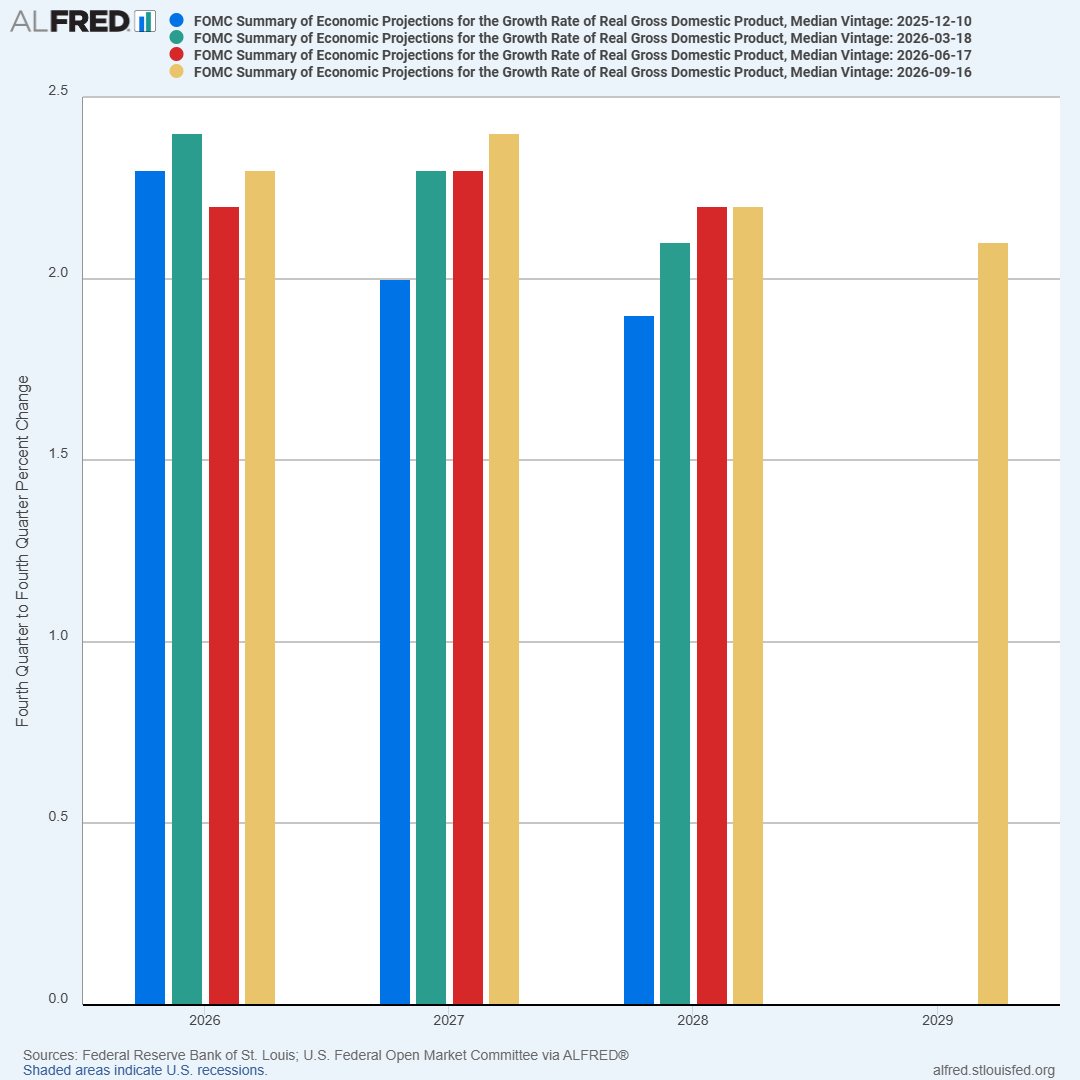
FOMC median real GDP growth projections (Q4/Q4) by vintage | The September vintage sees ~2.3% in 2026 and ~2.4% in 2027, revised up from June
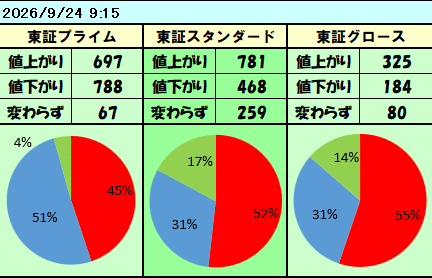
Advancers, decliners and unchanged across TSE Prime, Standard and Growth, Sept 24 9:15 | Prime shows 788 decliners (51%) versus 697 advancers (45%), while Standard and Growth have majority advancers
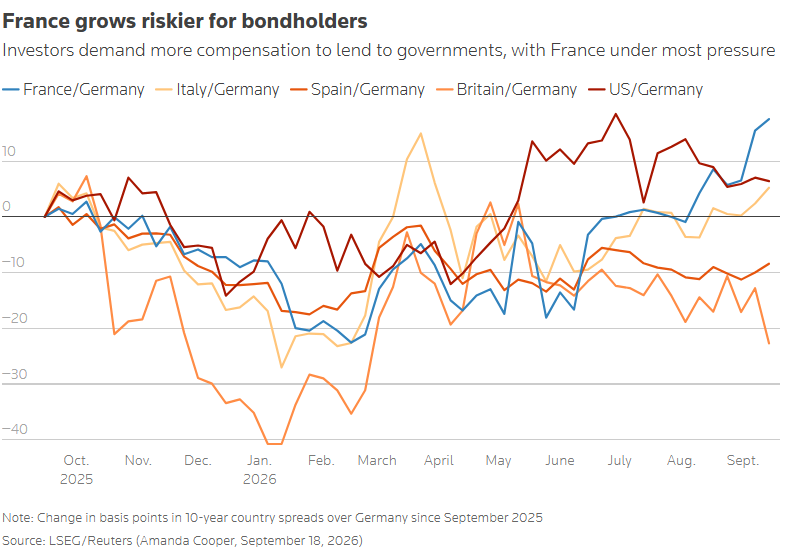
Change in 10Y country spreads over Germany since Sept 2025 (bp) | France's spread has widened the most, about +15bp, leading peers
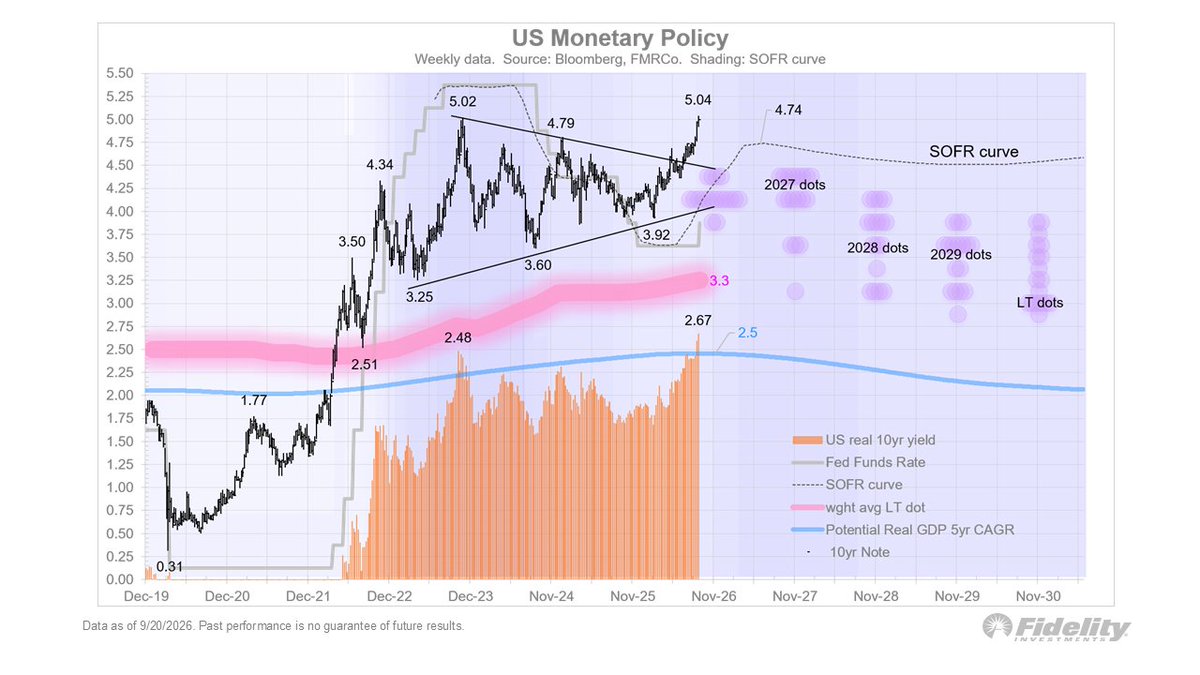
US monetary policy: rates, SOFR curve and real yields | 10-year real yield at 3.3%, now above the potential real growth rate of 2.5%
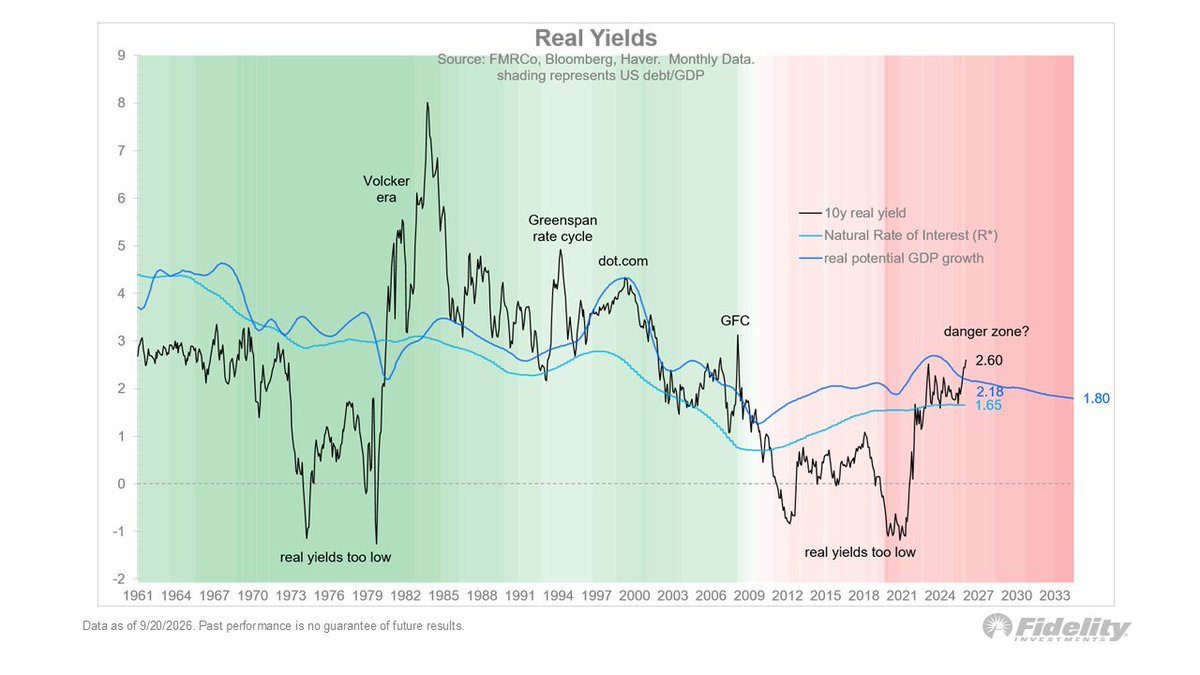
US 10-year real yield, R* and real potential GDP growth, 1961-2033 | Real yield now 2.60%, above ~1.80% potential growth, echoing 2000 and 2007
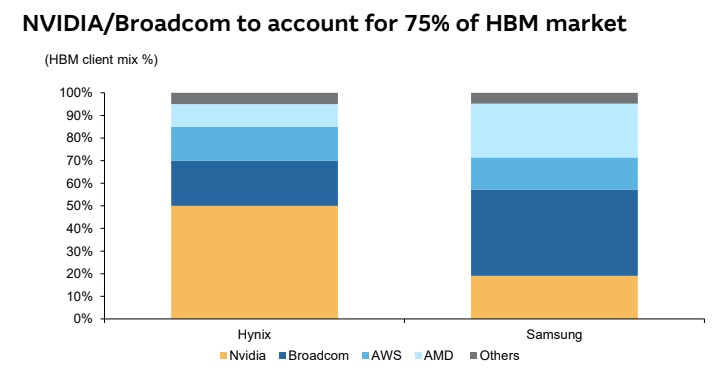
HBM client mix at Hynix and Samsung | Nvidia and Broadcom together account for about 75% of HBM demand
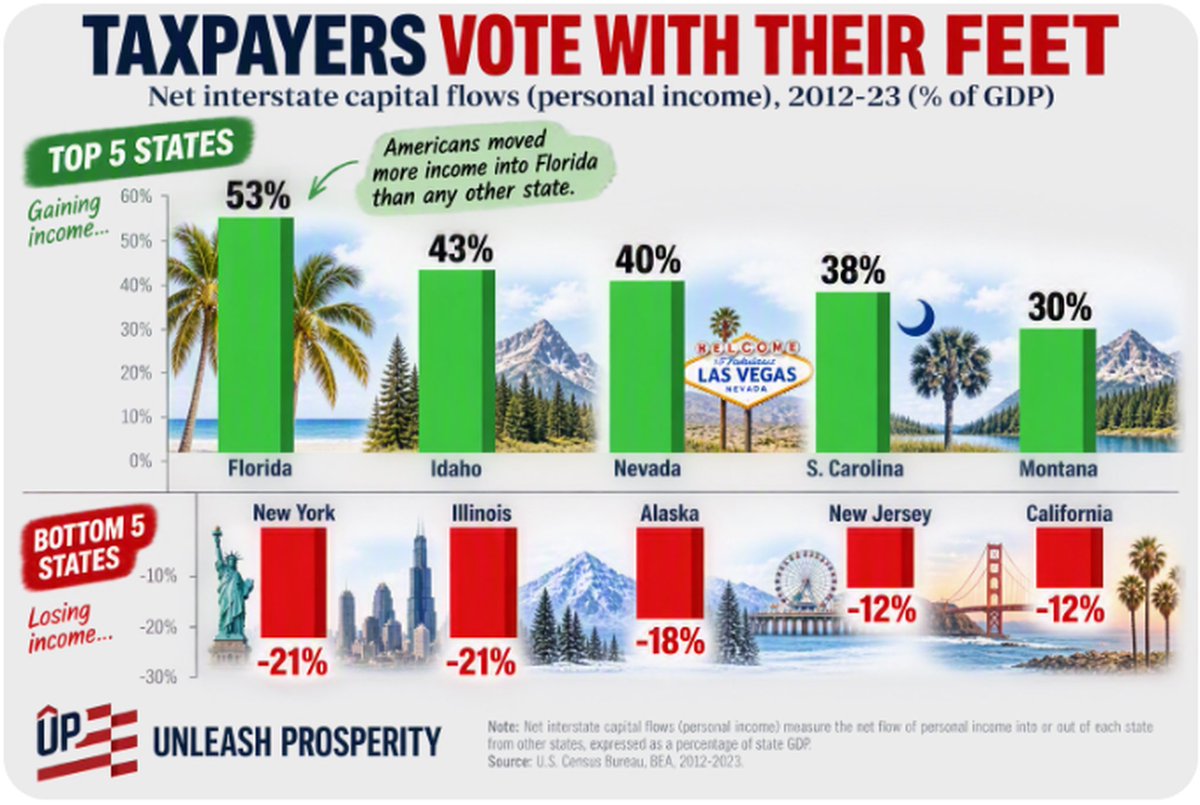
US net interstate personal-income flows as a share of state GDP, 2012-2023 | Florida +53% on top; New York and Illinois each -21% at the bottom
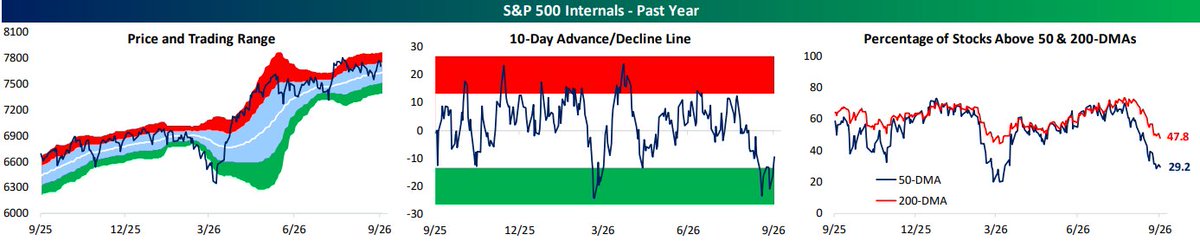
S&P 500 internals over the past year, three panels | 29.2% of stocks above their 50-day average and 47.8% above the 200-day
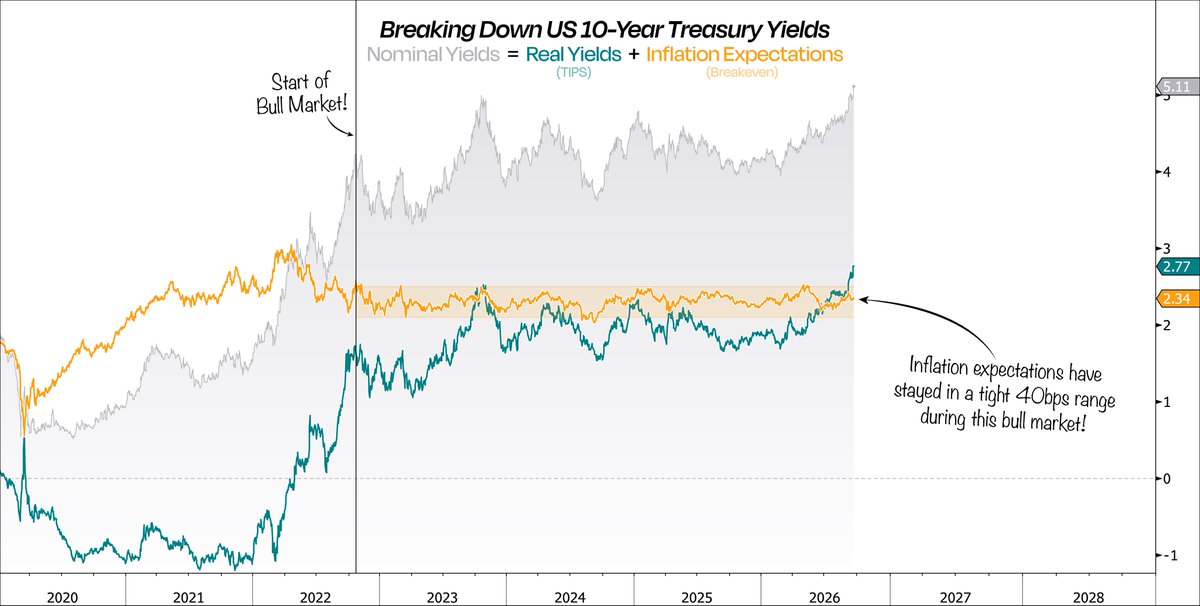
US 10-year nominal yield = real yield (TIPS) + inflation expectations (breakeven), 2020-2026 | Nominal at 5.11%, with breakevens confined to a ~40bp range near 2.34%
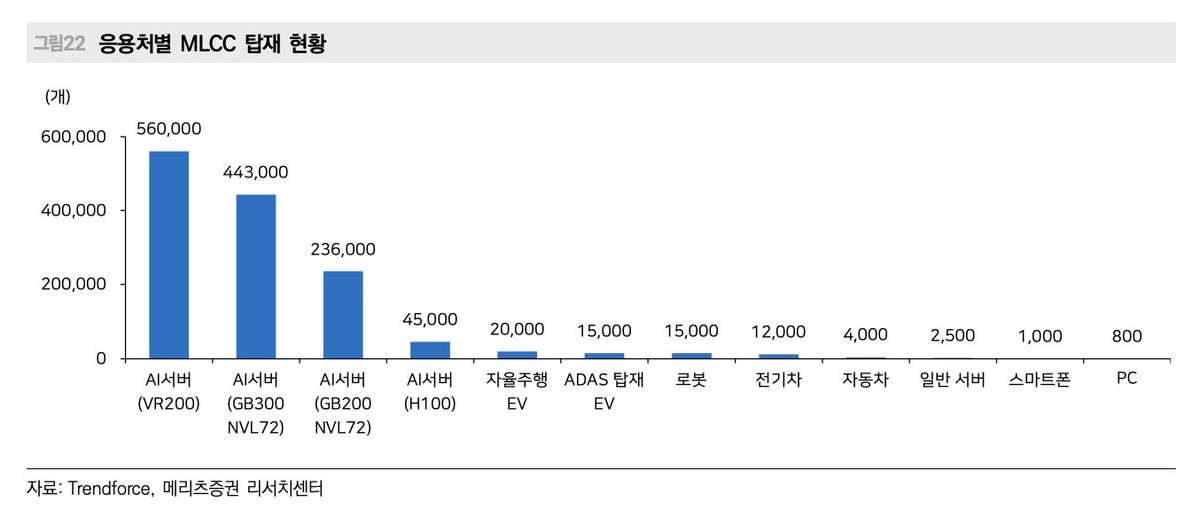
MLCC units by application | VR200 tops at 560,000, about 12x the H100's 45,000
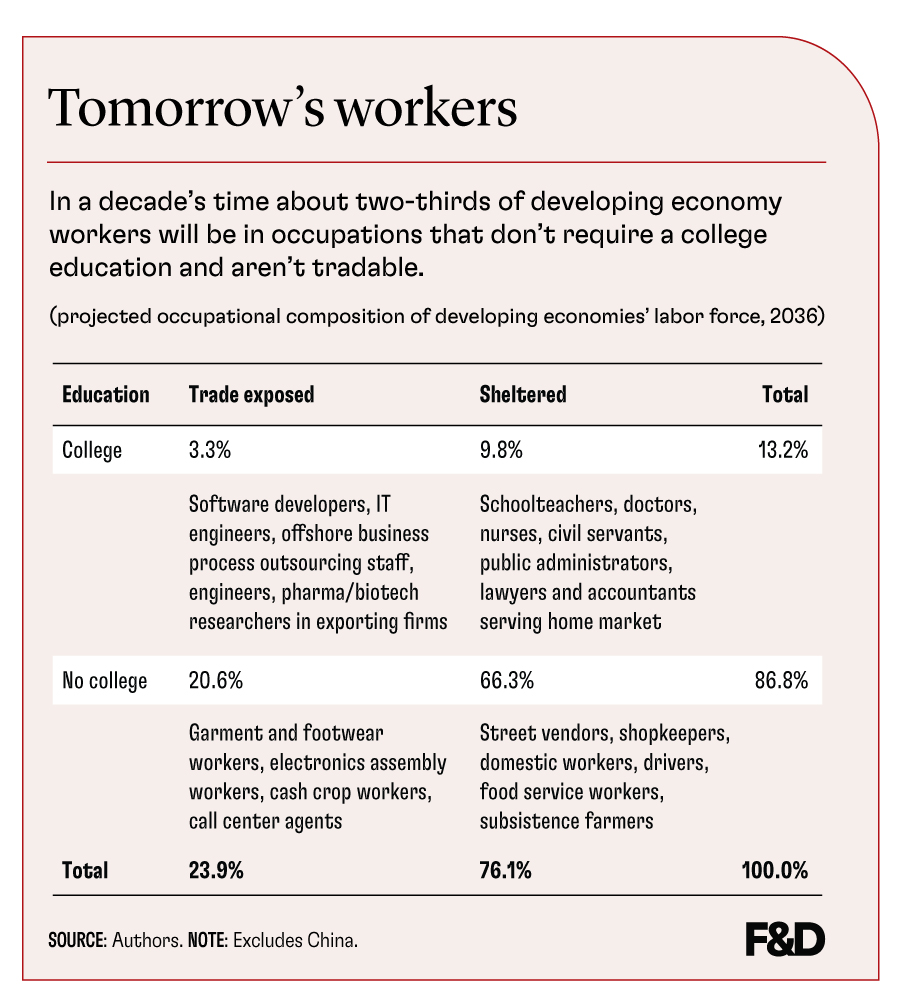
Projected occupational composition of developing economies' labor force, 2036 | 76.1% in sheltered, non-tradable jobs and 86.8% not requiring a college degree
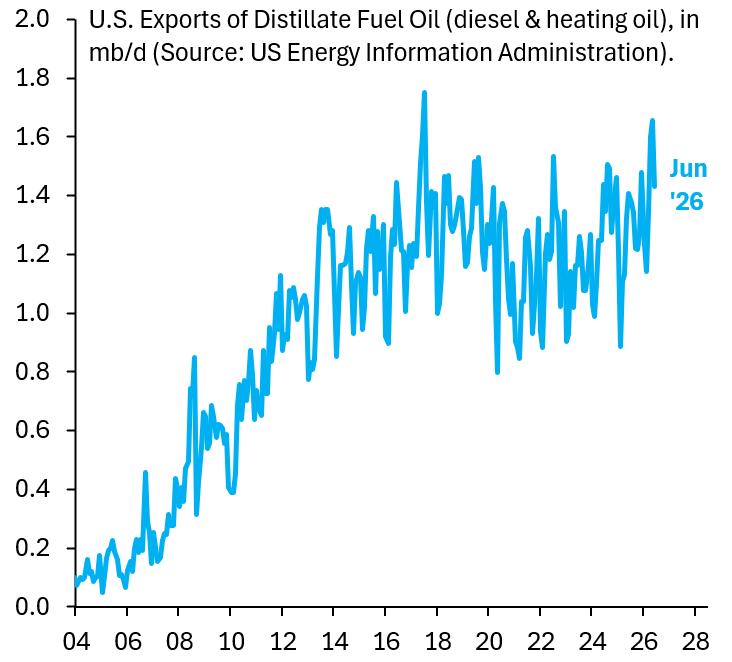
US exports of distillate fuel oil (diesel & heating oil), mb/d | June 2026 near 1.5 mb/d, roughly 5% of global daily demand
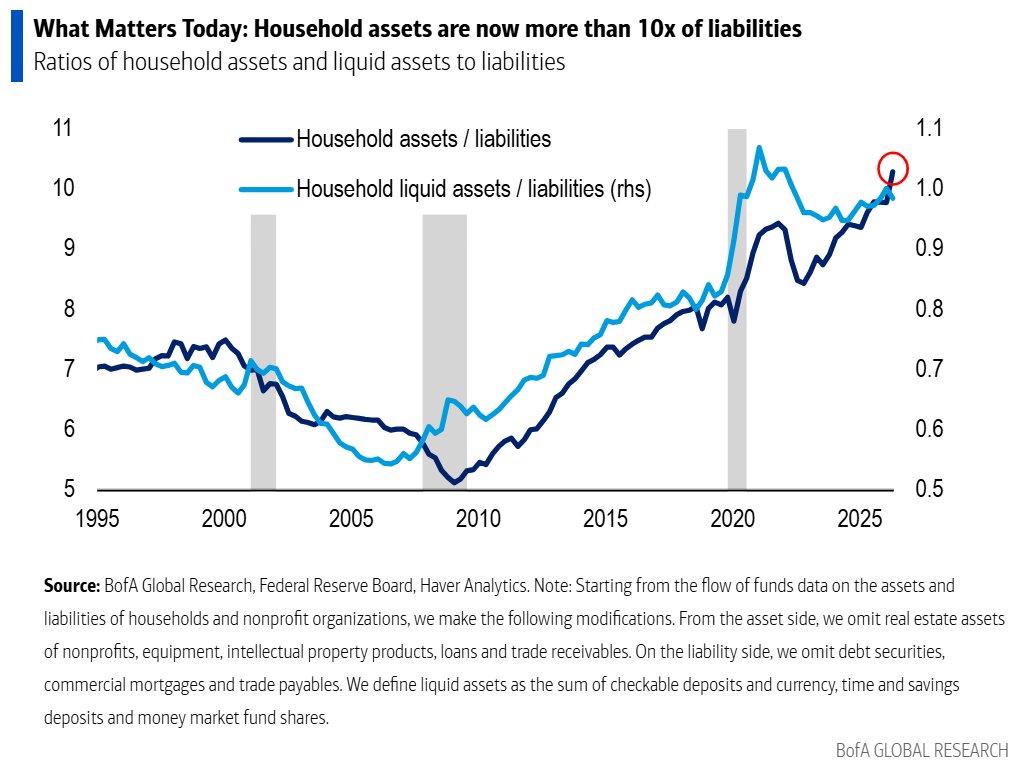
US household assets/liabilities and liquid assets/liabilities, 1995-2026 | Assets now above 10x liabilities, a record, with the liquid ratio near 1.0
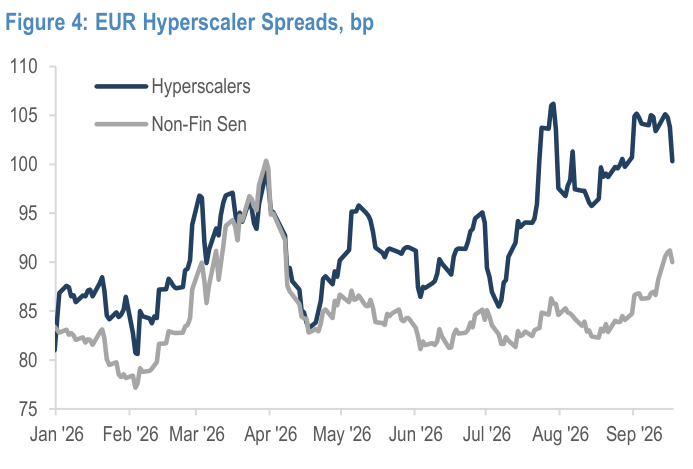
Hyperscaler vs non-financial senior spreads, bp | After spiking near 106bp in August, hyperscaler spreads narrowed to about 100bp
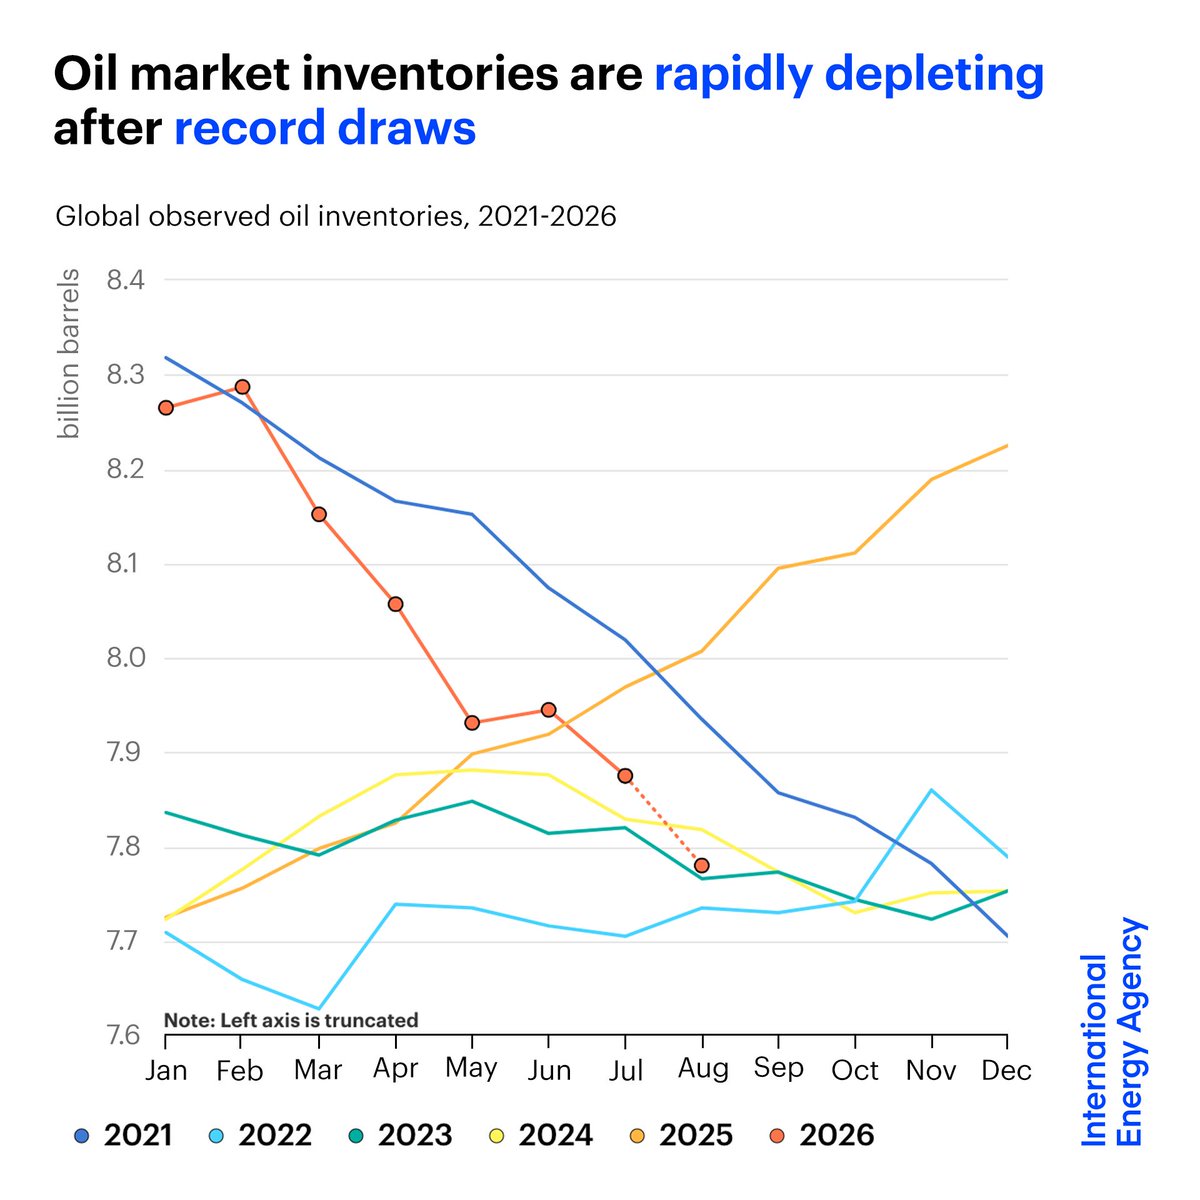
Global observed oil inventories by year, 2021-2026 | 2026 down to about 7.78 billion barrels by August, the lowest for this period in recent years
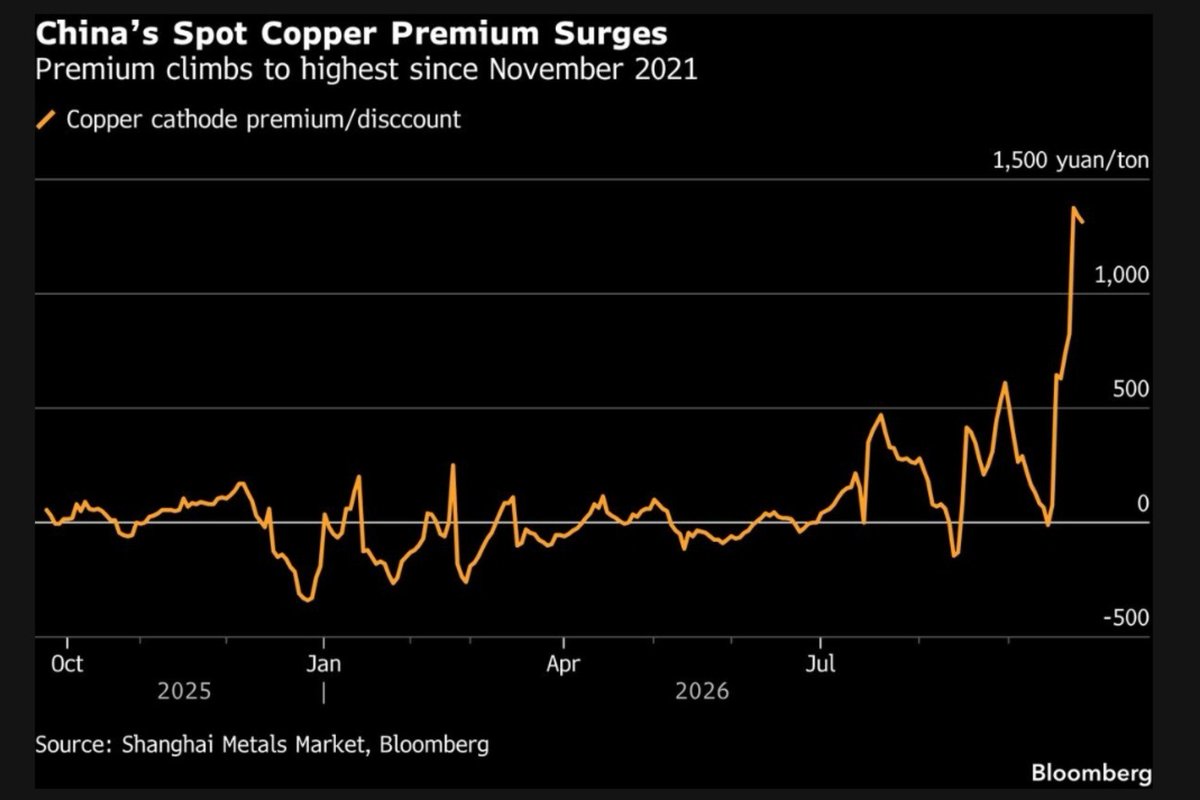
China copper cathode spot premium/discount, yuan/ton | Now about 1,300 yuan/ton, the highest since November 2021
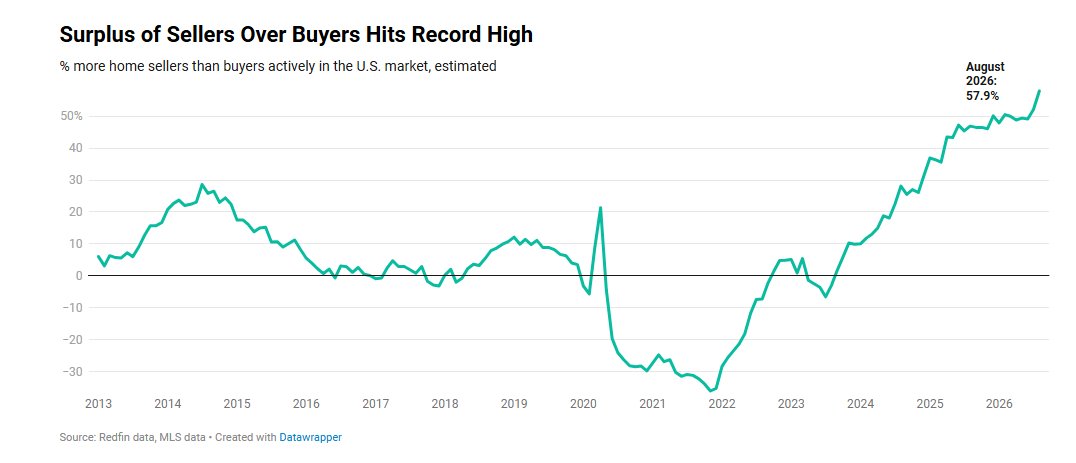
Estimated percent more home sellers than buyers in the US market, 2013-2026 | 57.9% in August 2026, a record high
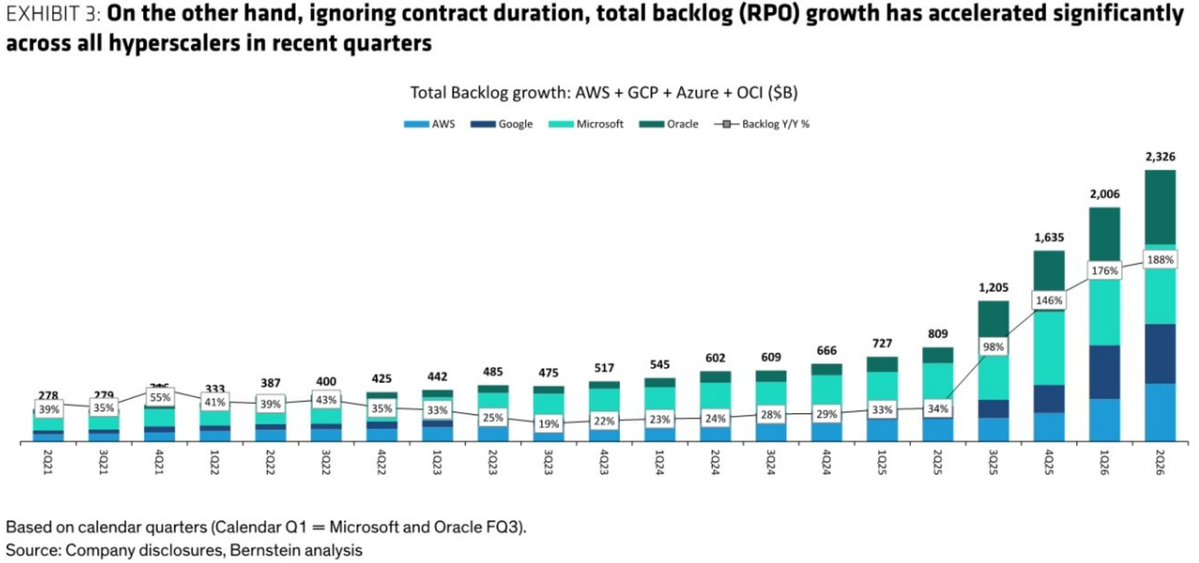
Total backlog growth for AWS, GCP, Azure and OCI ($B) | Latest near $2,326B, up 188% YoY and roughly 8x the 2021 level
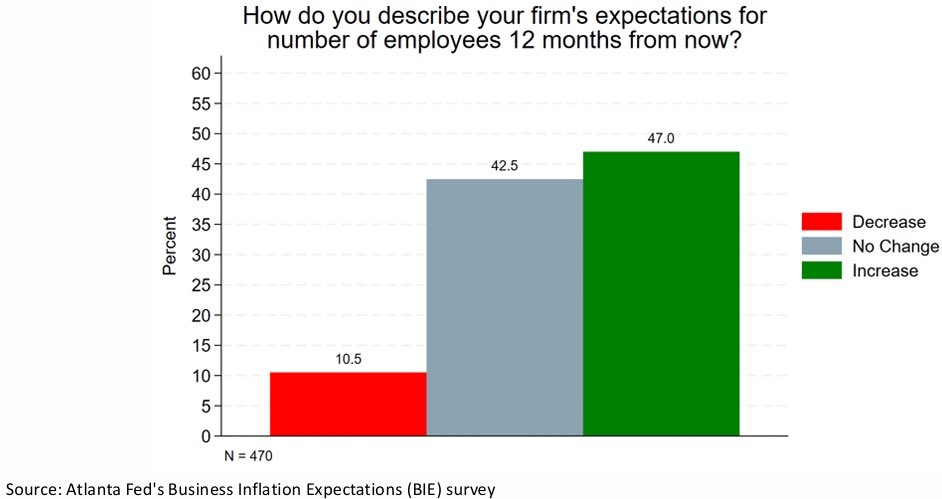
Firms' expectations for employee count 12 months out | 47% increase, 42.5% no change, 10.5% decrease, N=470
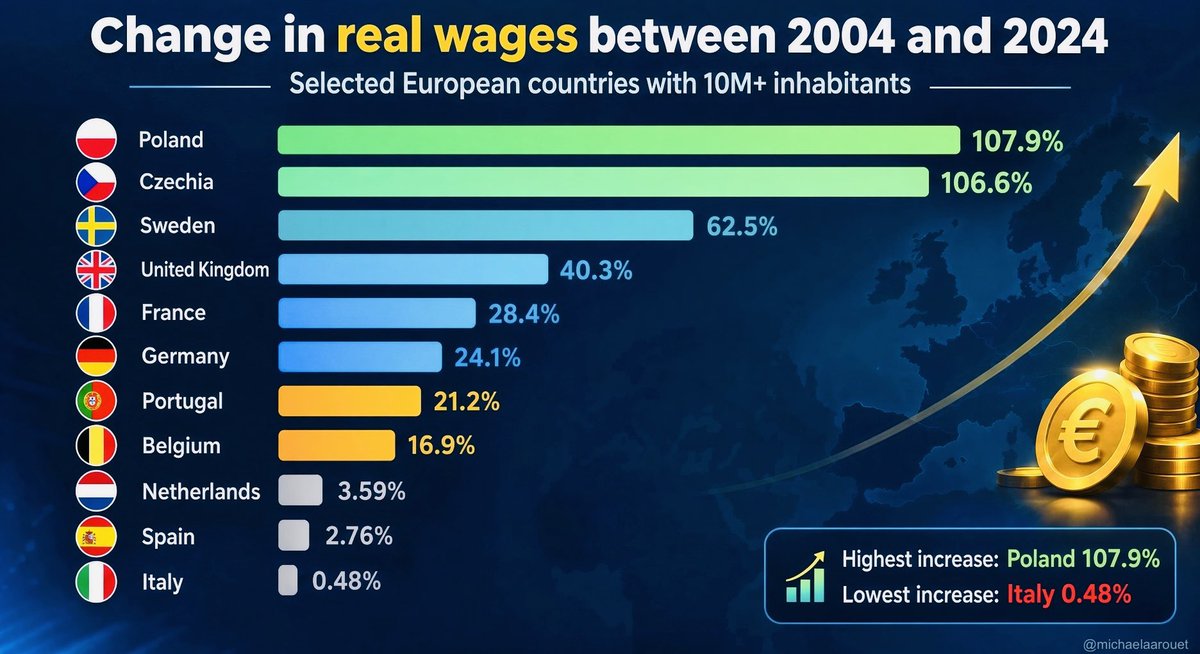
Change in real wages in selected European countries, 2004-2024 | Poland +107.9% and Czechia +106.6% lead; Italy +0.48% at the bottom
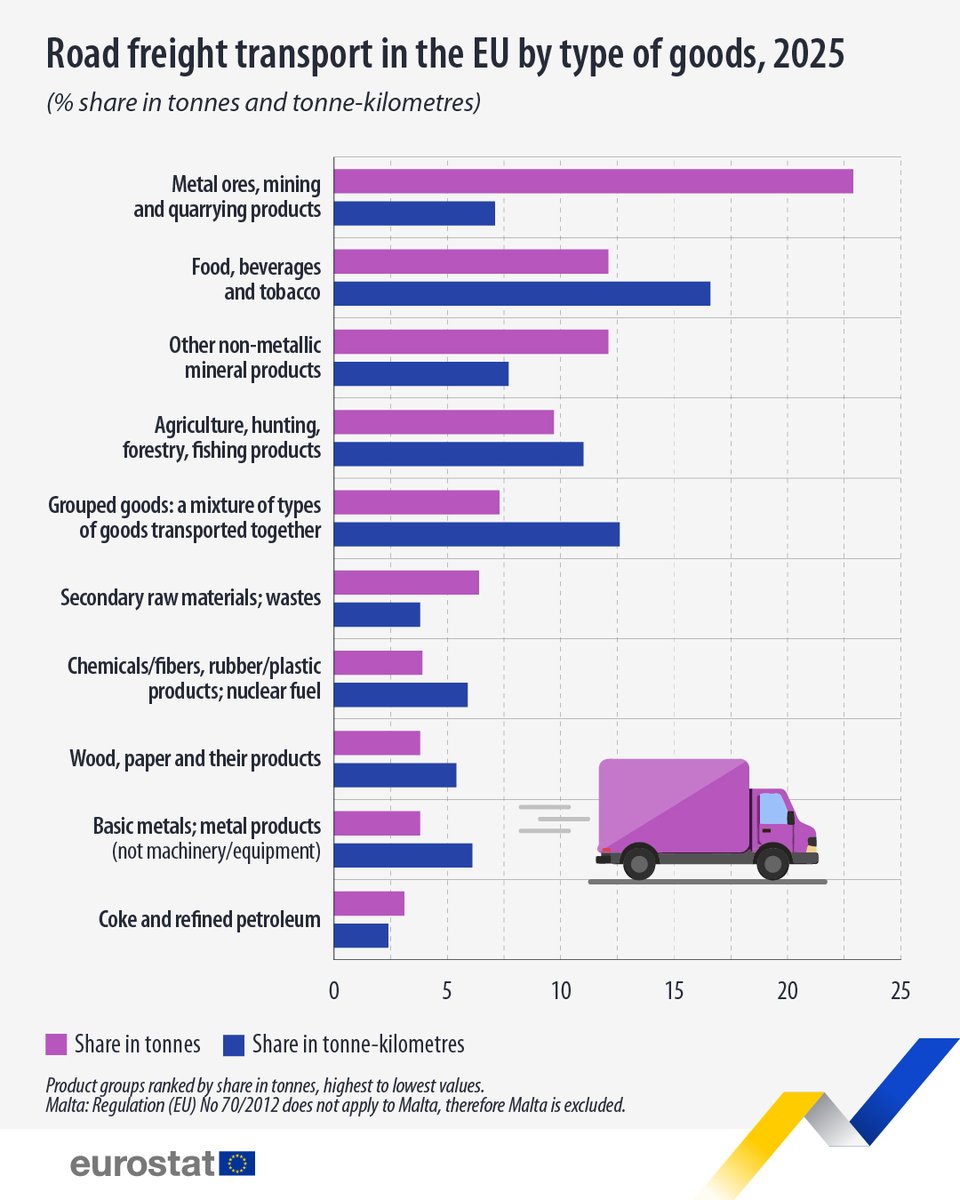
EU road freight by type of goods, 2025, % share | Metal ores, mining and quarrying products top the list at 22.9% of tonnes
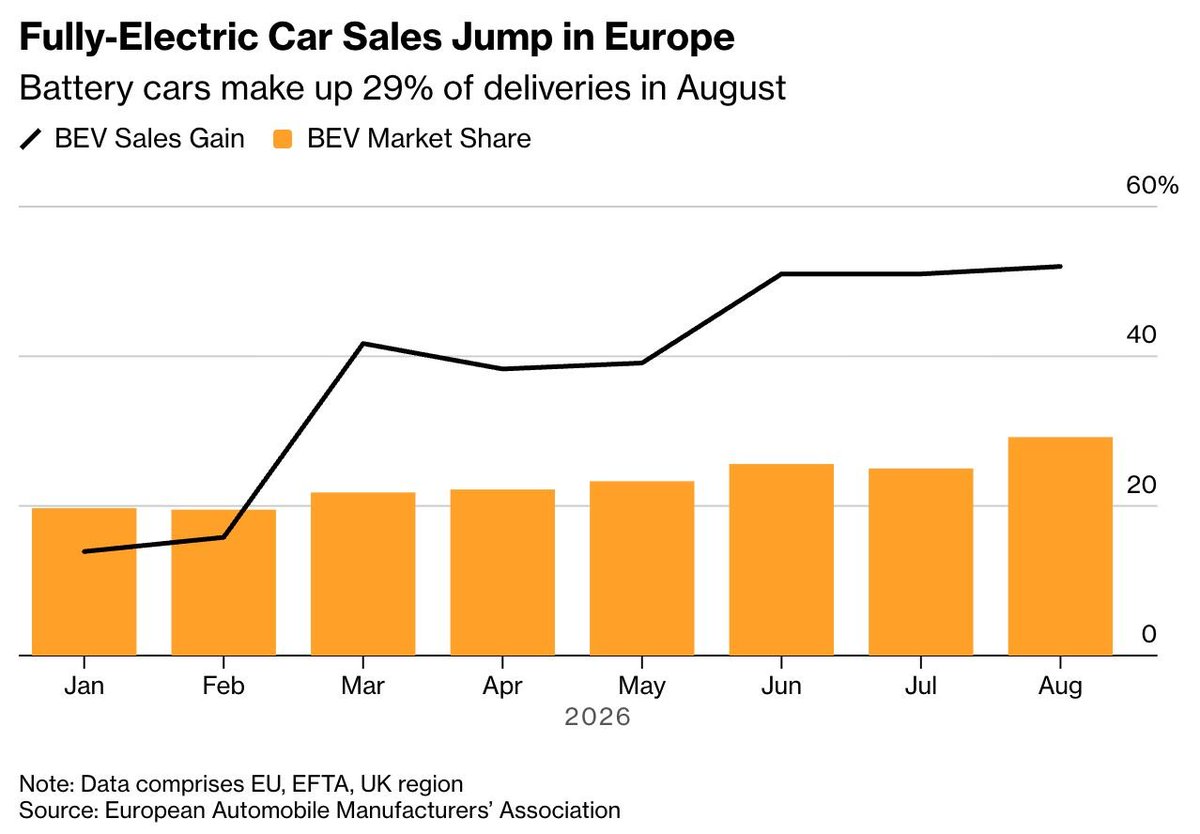
European BEV market share and YoY sales gain, Jan-Aug 2026 | Share at 29% in August with sales up about 50% year-on-year
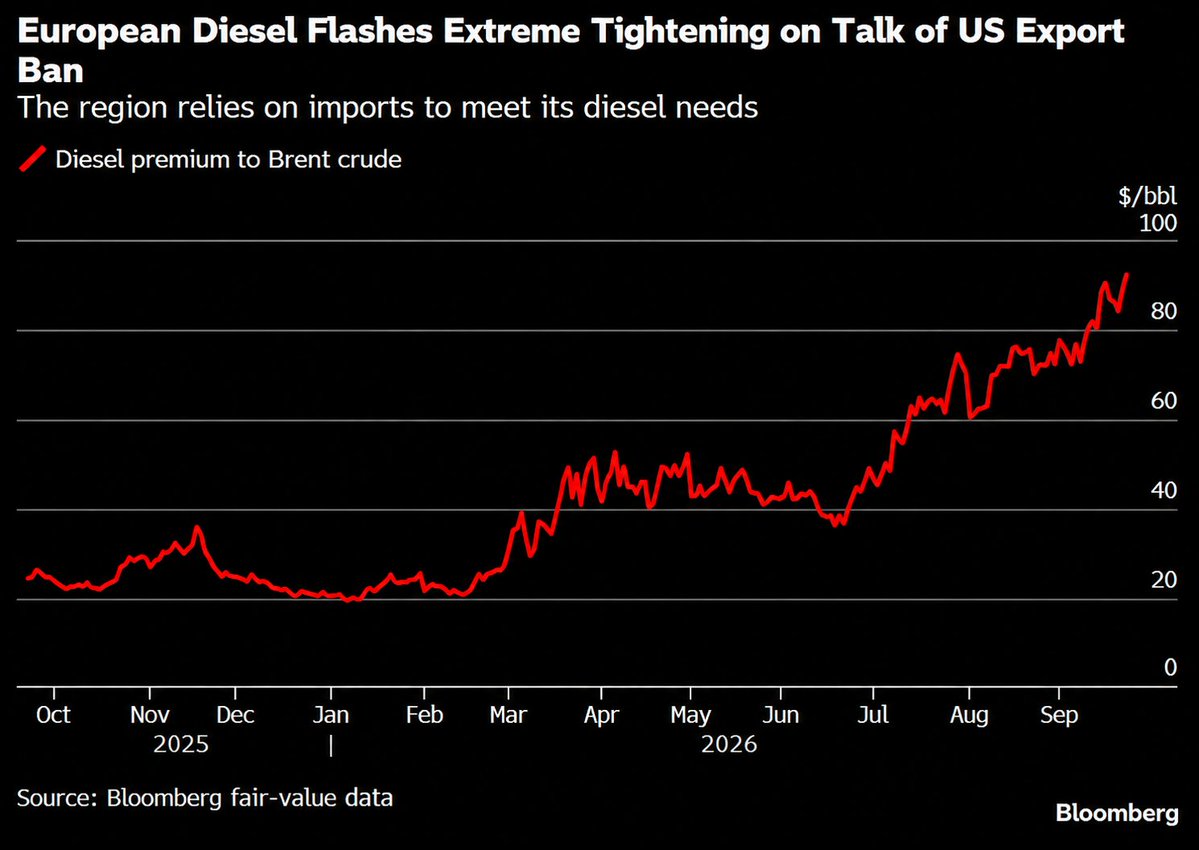
European diesel premium to Brent crude, $/bbl, Oct 2025-Sep 2026 | Up from about $20 early in the year to near $90, signaling extreme tightness
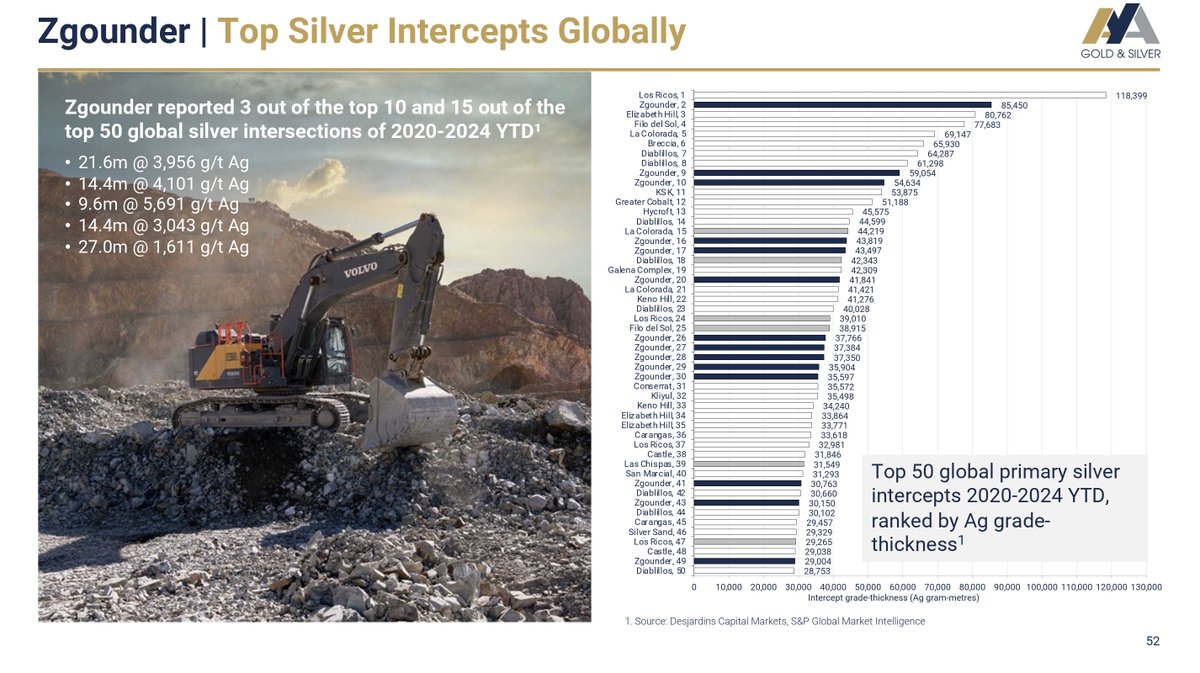
Top 50 global primary silver intercepts, 2020-2024, ranked by Ag grade-thickness | Zgounder ranks second at 85,450 and holds 15 of the top 50
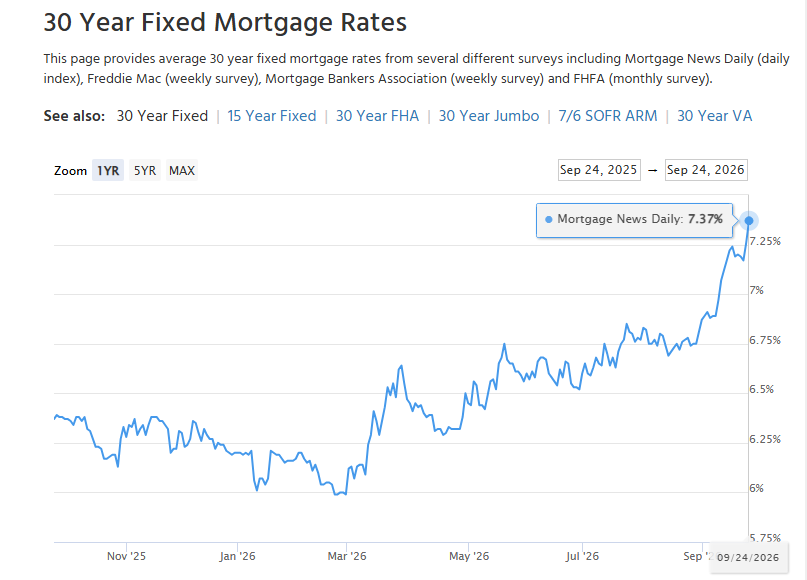
US 30-year fixed mortgage rate, daily, Sep 2025-Sep 2026 | Now 7.37%, up sharply from about 6% in March
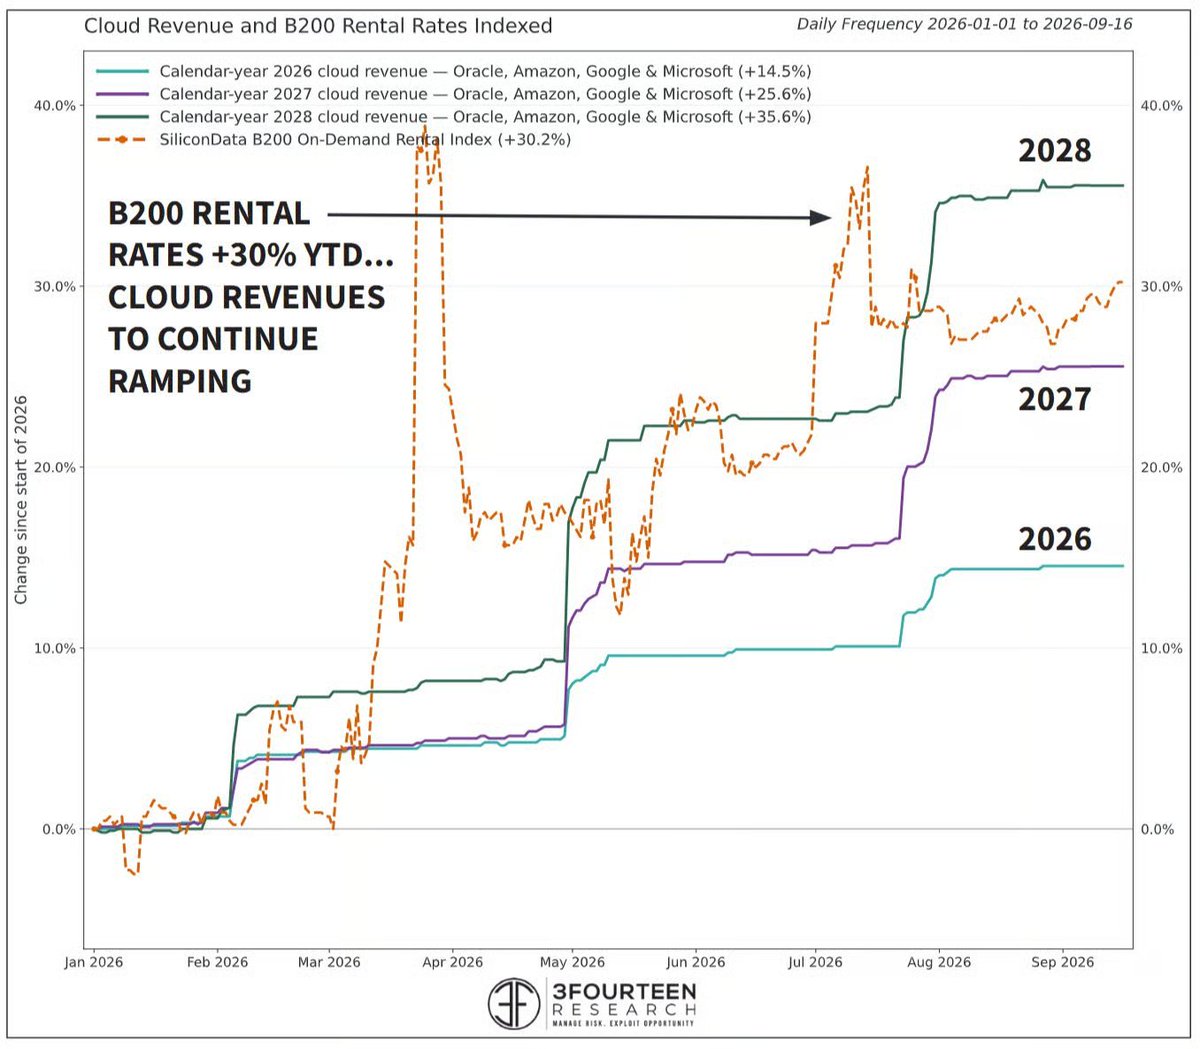
Cloud revenue and B200 rental rates indexed to start of 2026 | B200 on-demand rentals +30.2% while 2028 cloud revenue tracks +35.6%
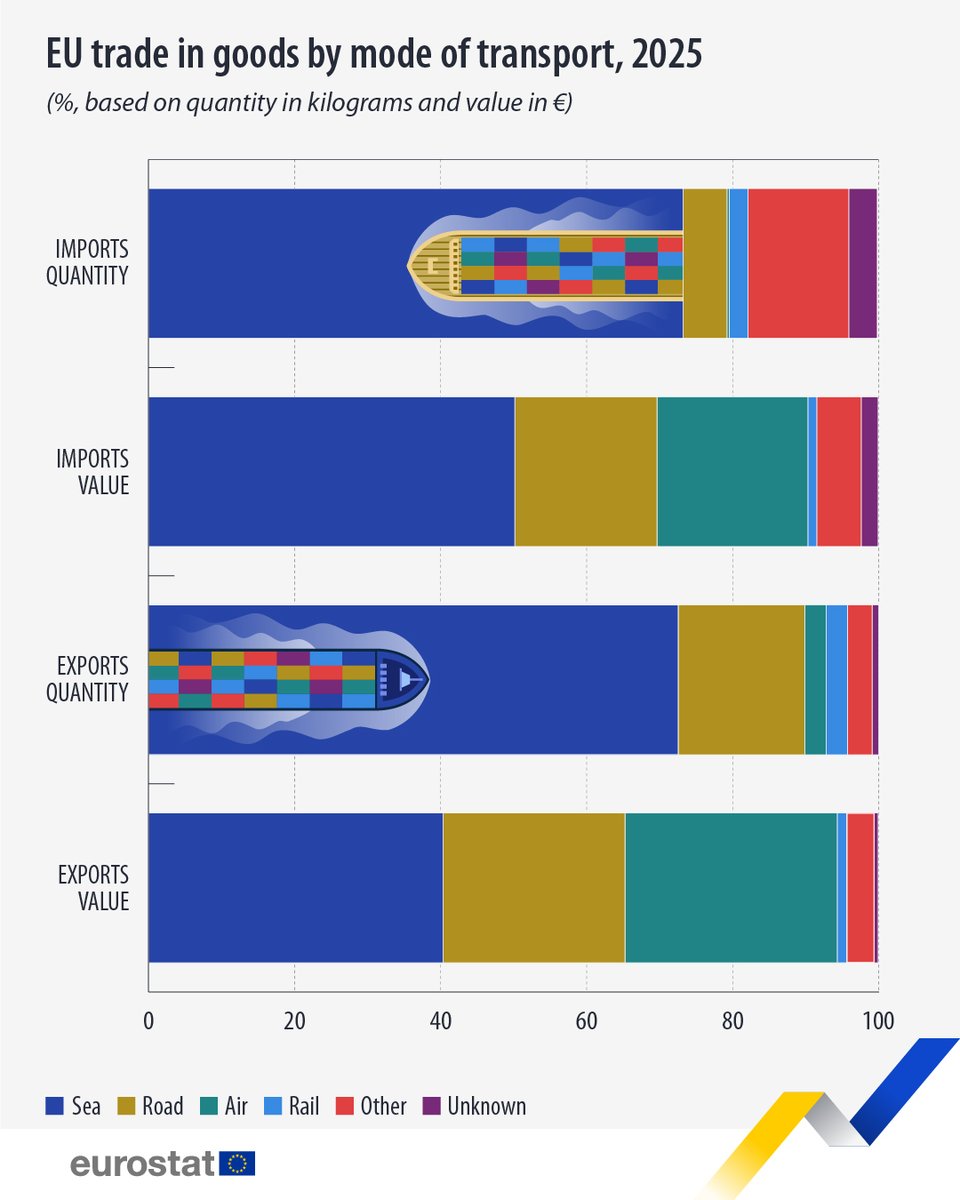
EU trade in goods by mode of transport, 2025 | Sea accounts for 73.3% of import weight but only 50.2% of import value
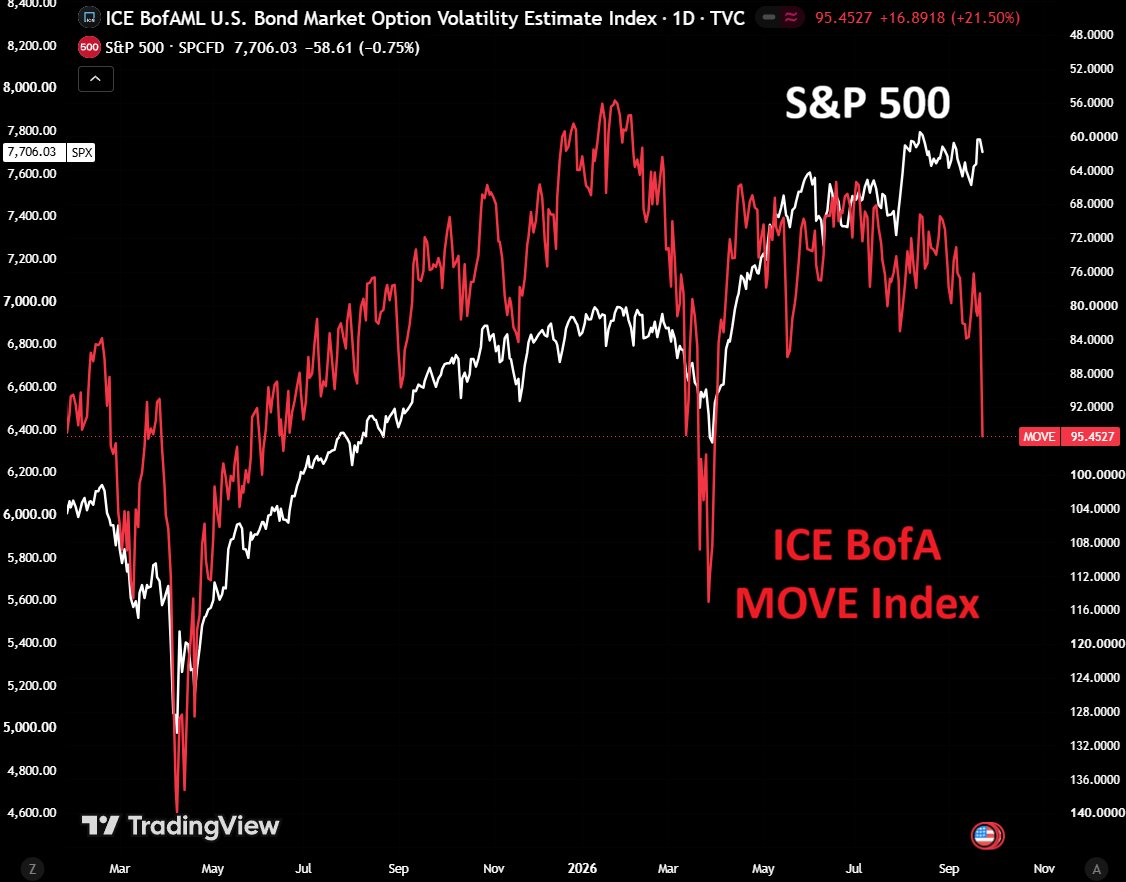
ICE BofA MOVE bond-volatility index versus the S&P 500 | MOVE up 21% Wednesday to 95.5, the highest since March, diverging from equities
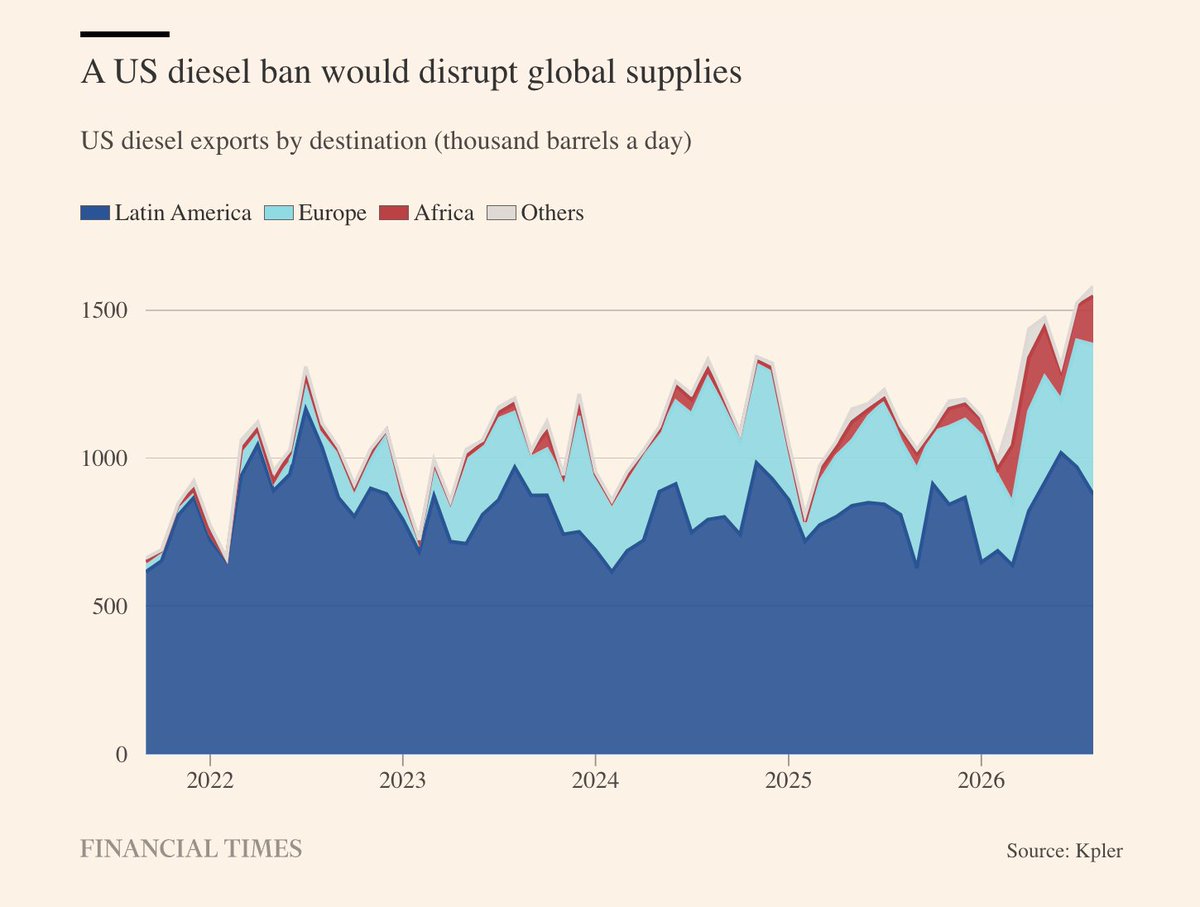
US diesel exports by destination, thousand barrels a day, 2022-2026 | Total above 1,500kbd in 2026, ~1,000 to Latin America with Europe next
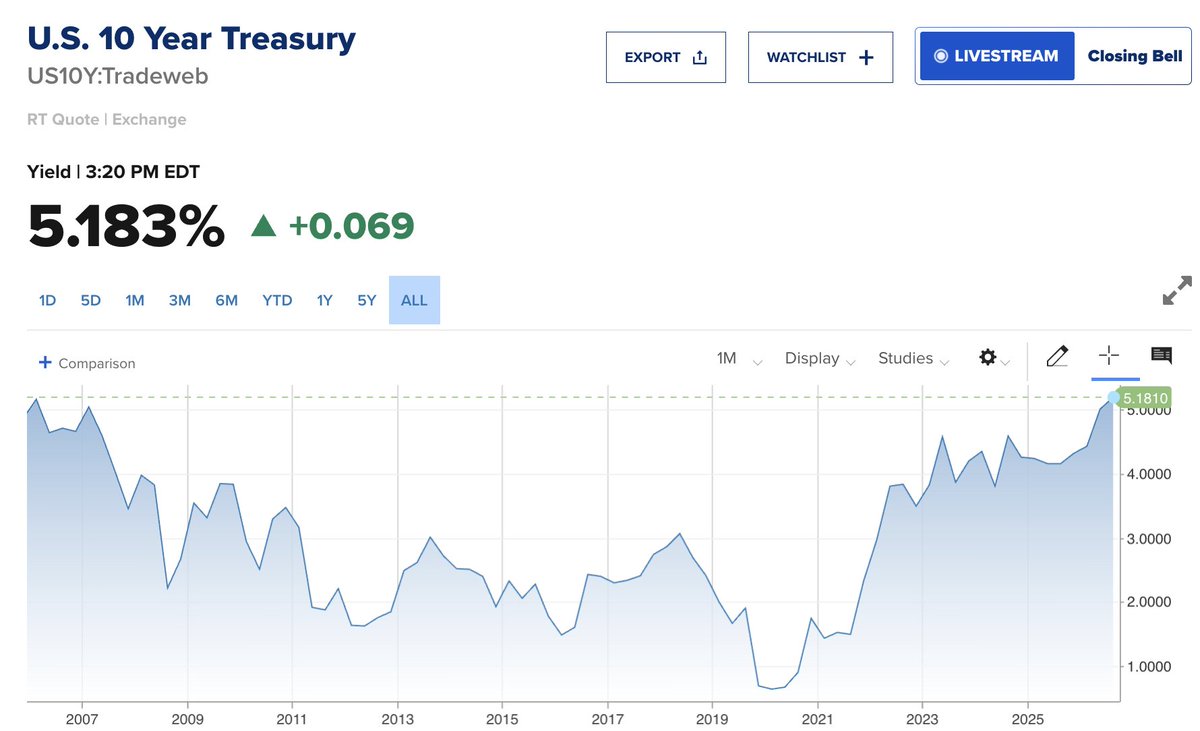
US 10-year Treasury yield, 2007-2026 | Now 5.183%, up 0.069 on the day, back to pre-2008-crisis levels
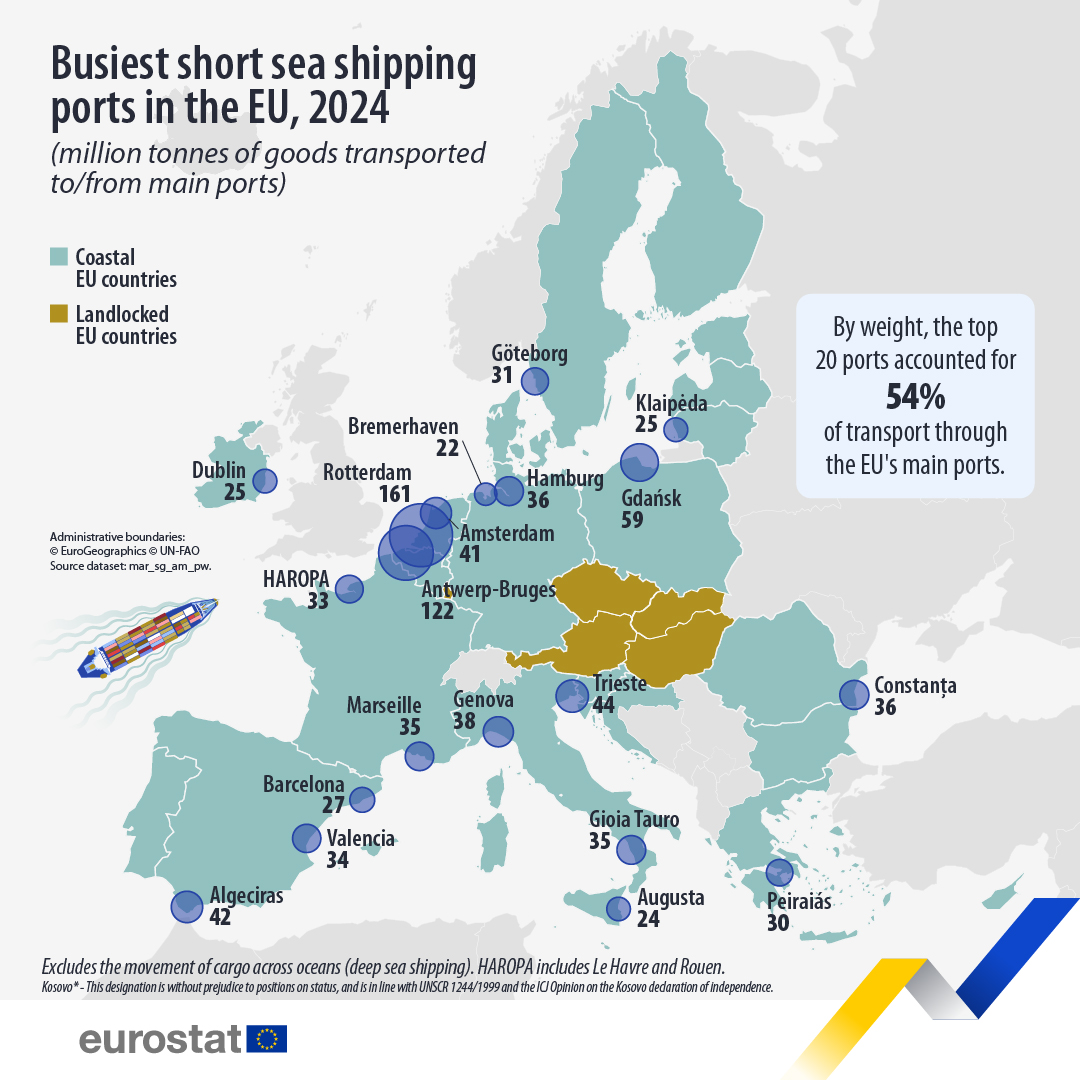
Goods handled at the EU's main short-sea shipping ports, 2024, million tonnes | Rotterdam 161 and Antwerp-Bruges 122 lead; the top 20 ports are 54% of the total
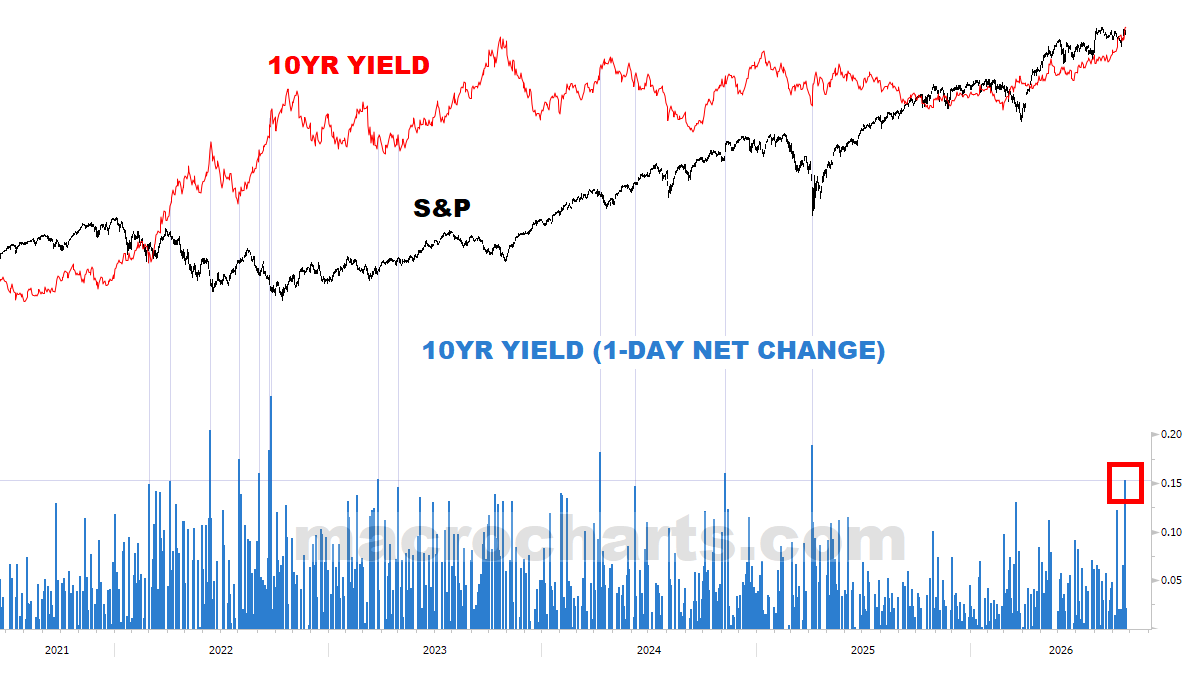
10-year yield and S&P plus the yield's one-day net change, 2021-2026 | Latest daily move near 0.15 as macro reasserts itself over equities
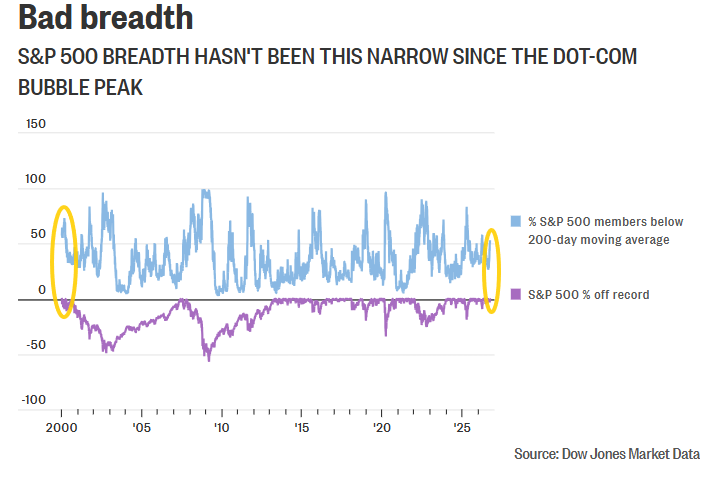
Share of S&P 500 members below their 200-day average vs distance from the record, 2000-2026 | About 52% below the 200-DMA with the index ~1% from a record, echoing 2000
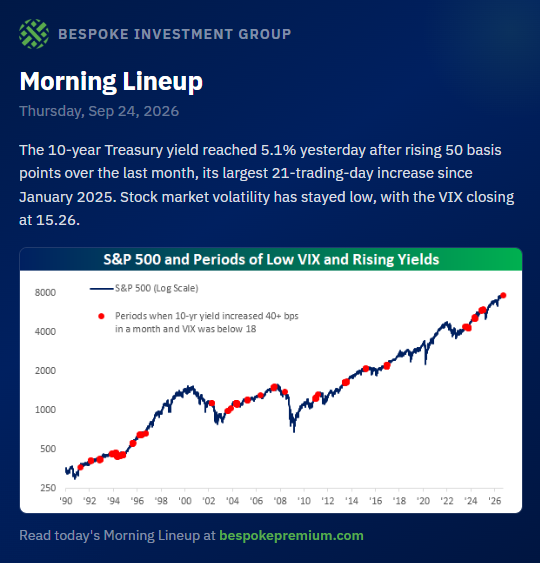
S&P 500 (log) marking low-VIX, rising-yield episodes | Red dots flag months when the 10-year rose 40+ bps with the VIX below 18
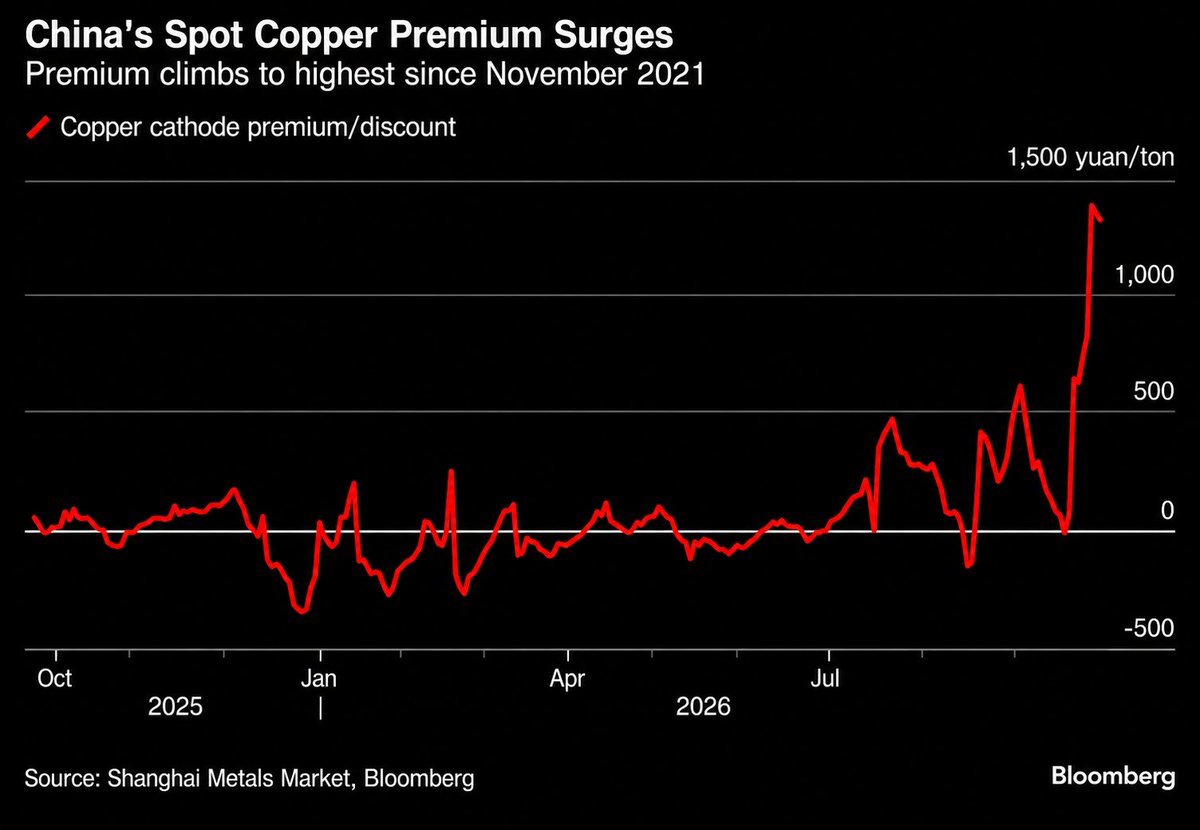
China copper cathode premium/discount, yuan/ton | Latest near 1,375 yuan, the highest since November 2021
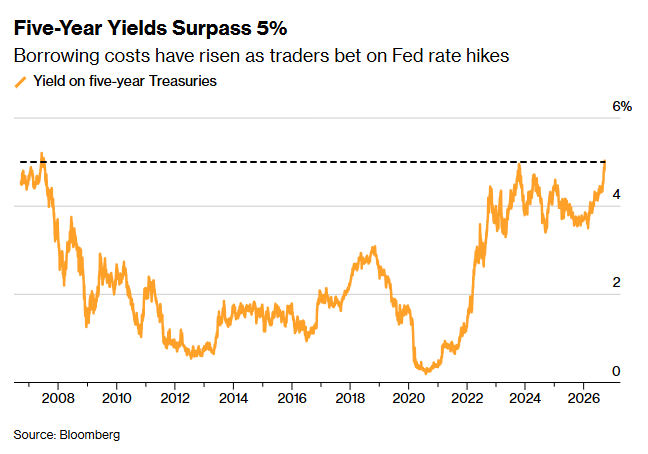
Yield on five-year US Treasuries | Now above 5%, back at levels last seen around 2007 as borrowing costs climb
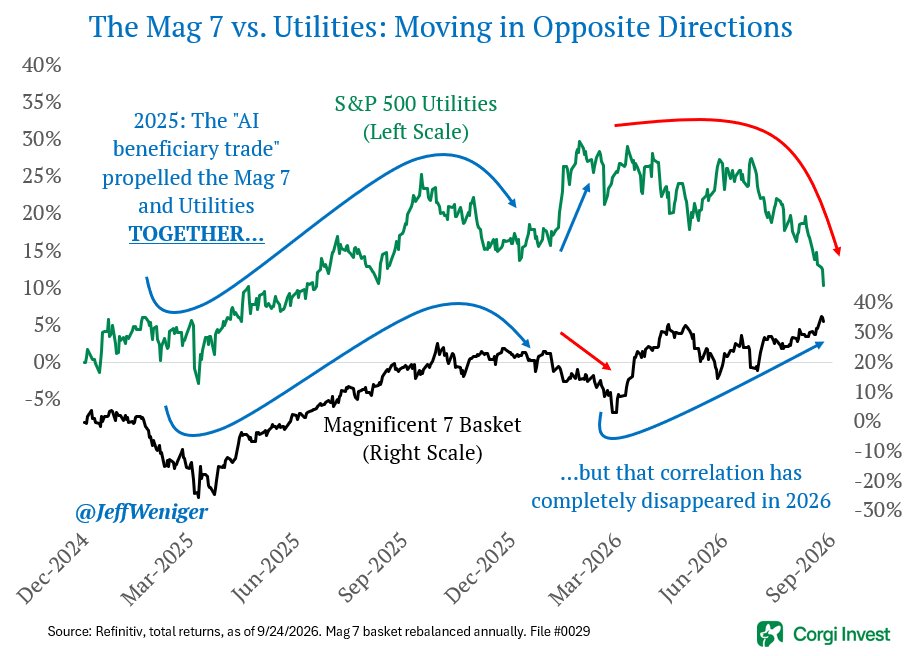
S&P 500 Utilities vs the Magnificent 7 basket, total returns, Dec 2024-Sep 2026 | They rose together in 2025, then decoupled in 2026
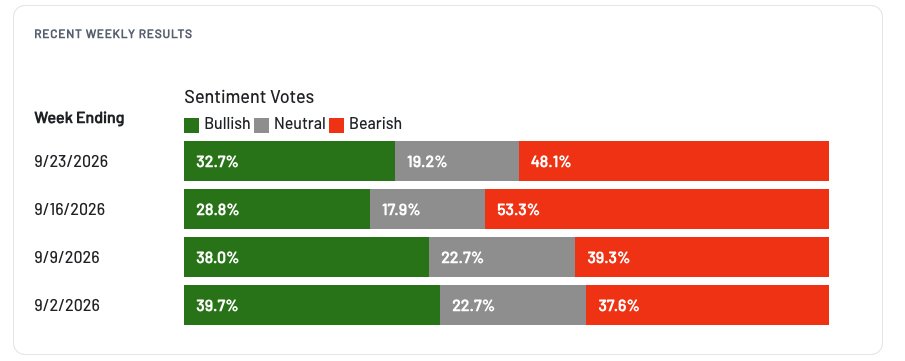
AAII weekly investor sentiment, bullish/neutral/bearish, last four weeks | Bearish 48.1% vs bullish 32.7% for the week ending Sept 23
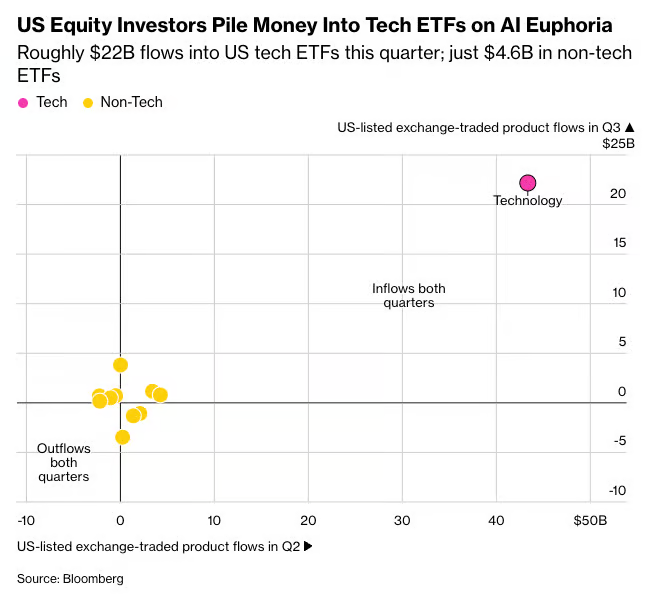
US ETP flows, Q2 versus Q3 | Technology at about $22bn this quarter versus $4.6bn for non-tech
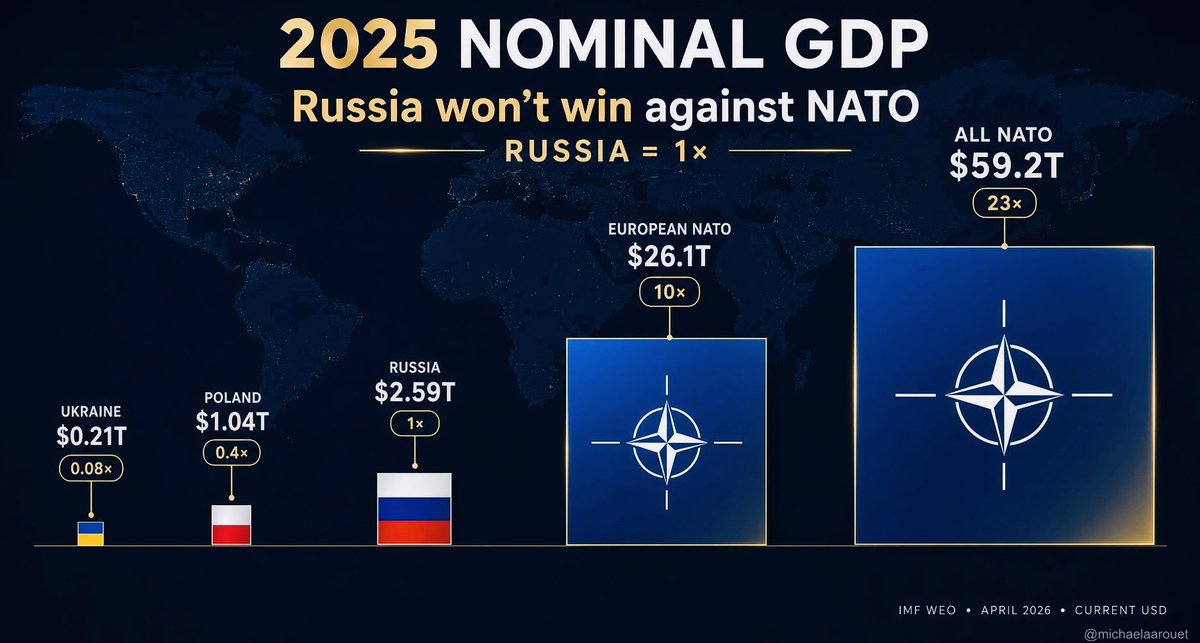
2025 nominal GDP comparison, USD | All NATO $59.2T and European NATO $26.1T versus Russia's $2.59T
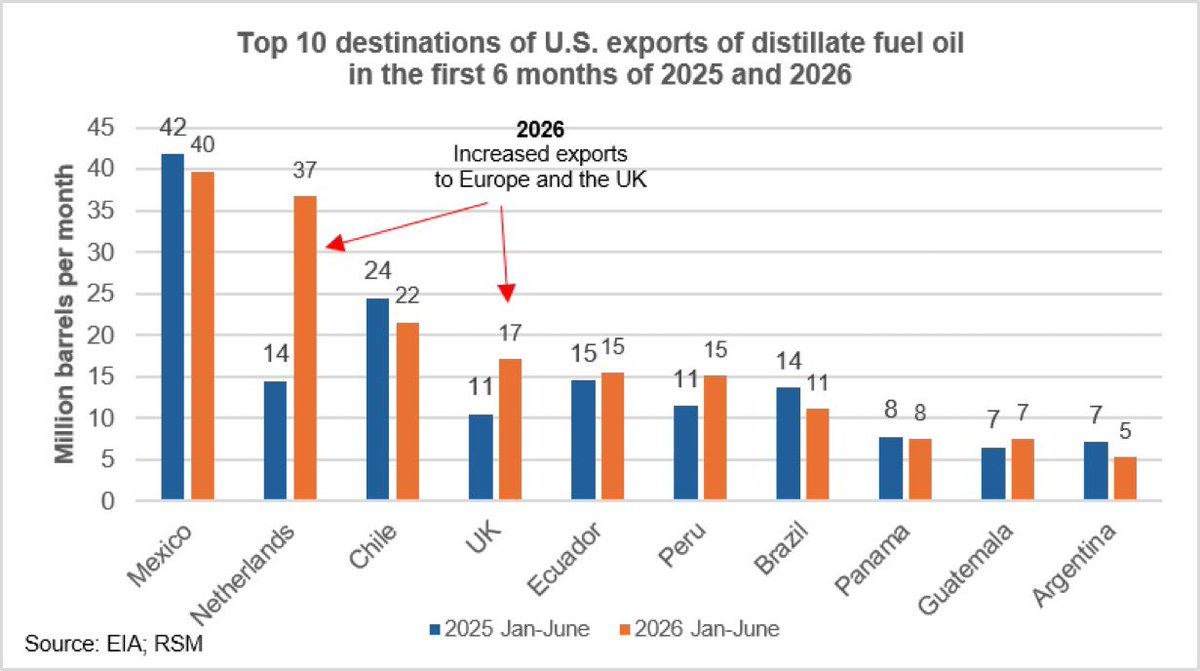
Top 10 destinations of US distillate fuel-oil exports, H1 2025 vs 2026, million barrels/month | Netherlands surged from 14M to 37M; Mexico leads near 40M
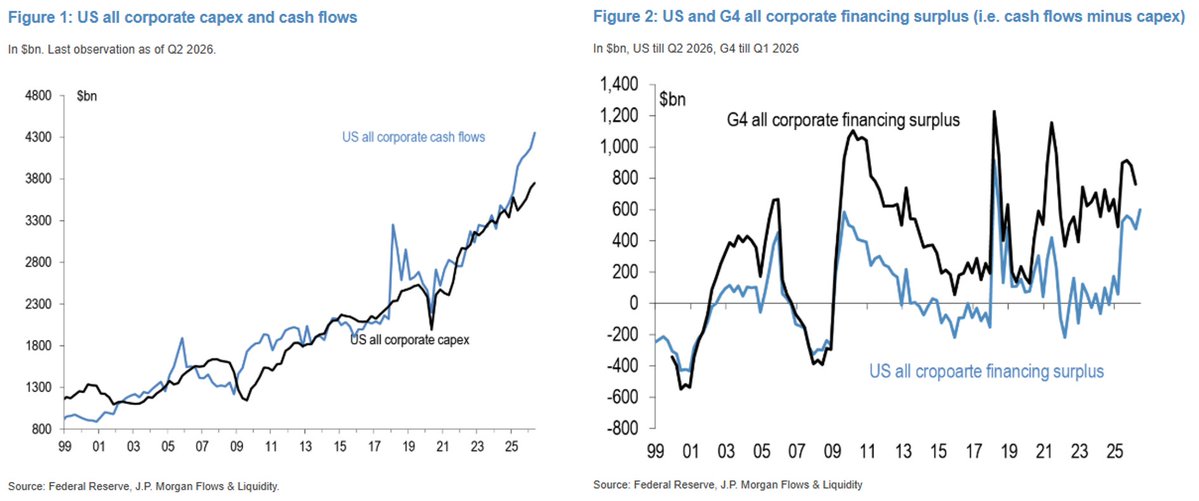
US corporate capex, cash flows and financing surplus, two panels | Cash flows now exceed capex, lifting the financing surplus toward non-crisis record highs
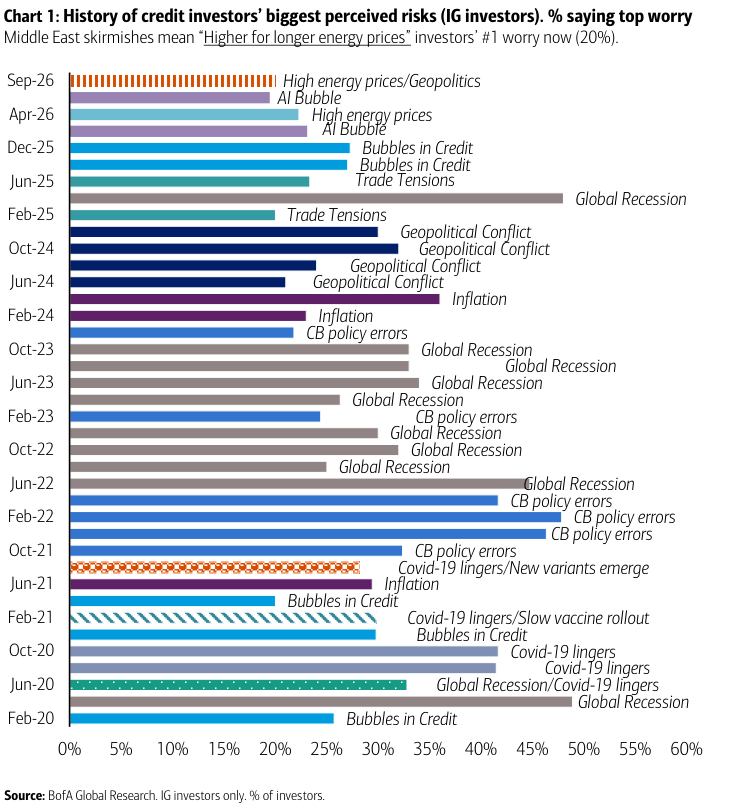
History of IG credit investors' biggest perceived risk | High energy prices/geopolitics is the top worry in September 2026 at 20%
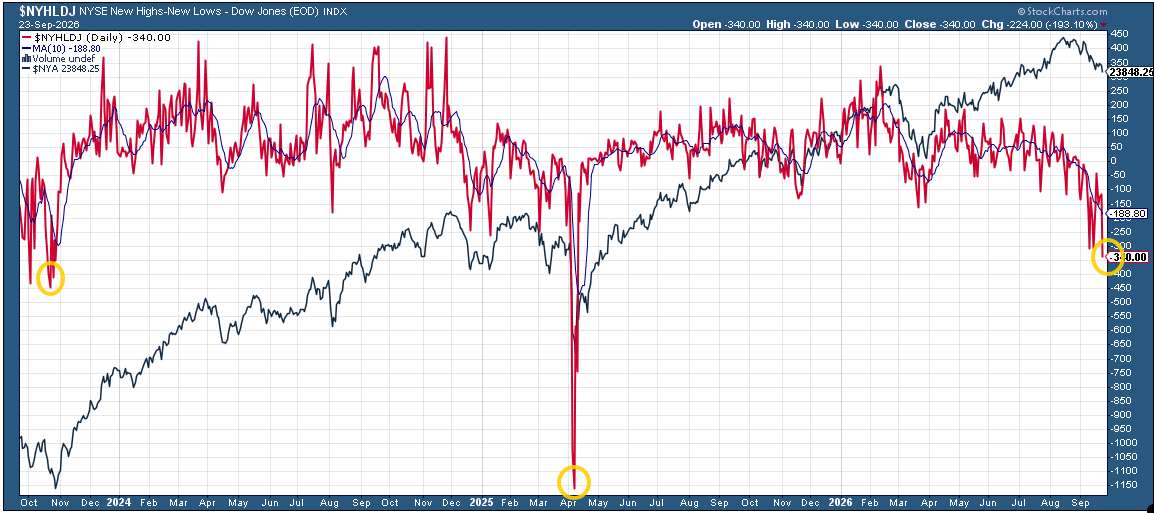
NYSE 52-week new highs minus new lows versus the Dow | -340 on Wednesday, the lowest since October 2023 apart from April this year
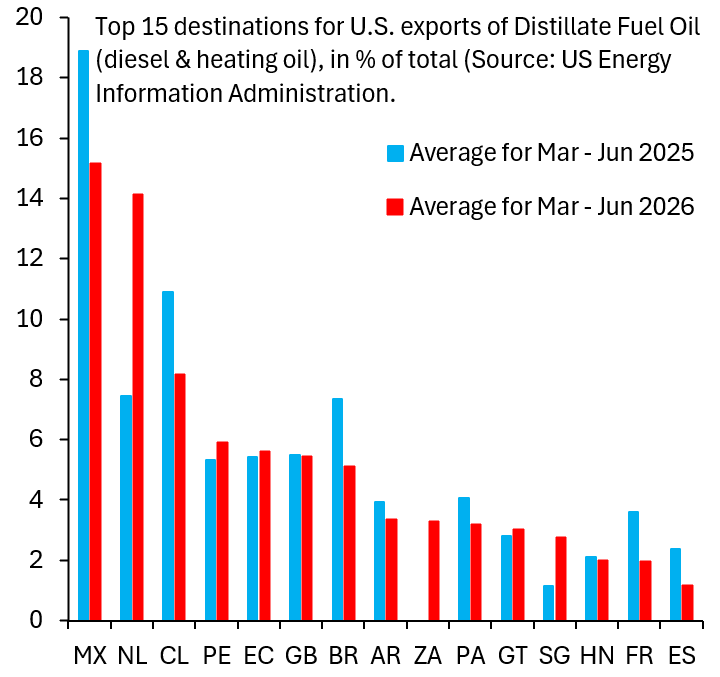
Top 15 destinations for US distillate fuel-oil exports, share of total, Mar-Jun 2025 vs 2026 | Mexico still leads near 15%; the Netherlands doubled to about 14%
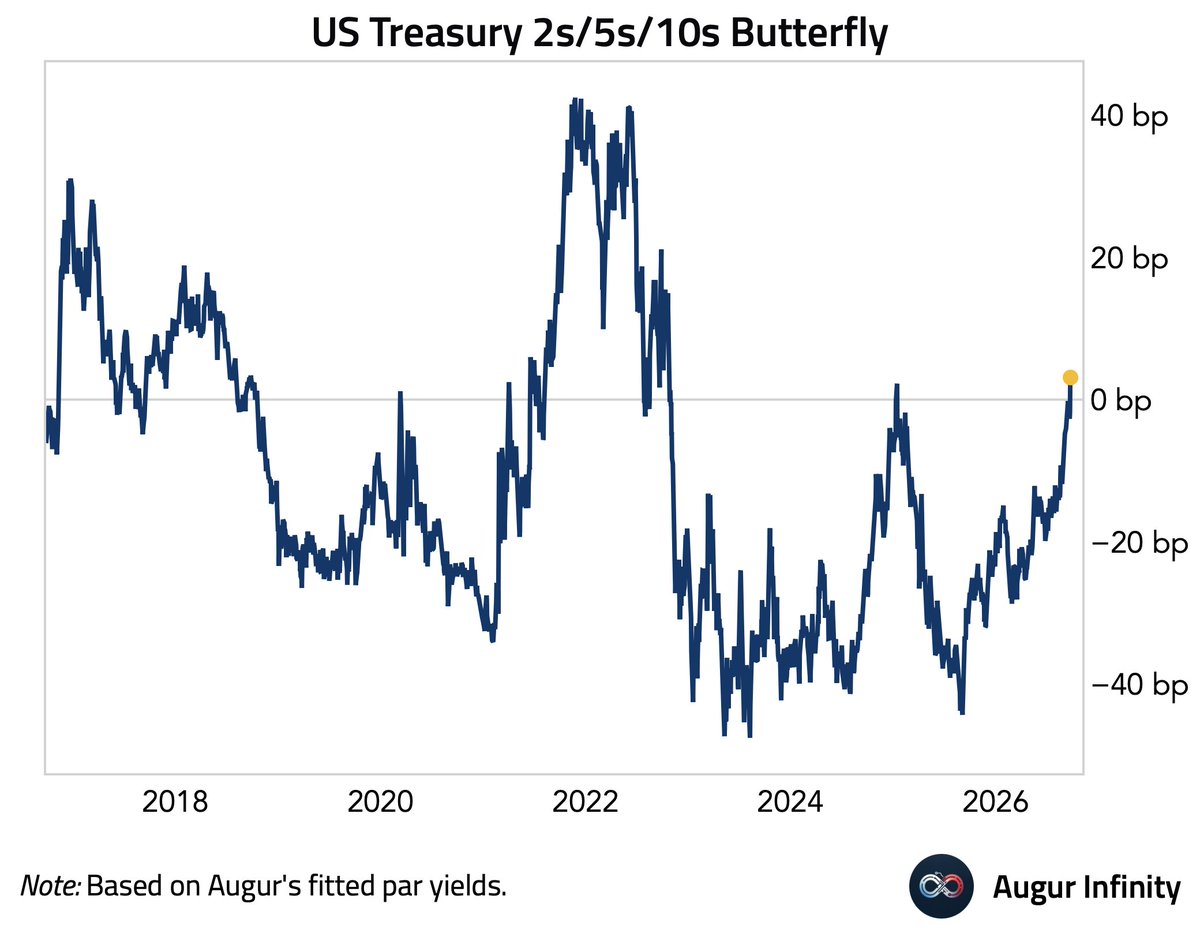
US Treasury 2s/5s/10s par-yield butterfly, basis points, 2017-2026 | Back to about 0bp and turning positive after years below zero
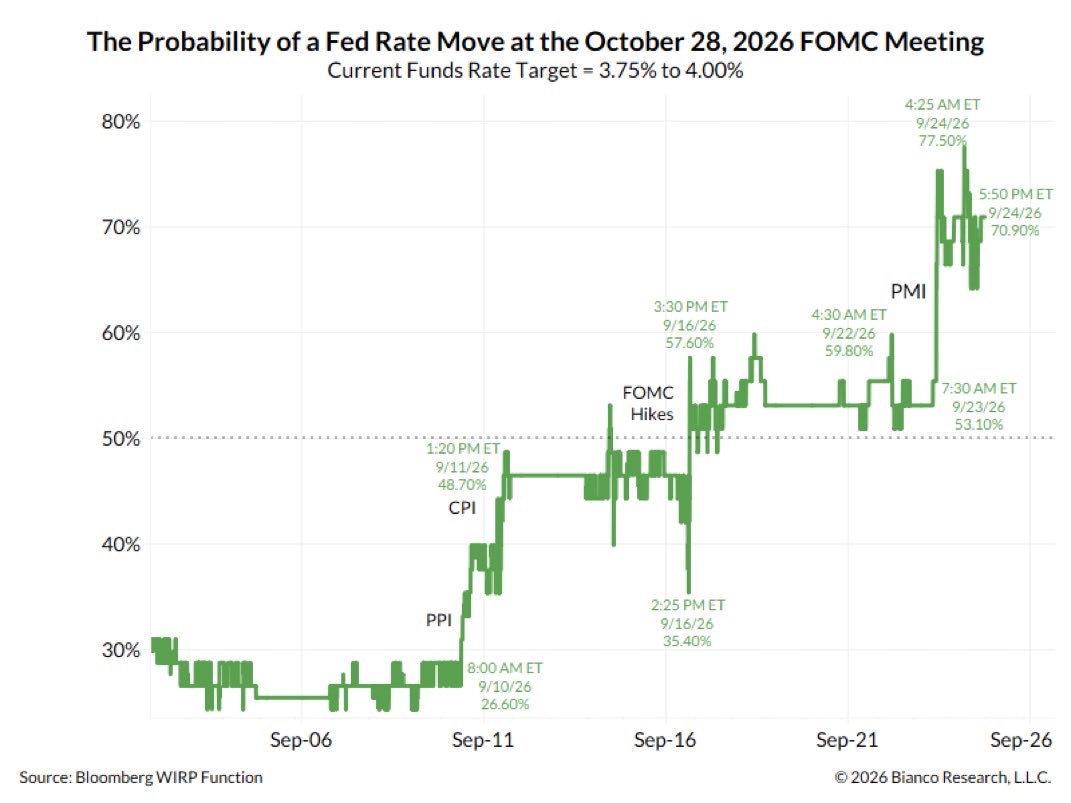
Market-implied probability of an October 28 FOMC rate move | 70.9% on Sept 24, up from 26.6% at the start of the month
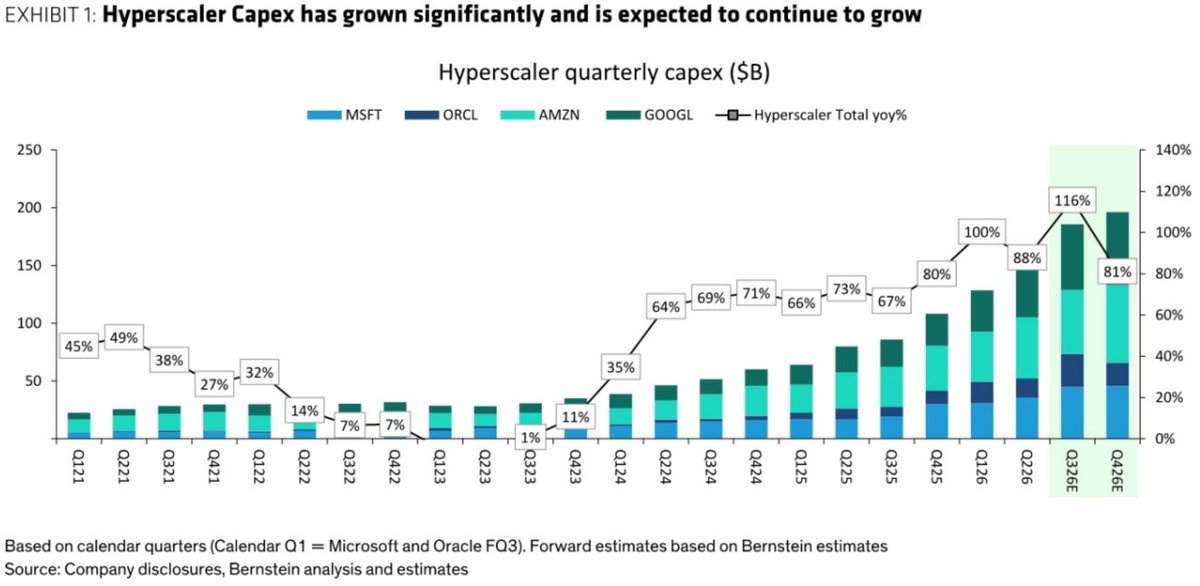
MSFT, ORCL, AMZN and GOOGL quarterly capex ($B) | Q4 modeled near $196B, +81% YoY, after a projected +116% in Q3
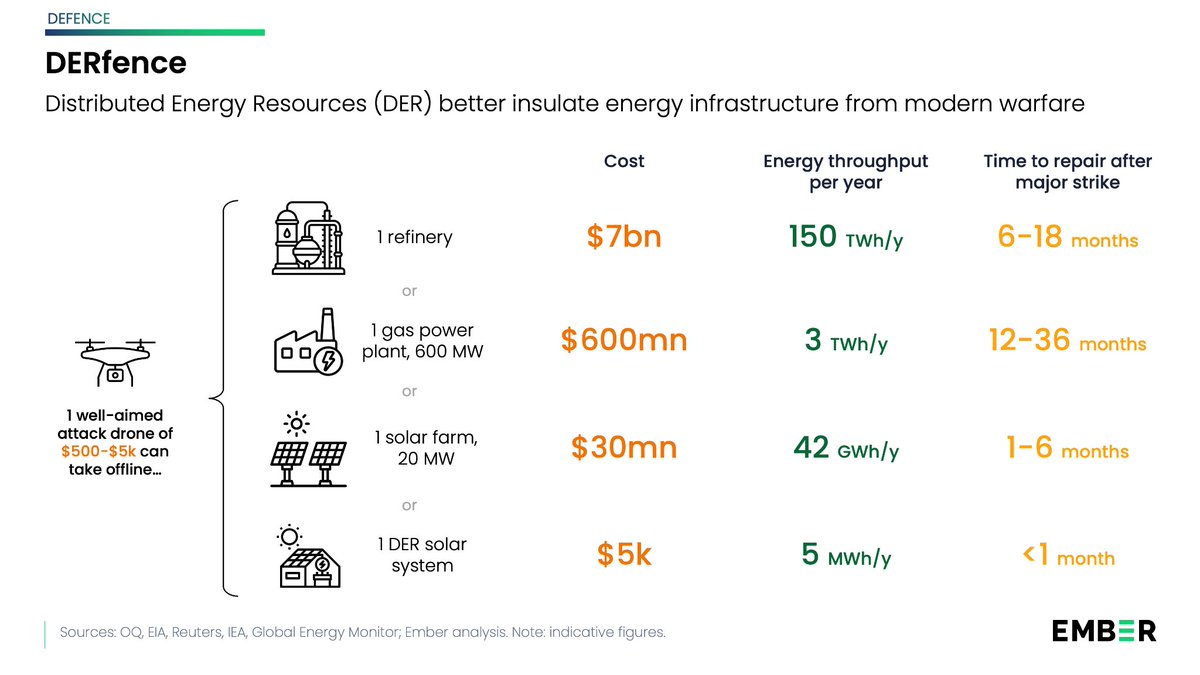
Cost, annual energy throughput and post-strike repair time for centralized vs distributed energy assets (Ember) | A refinery takes 6-18 months to repair; a $5k DER solar system, under a month
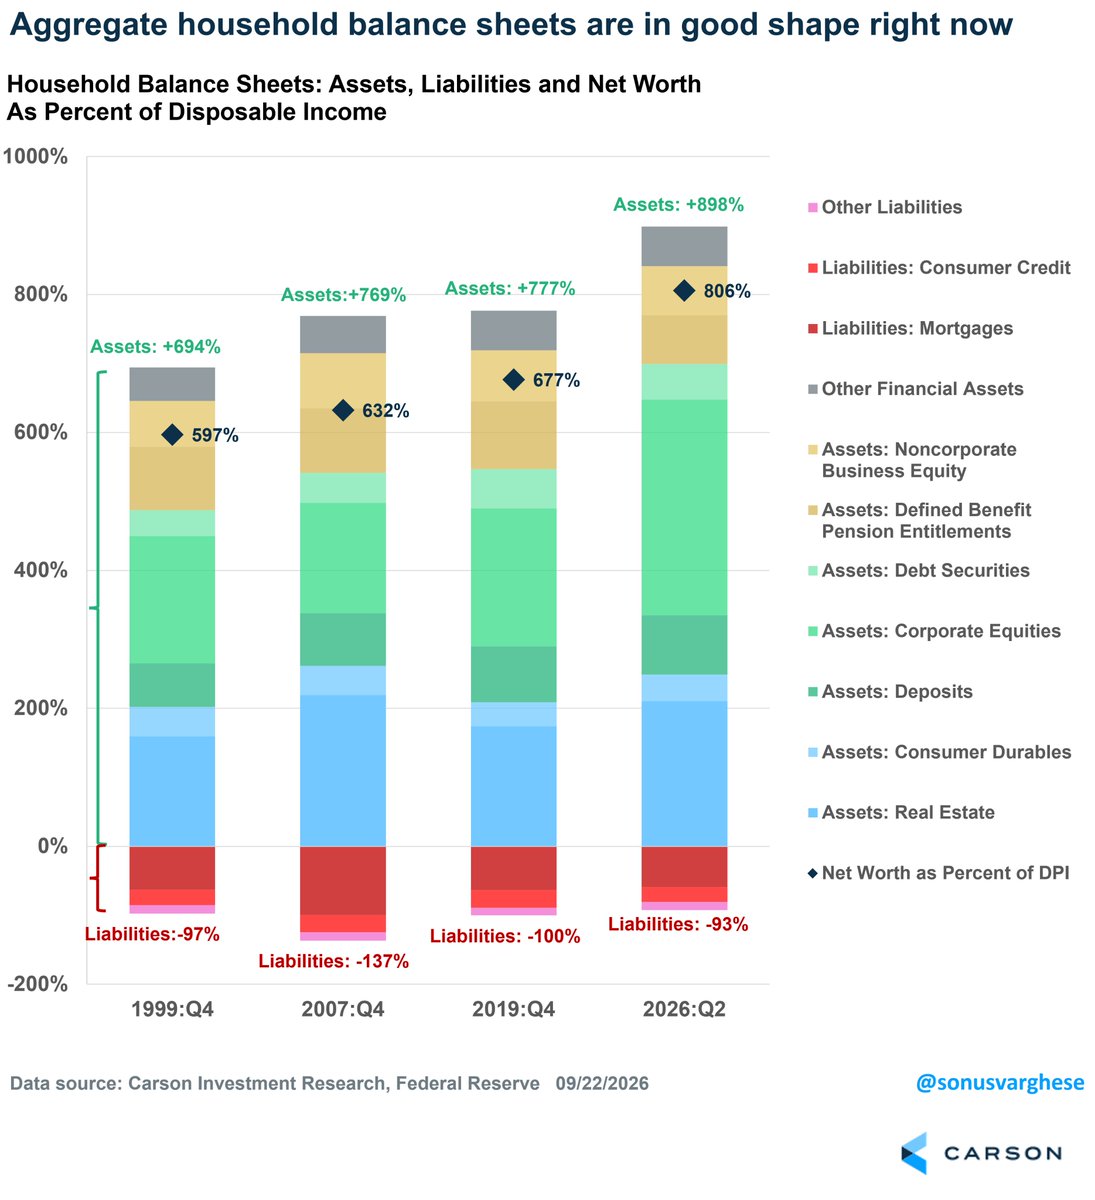
US household balance sheet as a percent of disposable income | 2026 Q2 net worth at 806%, assets 898% and liabilities just 93%
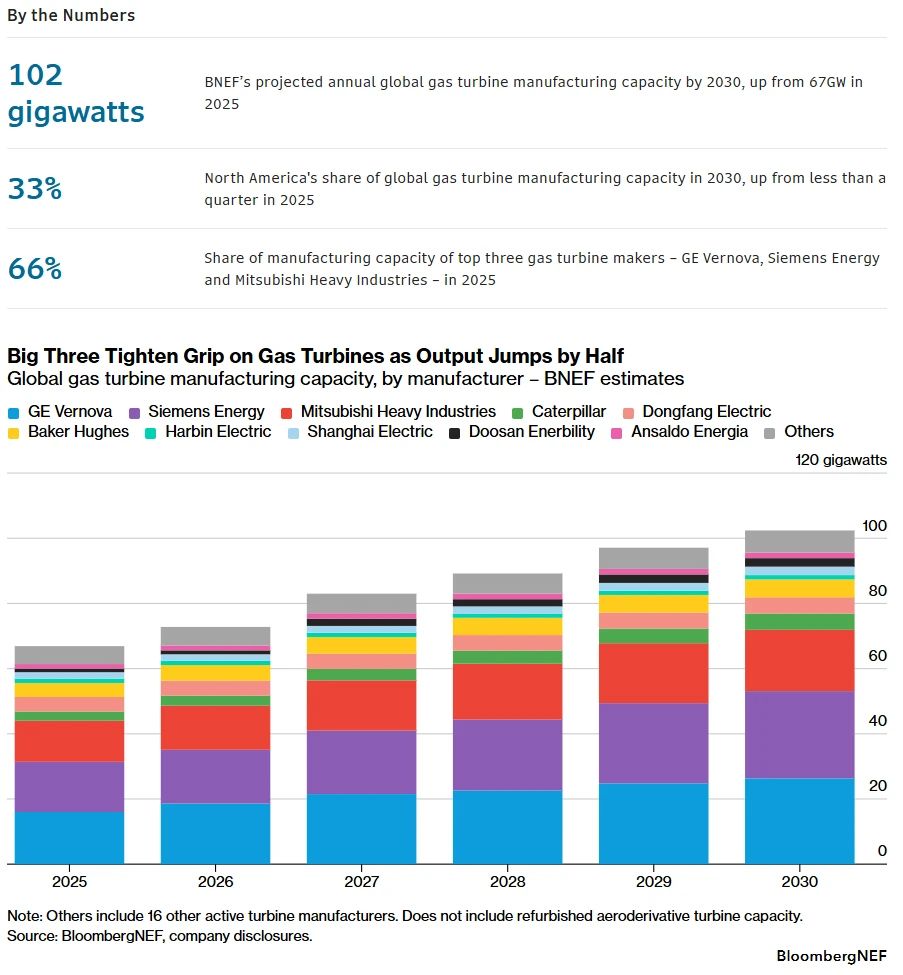
Global gas-turbine manufacturing capacity by maker, 2025-2030, BNEF estimates | Rising from 67GW to 102GW, with GE, Siemens and Mitsubishi about 66% of the total
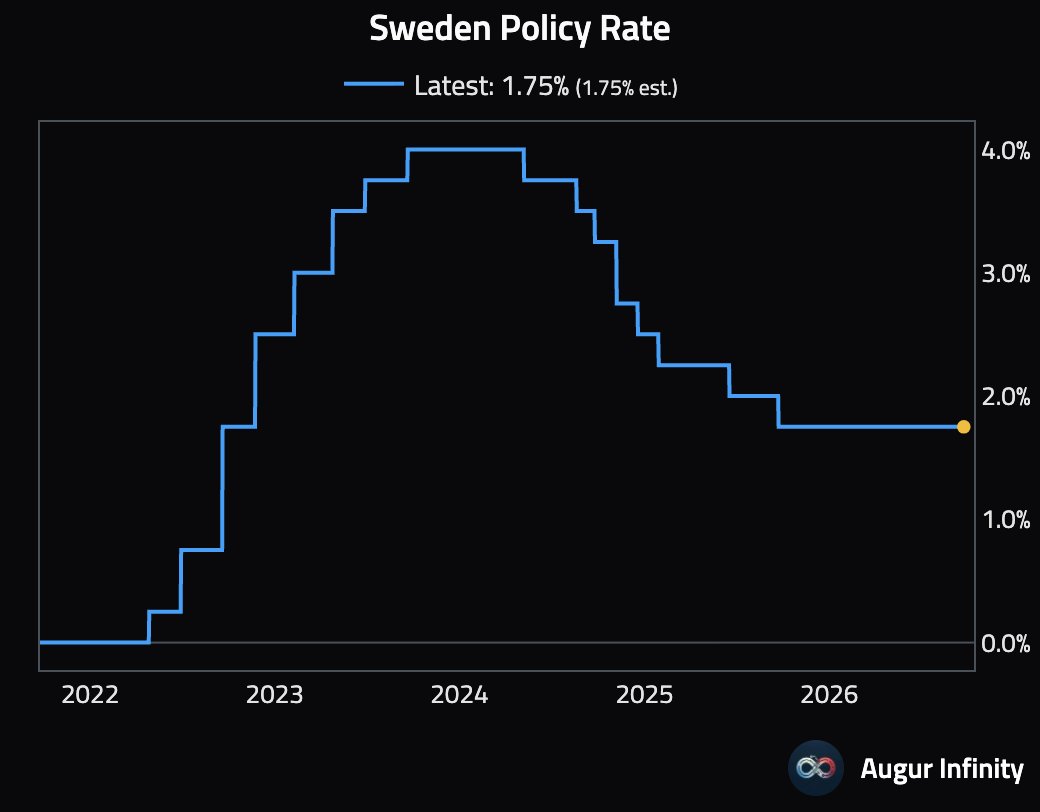
Sweden policy rate, 2022-2026 | Held at 1.75%, down 225 basis points from the 4% peak in 2024
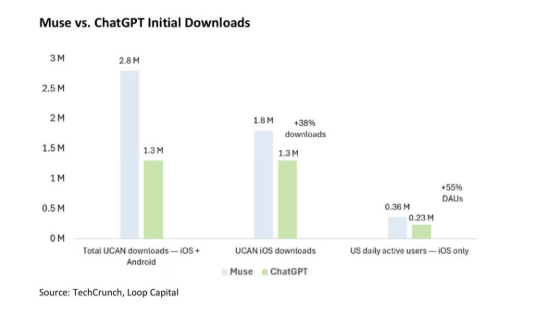
Muse versus ChatGPT initial downloads and active users | Muse at 2.8M total downloads versus ChatGPT's 1.3M, with 0.36M daily active users
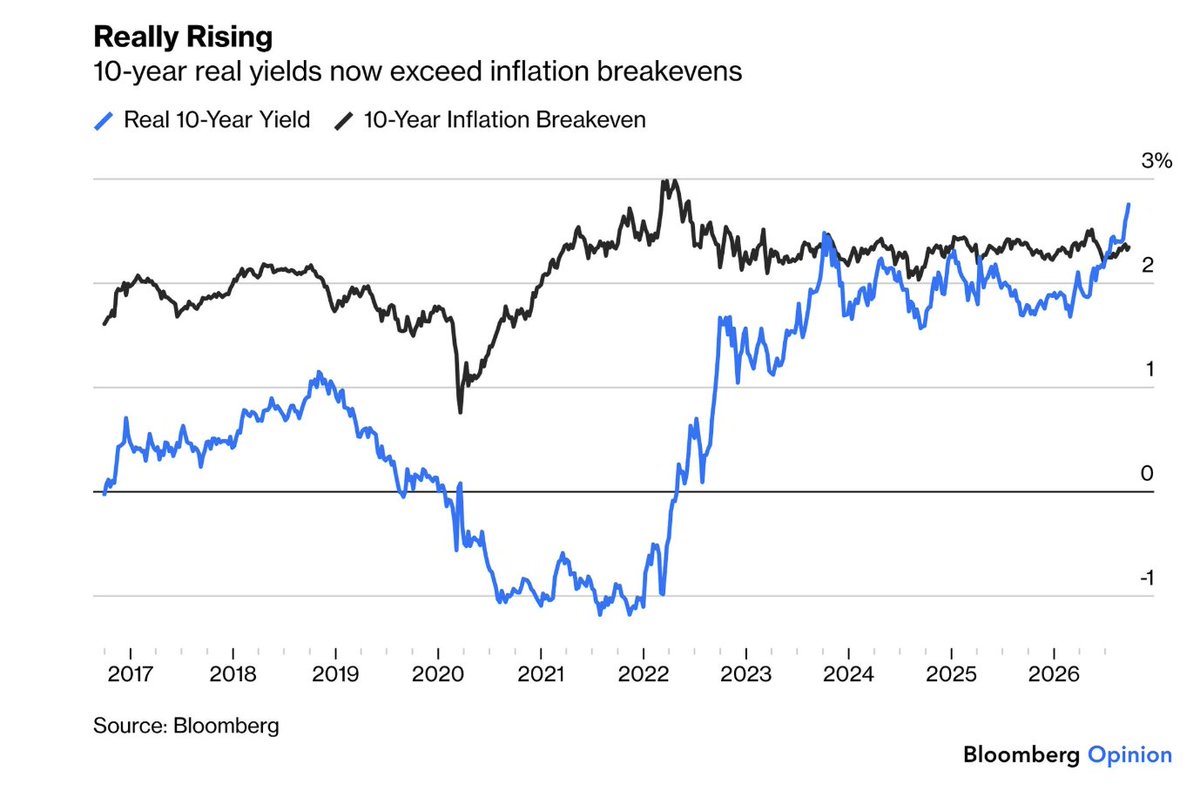
US 10-year real yield versus inflation breakeven, 2017-2026 | Real yield near 2.8%, now exceeding the breakeven of about 2.2%
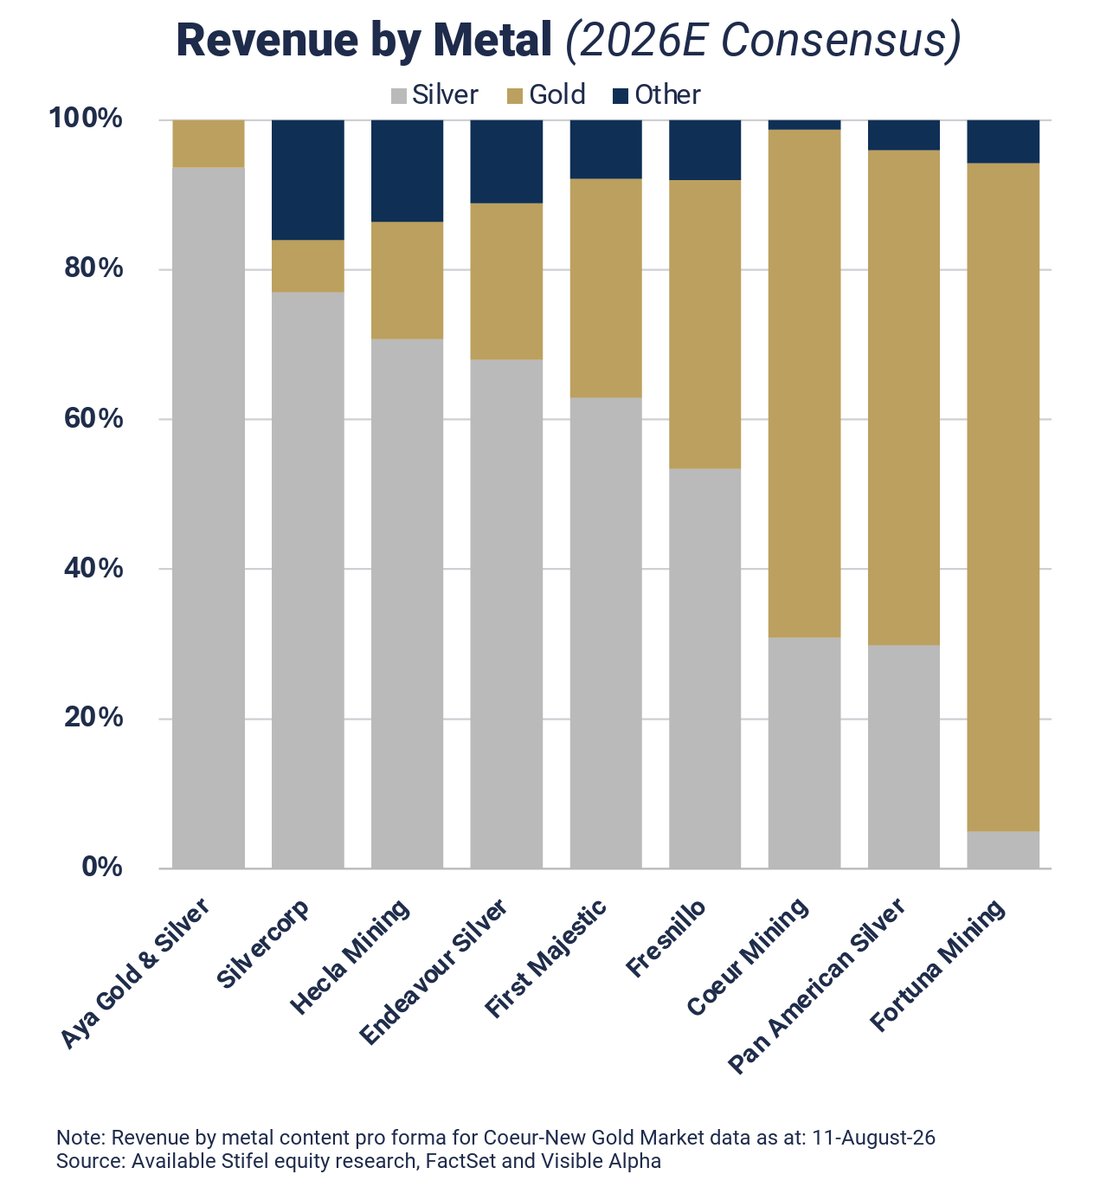
2026E revenue by metal for silver miners | Aya Gold & Silver at about 93% silver, the highest among peers
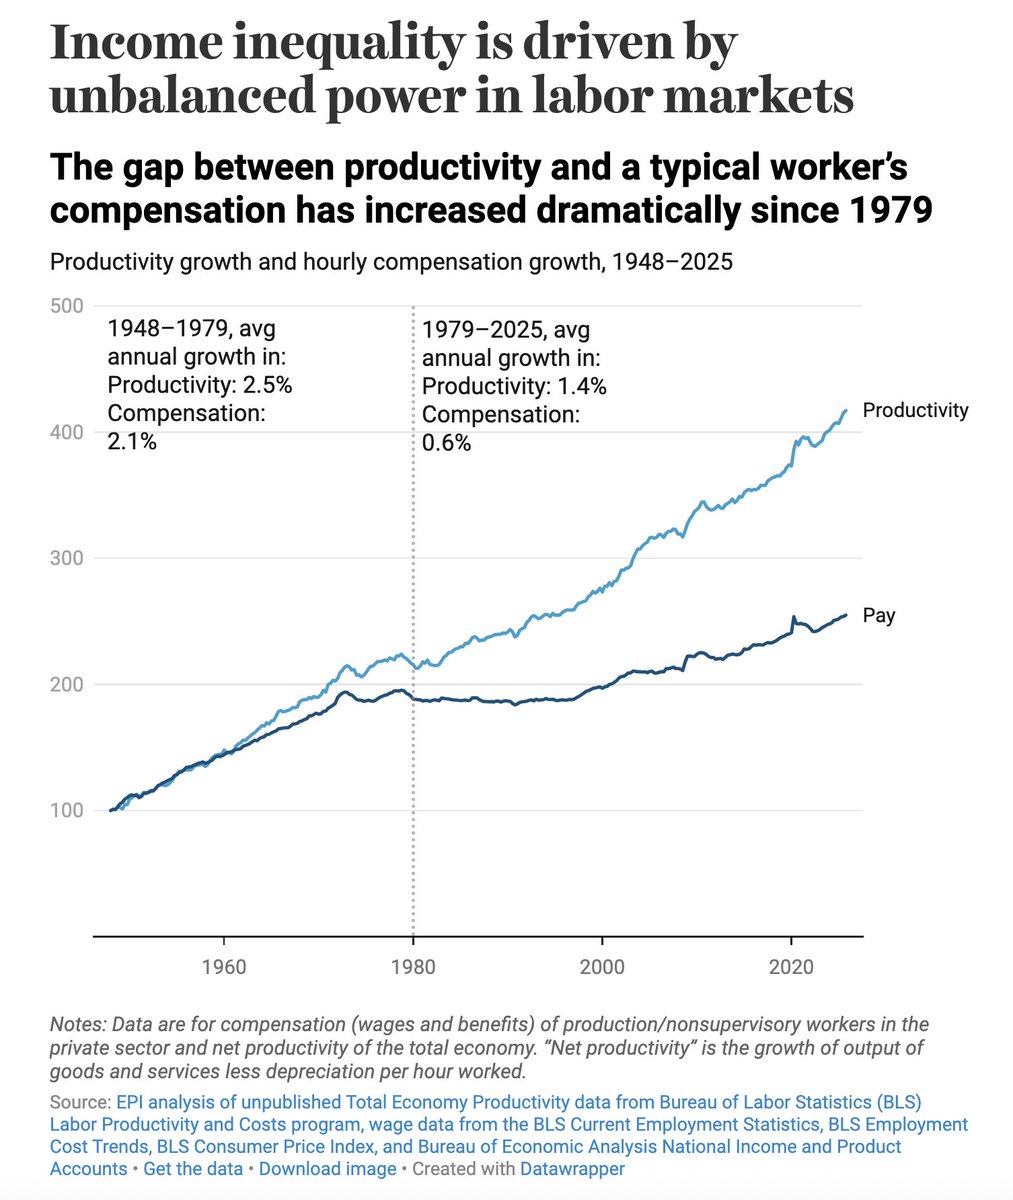
Productivity vs hourly compensation growth, 1948-2025 | Since 1979 productivity rose 1.4%/yr versus 0.6% for pay, widening the gap
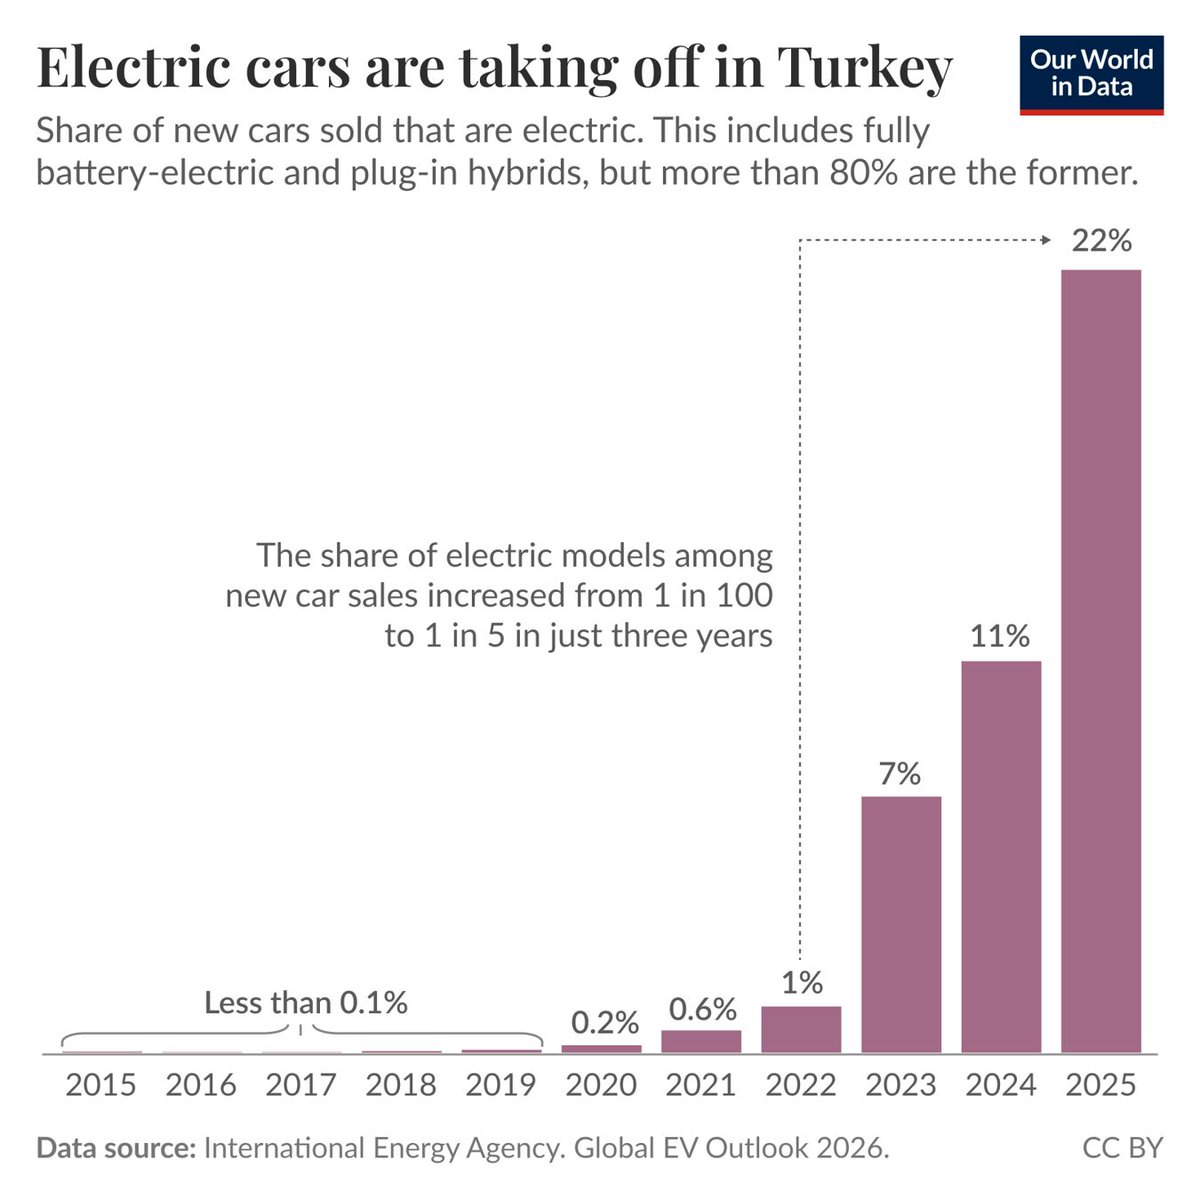
Share of new cars sold in Turkey that are electric, 2015-2025 | Just 1% in 2022, 22% by 2025, a more than 20-fold jump
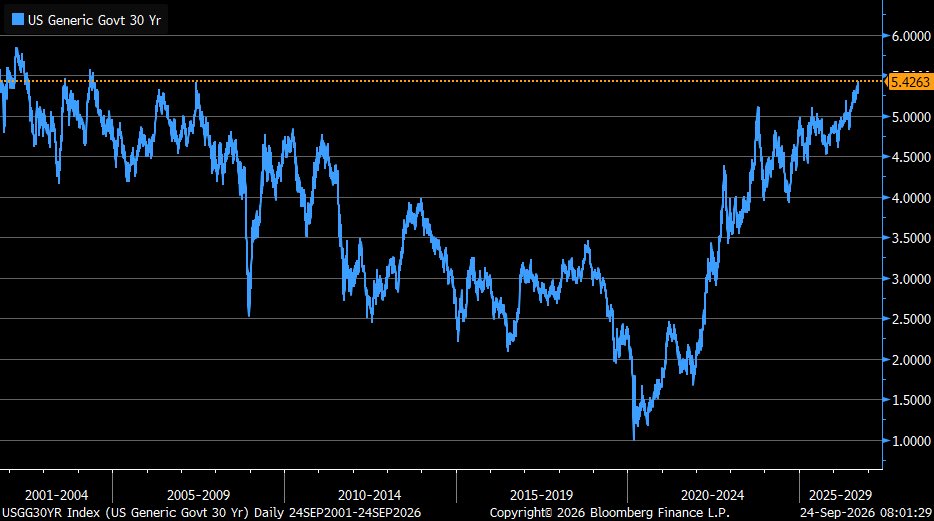
US 30-year Treasury yield (USGG30YR), 2001-2026 | Now 5.4263%, up from the 2020 low to the highest since 2004
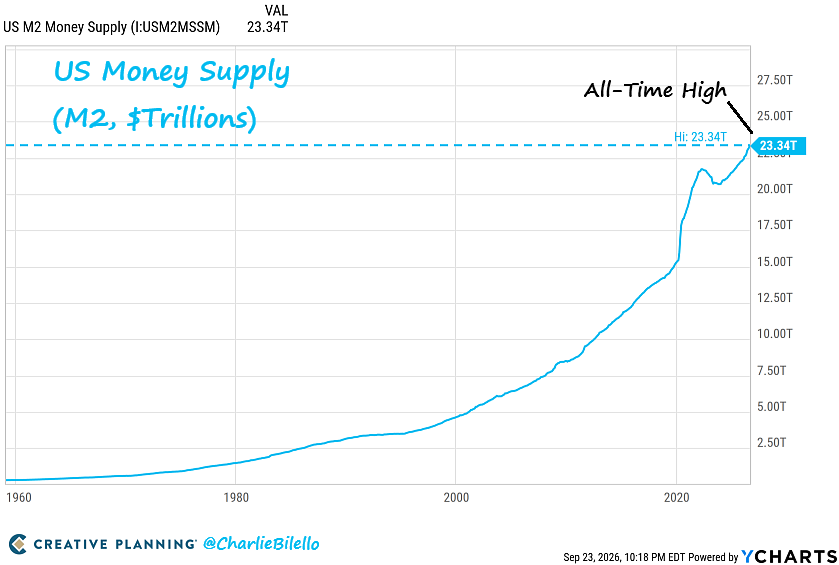
US M2 money supply, $trillions, 1960-2026 | Now $23.34tn at a record high, up from about $15tn in 2020
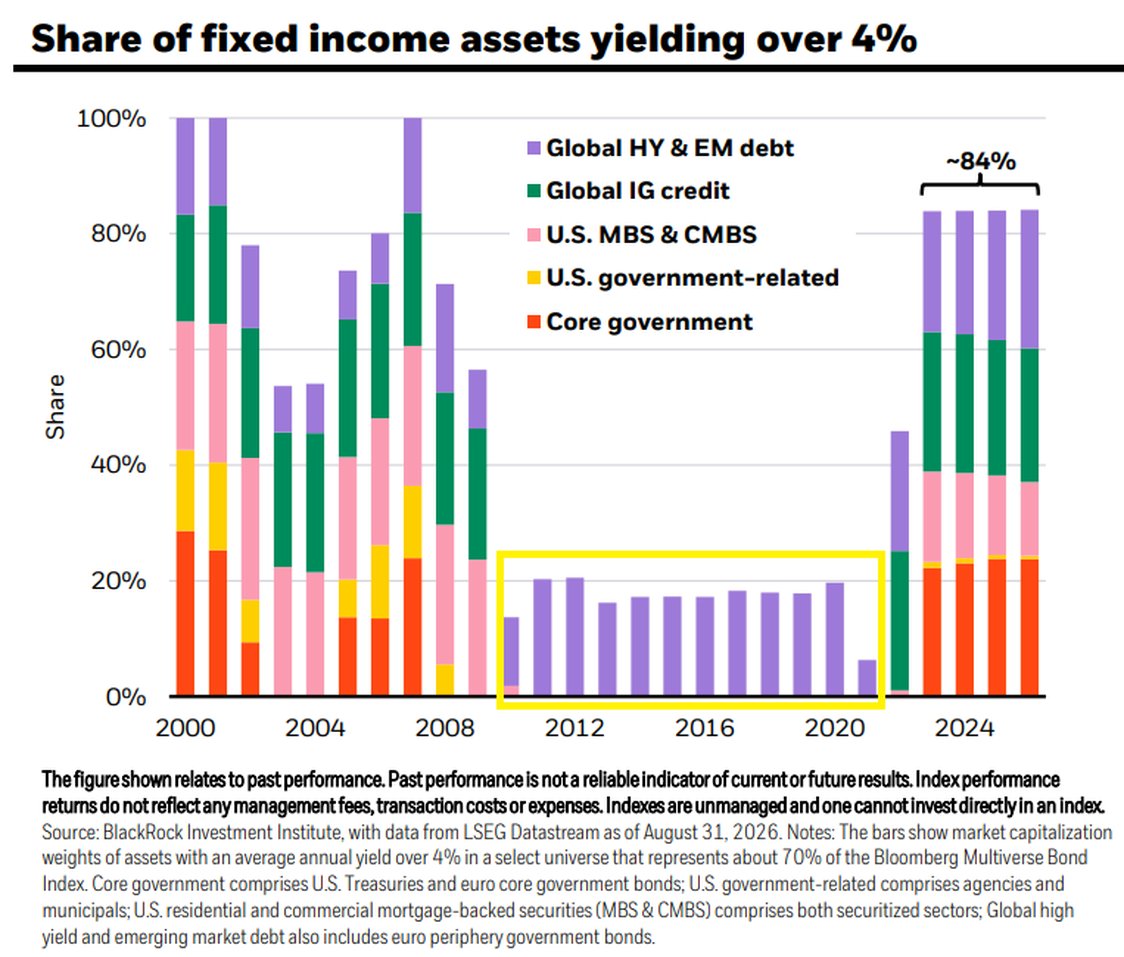
Share of fixed-income assets yielding over 4% by category, 2000-2026 | Now about 84%, far above the ~15-20% of the 2010s
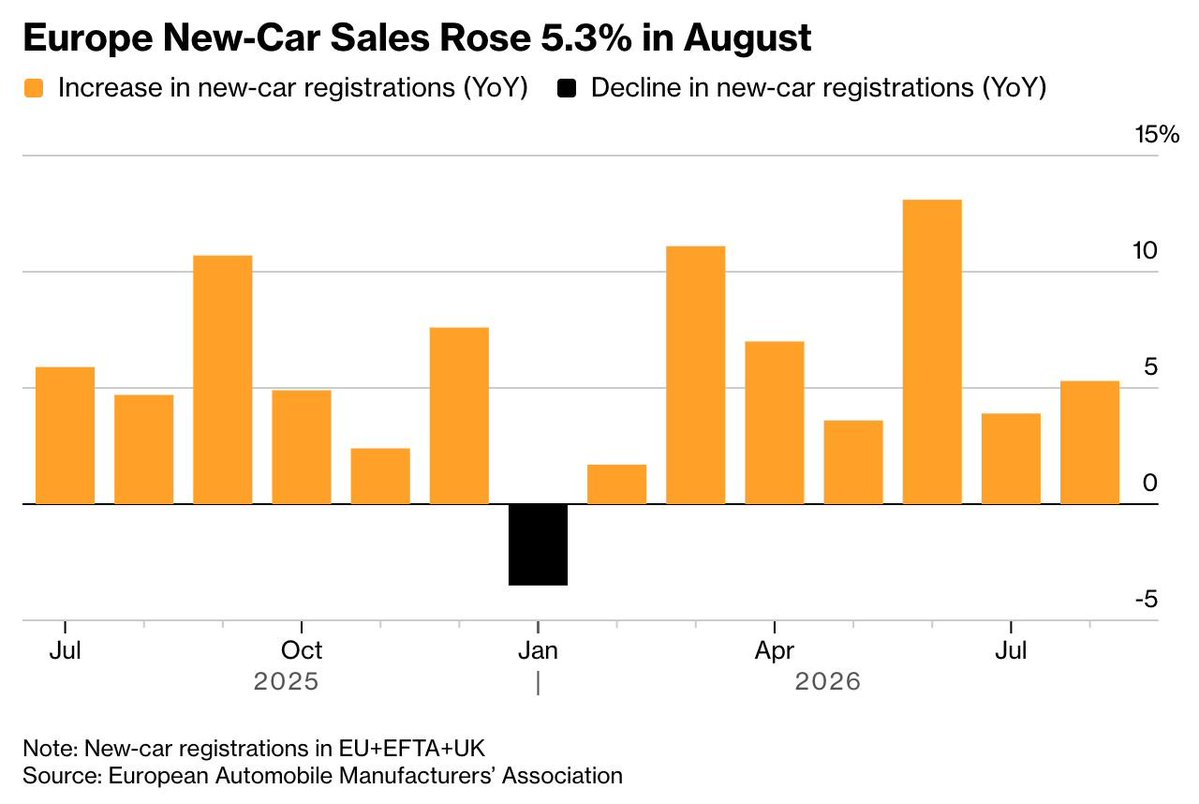
Europe new-car registrations, year-on-year, EU+EFTA+UK | Up 5.3% in August 2026
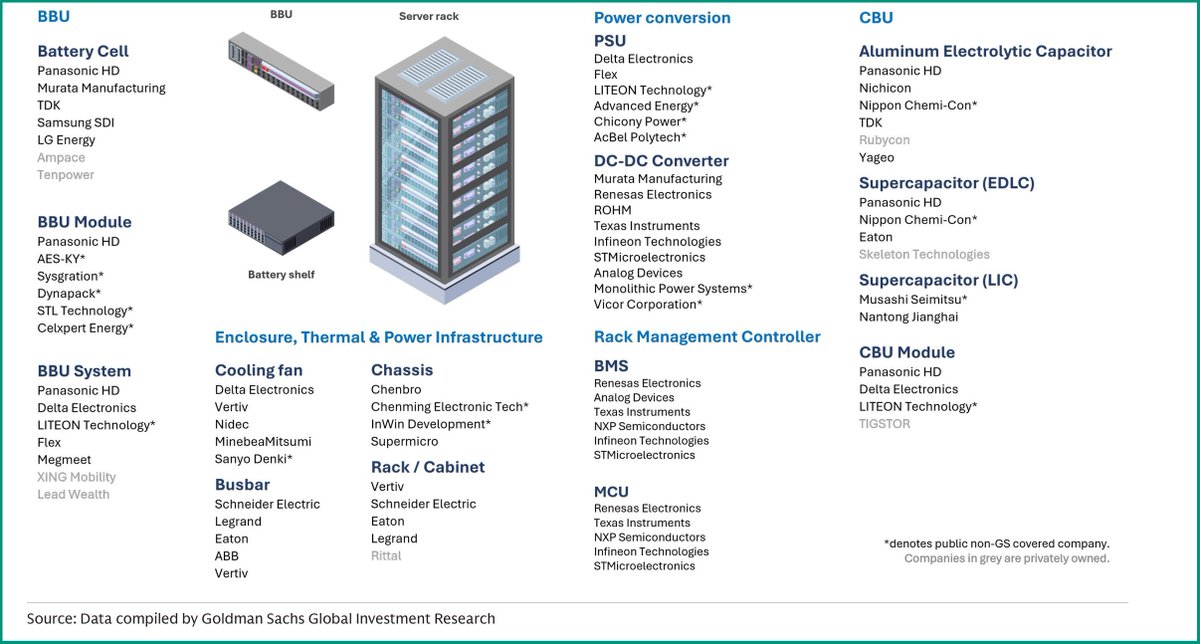
Map of key suppliers across the AI server power supply chain, by Goldman Sachs | Five layers: battery BBU, enclosure/thermal, power conversion, rack management and capacitors
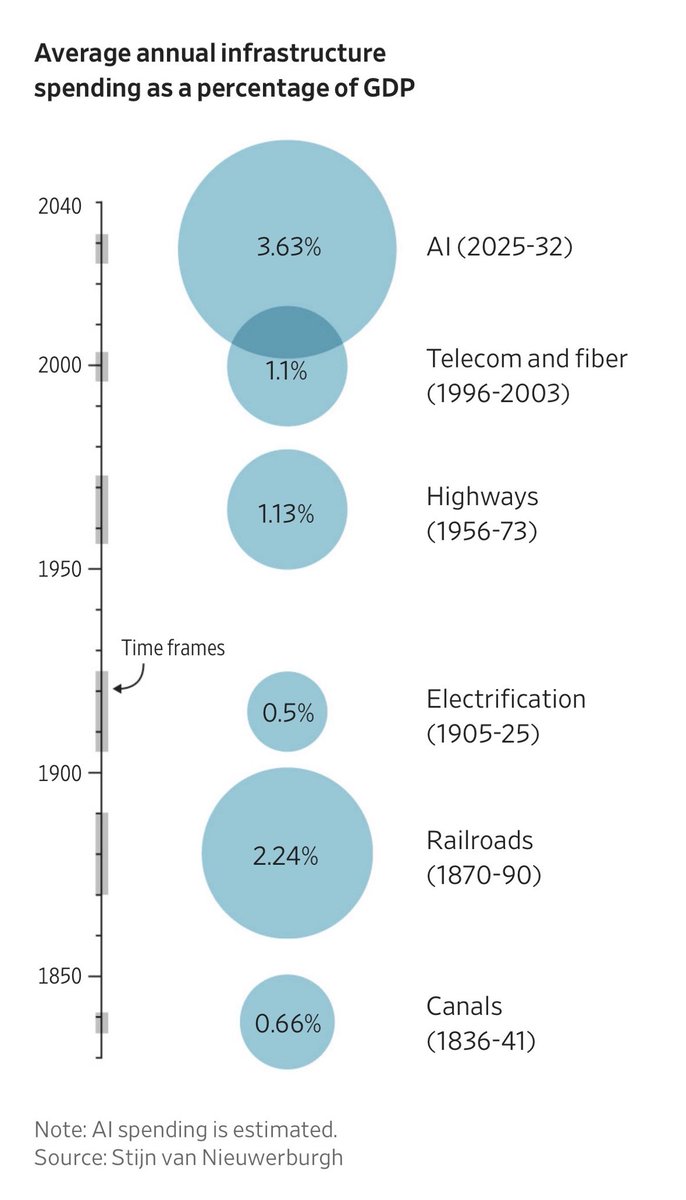
Average annual infrastructure spending as a share of GDP by era, 1836-2032 | AI (2025-32) estimated at 3.63%, above railroads' 2.24% and highways' 1.13%
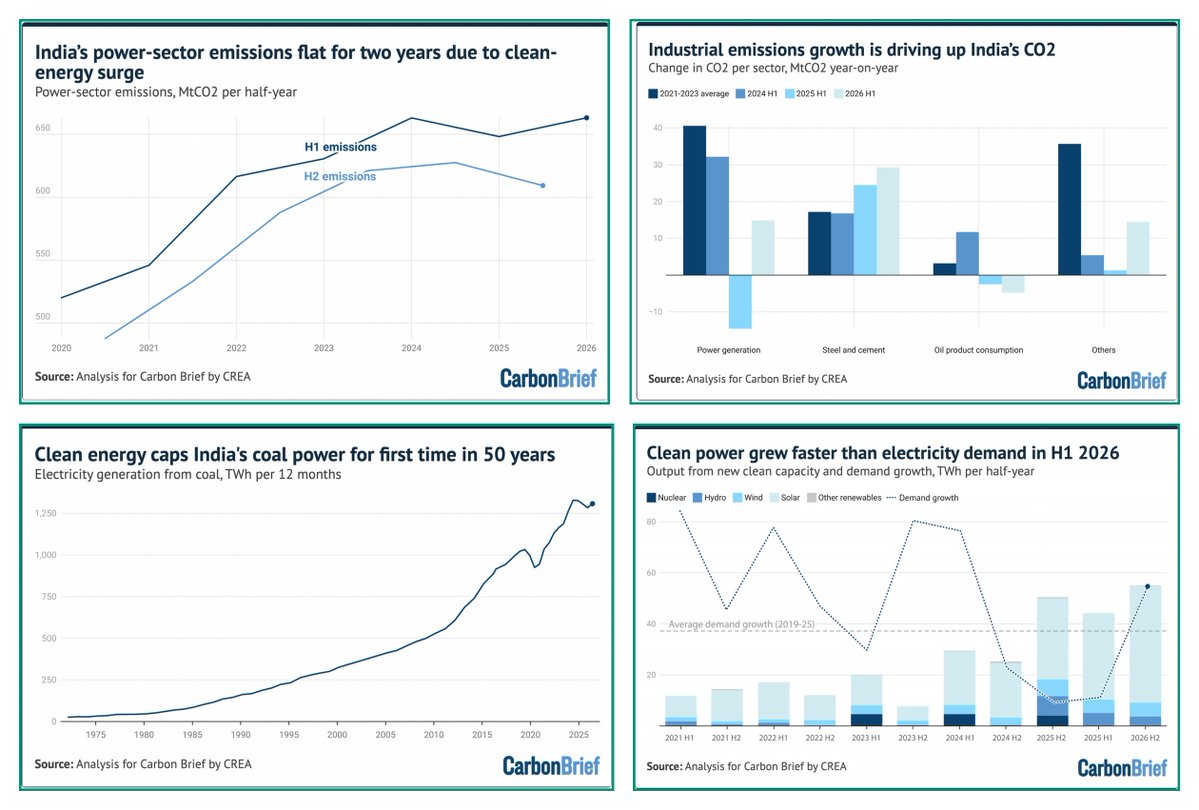
Four charts on India's power emissions and clean energy | Electricity demand up 7% while coal generation stays flat, capping coal for the first time in 50 years
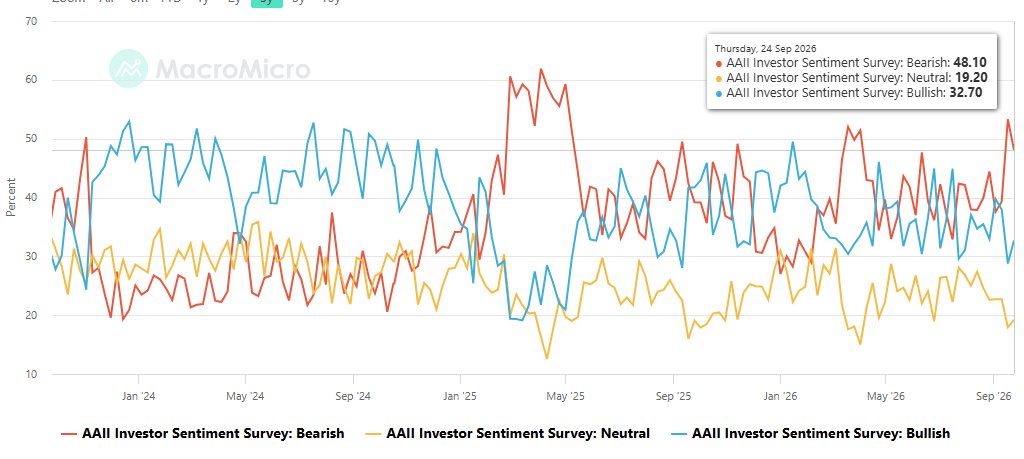
AAII investor sentiment: bulls, bears and neutral | Bears at 48.1%, bulls 32.7%, neutral 19.2% as of Sep 24, 2026
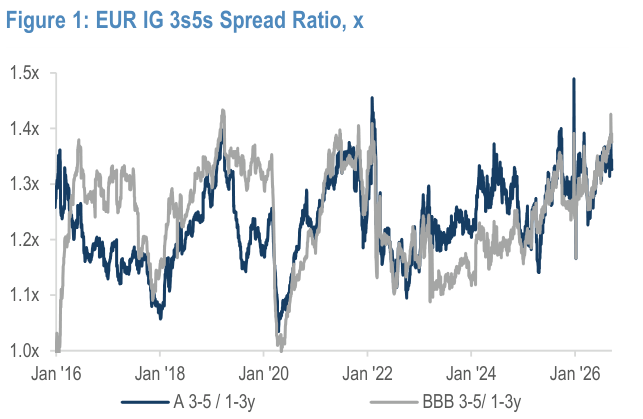
European A and BBB IG credit 3-5y/1-3y spread ratios, 2016-2026 | BBB now above ~1.4x, near its post-pandemic high
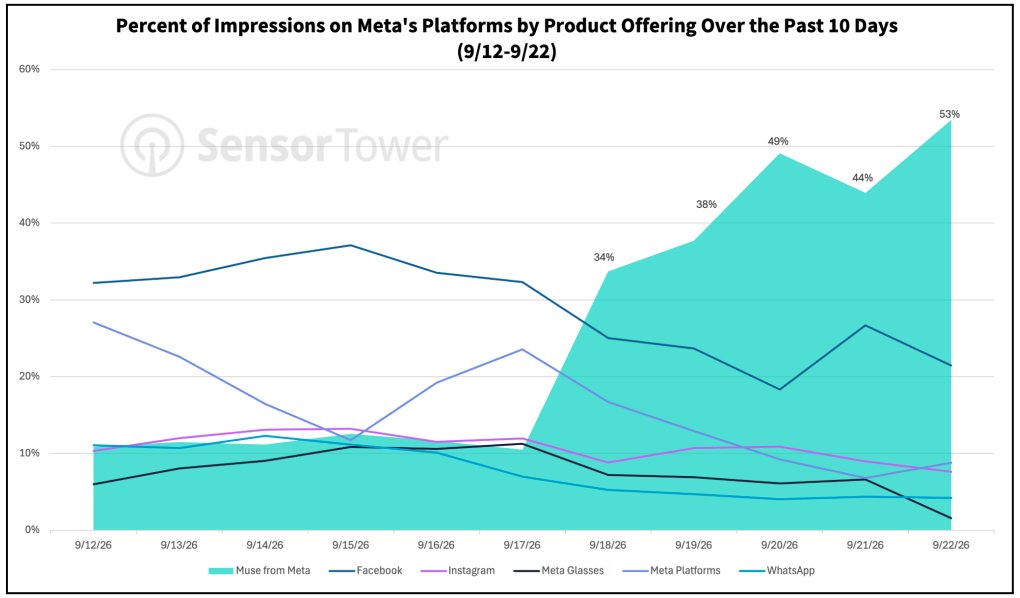
Share of impressions across Meta's products, 9/12-9/22 | Muse climbs from about 11% to 53%, overtaking Facebook and Instagram
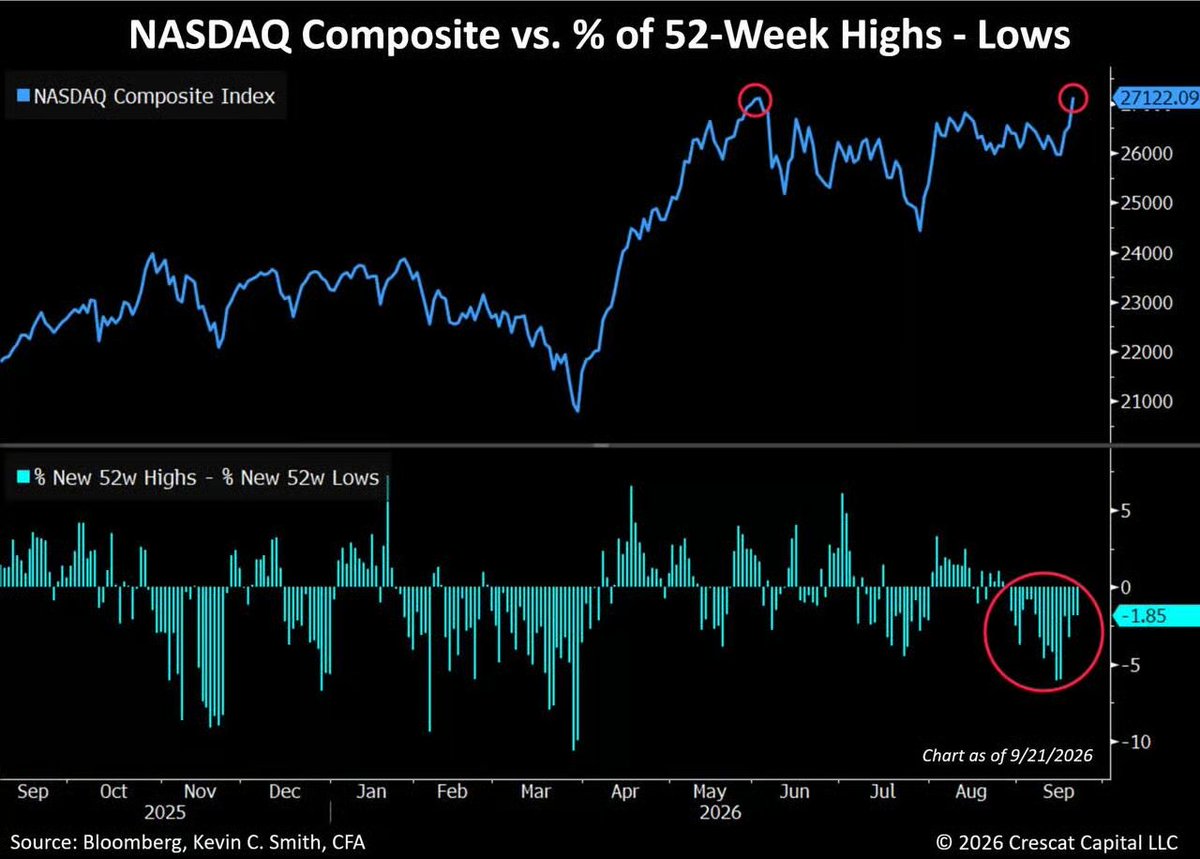
Nasdaq Composite vs net % of 52-week highs minus lows | Index at 27,122 while breadth sits at -1.85%, a widening divergence
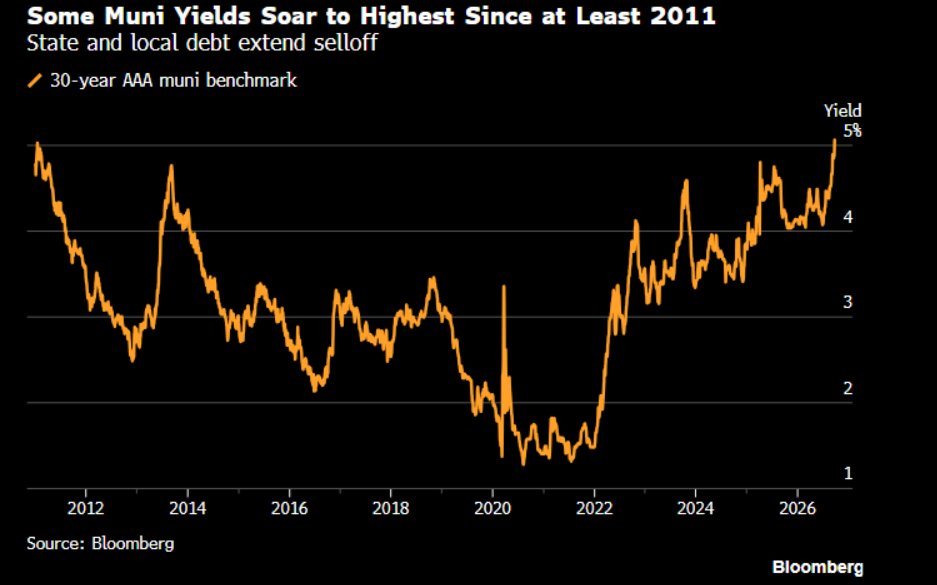
30-year AAA municipal benchmark yield, 2011-2026 | Now above 5%, the highest since at least 2011 as state and local debt sells off
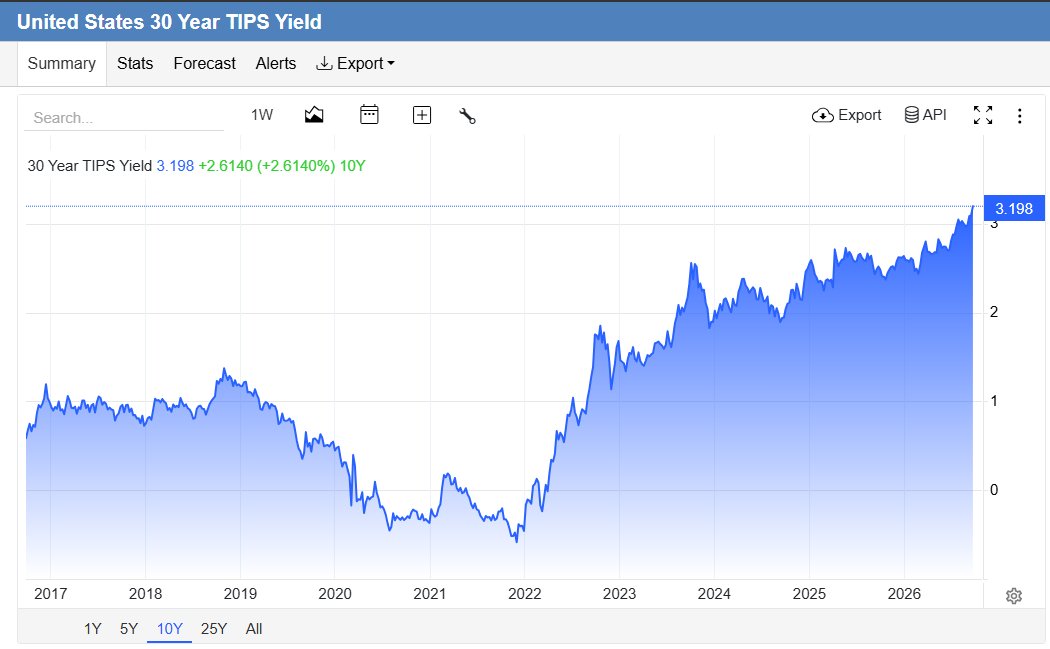
US 30-year TIPS real yield, 2017-2026 | Now about 3.20%, the highest since 2017
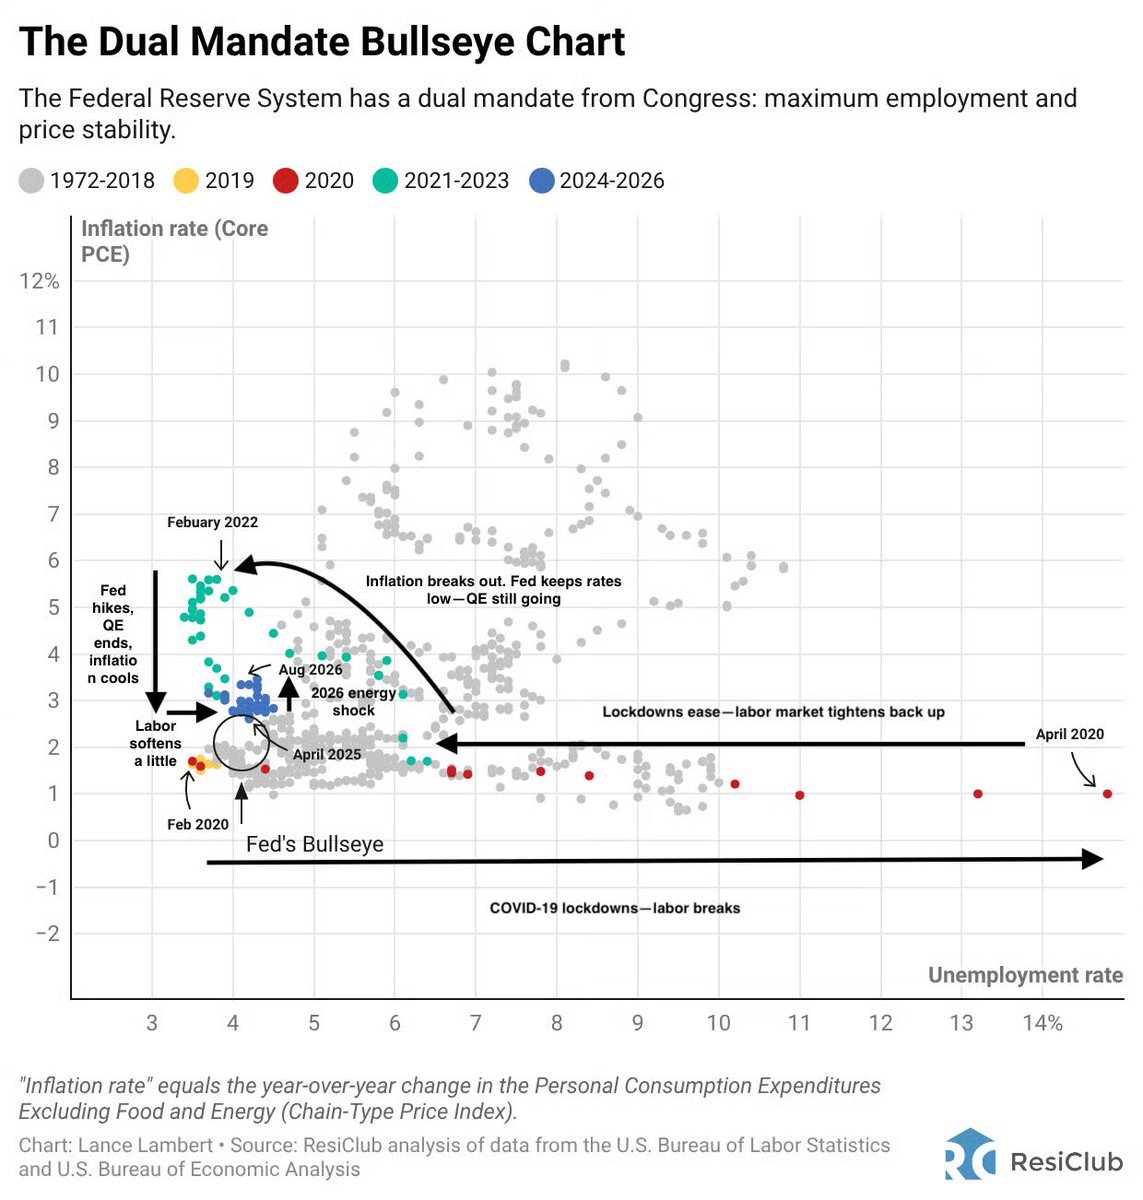
Core PCE inflation vs unemployment, 1972-2026 | 2024-2026 dots cluster near 2-3% inflation and about 4% unemployment, close to both mandates
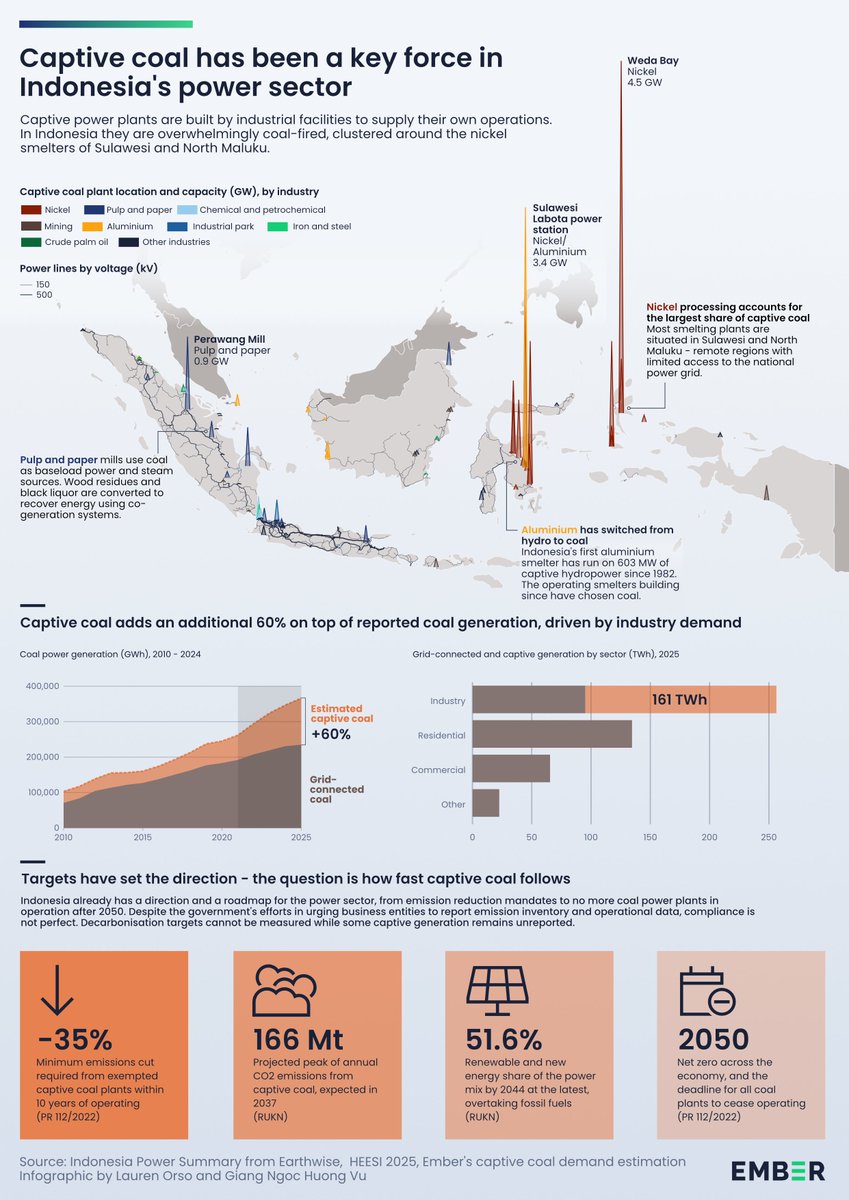
Indonesia captive coal power plant locations and generation by sector | Captive coal adds about 60% on top of grid-connected coal, with 161 TWh in industry