The Chart Everyone Read as an AMD Win Says the Opposite on the Left
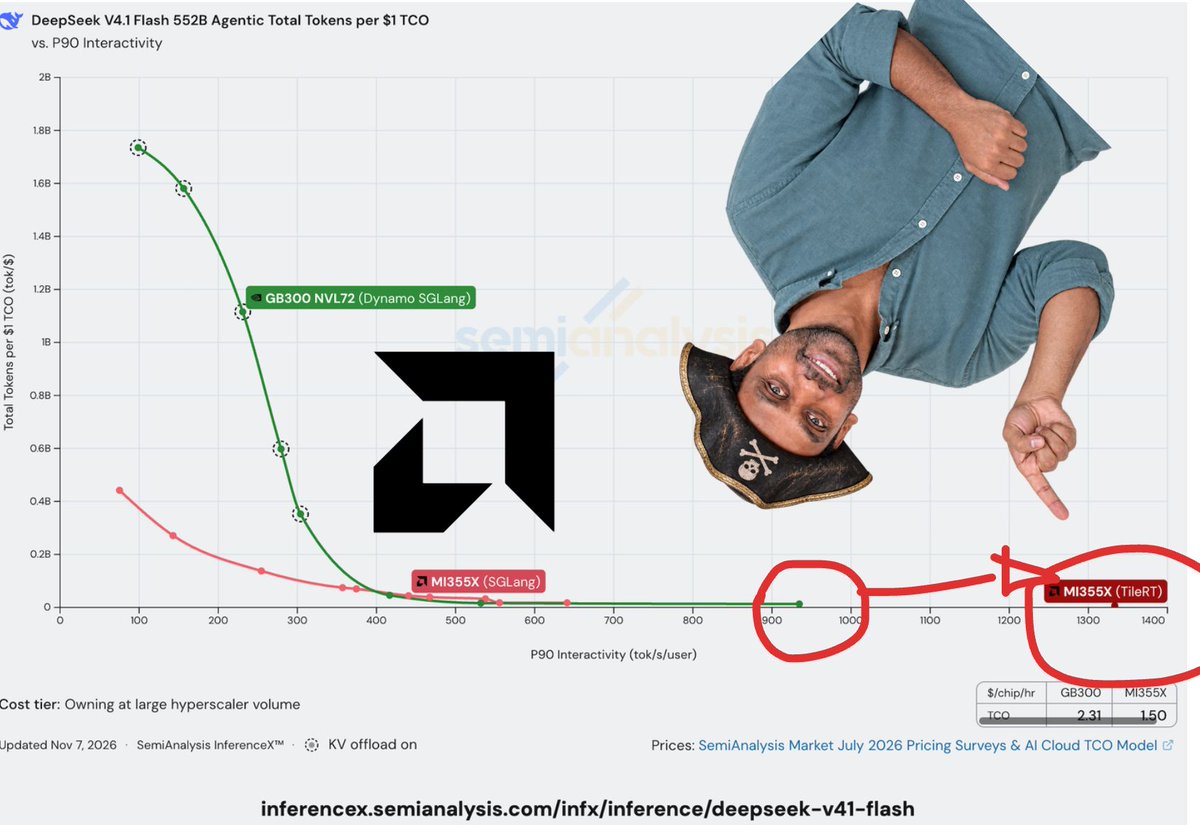
The horizontal axis is how many tokens each user gets per second. The vertical axis is how much output one dollar of total cost of ownership buys. AMD's red marker sits at the far right, and it has been read as AMD overtaking Nvidia.
The left half says otherwise. At around 100 tokens per second, the speed most applications actually run at, an Nvidia GB300 rack produces roughly 1.74 billion tokens per dollar against about 0.48 billion for AMD's MI355X, a gap of more than three times. The same benchmark site's earlier tests on other models show the same shape: Nvidia leads by well over 100% at low interactivity, and the two only converge to around 13% near 166 tokens per second.
What AMD has actually done is different. Paired with its TileRT software, it extends the curve past 1,300 tokens per second per user, a range Nvidia's line never reaches. At that speed, though, output per dollar is close to zero for both.
The real difference is in the small table in the corner: $2.31 per chip-hour for the GB300 against $1.50 for the MI355X. AMD is winning on sticker price, not on silicon throughput.
Two caveats. These costs assume hyperscaler-volume purchasing that ordinary buyers do not get, and the TileRT reading currently rests on a single relayed source with no independent confirmation.
Why does the fast end matter at all? Agentic work has to run step after step before it returns anything, so the user is waiting on the whole chain rather than on one sentence. Whoever can bring down the cost of serving at those speeds wins the next round.
Source: SemiAnalysis InferenceX benchmark pages and its DeepSeek cross-accelerator comparisons, plus third-party relays of the firm's latest post (Image: @SemiAnalysis_)