The Same Deaths, One Line Up 50% and the Other Down a Third
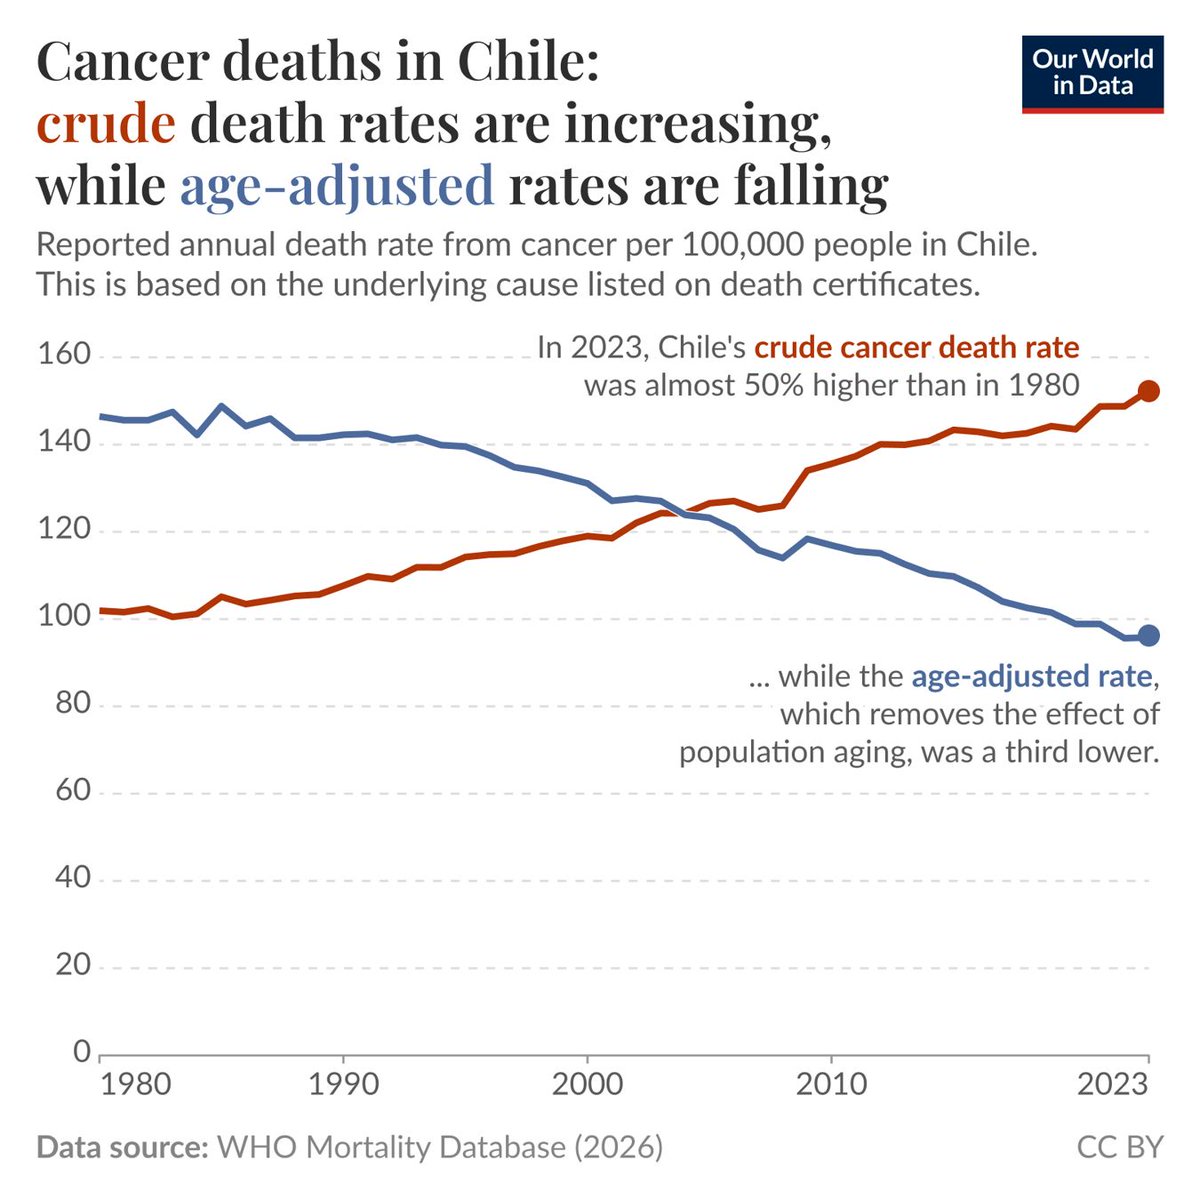
Cancer death rates in Chile, 1980 to 2023. The red line climbs from 101 per 100,000 to 152, almost 50% higher. The blue line falls from 146 to 95, down by a third. Both lines describe the same country, the same years and the same death records.
There is only one difference. The blue line holds the age structure of the population fixed before calculating.
■ Age is the variable being hidden
Cancer risk rises steeply with age, and Chile has aged quickly over these four decades, with the share of people over 65 multiplying several times over. When a country has more old people, the national death rate can keep rising even if the chance of dying of cancer falls within every single age group. The red line measures how many people actually died. The blue line measures whether risk changed for people of the same age.
The two lines cross around 2003. From that point on, Chile's cancer outcomes have genuinely been improving while the headline rate looked steadily worse.
Which line is right depends on the question. To judge whether medicine is improving, read the blue one. To work out how many hospital beds and how much budget are needed next year, the red one is the bill that actually arrives.
Source: World Health Organization Mortality Database (Image: @OurWorldInData)