【同一批數字,一條漲了五成,一條跌了三分之一】🩺
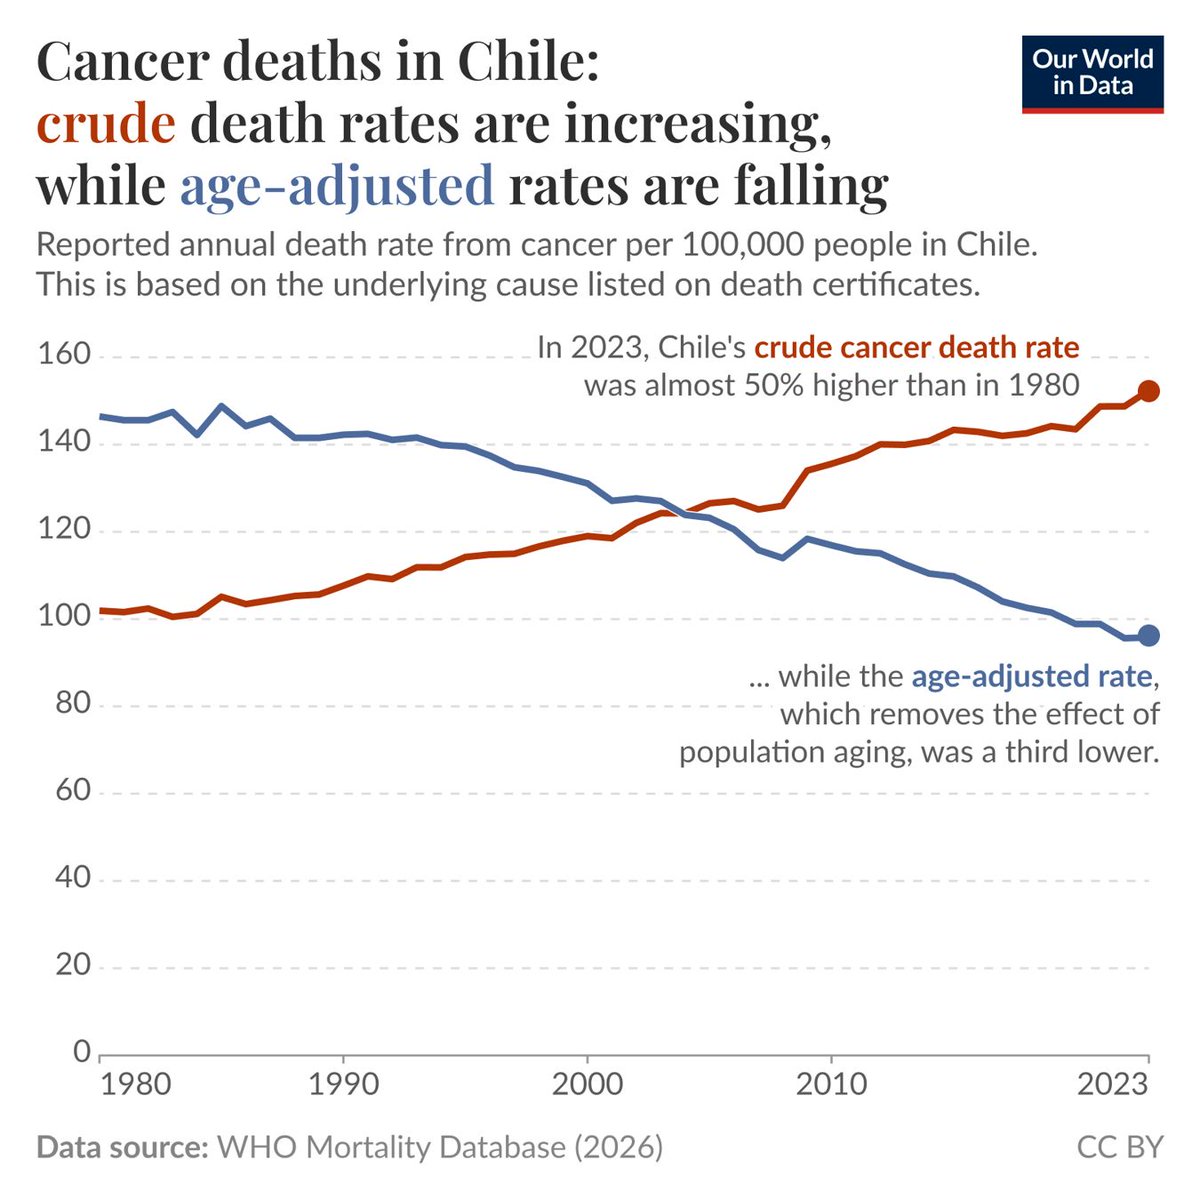
智利的癌症死亡率,1980 年到 2023 年。紅線從每十萬人 101 升到 152,漲了快五成。藍線從 146 降到 95,掉了三分之一。兩條線畫的是同一個國家、同一段時間、同一批死亡紀錄。
差別只有一個:藍線先把人口結構固定住再算。
■ 年紀是被藏起來的那個變數
癌症的風險隨年齡陡升。智利這四十年老得很快,六十五歲以上的人口占比翻了好幾倍。當一個國家的老人變多,就算每個年齡層得癌症過世的機率都在下降,全國加總起來的死亡率還是會往上。紅線量的是「實際上死了多少人」,藍線量的是「同年齡的人風險有沒有變」。
兩條線交叉在 2003 年前後。從那時候開始,智利的癌症防治其實一直在進步,但帳面上的死亡率看起來越來越糟。
哪一條才對,要看你問什麼。想知道醫療有沒有進步,看藍線。想知道明年要準備多少病床和多少預算,紅線才是要付的那個數字。
資料來源: 世界衛生組織死亡資料庫 (圖片來自 @OurWorldInData)
The Same Deaths, One Line Up 50% and the Other Down a Third
Cancer death rates in Chile, 1980 to 2023. The red line climbs from 101 per 100,000 to 152, almost 50% higher. The blue line falls from 146 to 95, down by a third. Both lines describe the same country, the same years and the same death records.
There is only one difference. The blue line holds the age structure of the population fixed before calculating.
■ Age is the variable being hidden
Cancer risk rises steeply with age, and Chile has aged quickly over these four decades, with the share of people over 65 multiplying several times over. When a country has more old people, the national death rate can keep rising even if the chance of dying of cancer falls within every single age group. The red line measures how many people actually died. The blue line measures whether risk changed for people of the same age.
The two lines cross around 2003. From that point on, Chile's cancer outcomes have genuinely been improving while the headline rate looked steadily worse.
Which line is right depends on the question. To judge whether medicine is improving, read the blue one. To work out how many hospital beds and how much budget are needed next year, the red one is the bill that actually arrives.
Source: World Health Organization Mortality Database (Image: @OurWorldInData)