Daily · 2026-11-06
On the second trading day after the US midterms, AI stocks went from splitting in two to falling together. On November 5 the Philadelphia Semiconductor Index fell 12.25%, its biggest one-day drop since the Covid crash of March 2020, closing at 9,011, 38.4% below its June 22 high. The triple-leveraged long semiconductor ETF (SOXL) lost 38.7% in a single session. Memory stocks fell hardest, with Sandisk down 22.3% and Micron down 17.5%, and Microsoft, Amazon and Apple, which had rallied the day before, also slipped 1.5% to 3.6%. The selling reached Asia on the morning of November 6 Taipei time: TSMC opened 9.82% lower, and the Korea Composite Index fell as much as 8.78% within five minutes of the open, triggering a circuit breaker.
These two days fell this fast in large part because money that must cut exposure by rule was selling; that selling is not finished, but the positions left to sell keep shrinking, and how much remains depends on whether prices fall further; once it stops, how far chip stocks can rebound depends on whether the data centers planned for 2028 get built on time.
The selling came from three kinds of money: signal-driven funds, hedge funds and retail
The trading itself was unusual. The Technology Select Sector SPDR Fund (XLK) fell about 8%, its worst day since March 2020, the same as chip stocks, on more than three times its 30-day average volume. On the New York Stock Exchange, 2,344 stocks fell and only 416 rose.
The first is systematic money that trades on signals. JPMorgan's equity derivatives team estimates that on November 5, trend-following funds (CTAs) and leveraged ETFs together shed more than $70 billion of equity exposure. Within ninety minutes of the open, net selling of S&P 500 futures had already reached about $11 billion, and CTA positioning flipped to net short. Leveraged ETFs sold more than $60 billion before the close, about 90% of it in semiconductor, Nasdaq 100 and technology products, their second large deleveraging in a week.
The second is hedge funds. Goldman Sachs data show hedge funds net sold about $20 billion of tech stocks in two weeks and erased the AI net long they had built since early 2025 in just five trading days. The cutting started before the election: data from Morgan Stanley's prime brokerage, the unit that finances and executes trades for hedge funds, show that by October 27 the gross exposure (longs plus shorts) of equity long/short funds had fallen about 7.8% from its peak, the largest de-grossing since the data began in 2016. Walleye Capital, a $17 billion multi-strategy fund, lost 5.9% in October, then fired the head of its equity long/short business, cut a large part of its in-house long/short team, and plans to return part of its capital to investors.
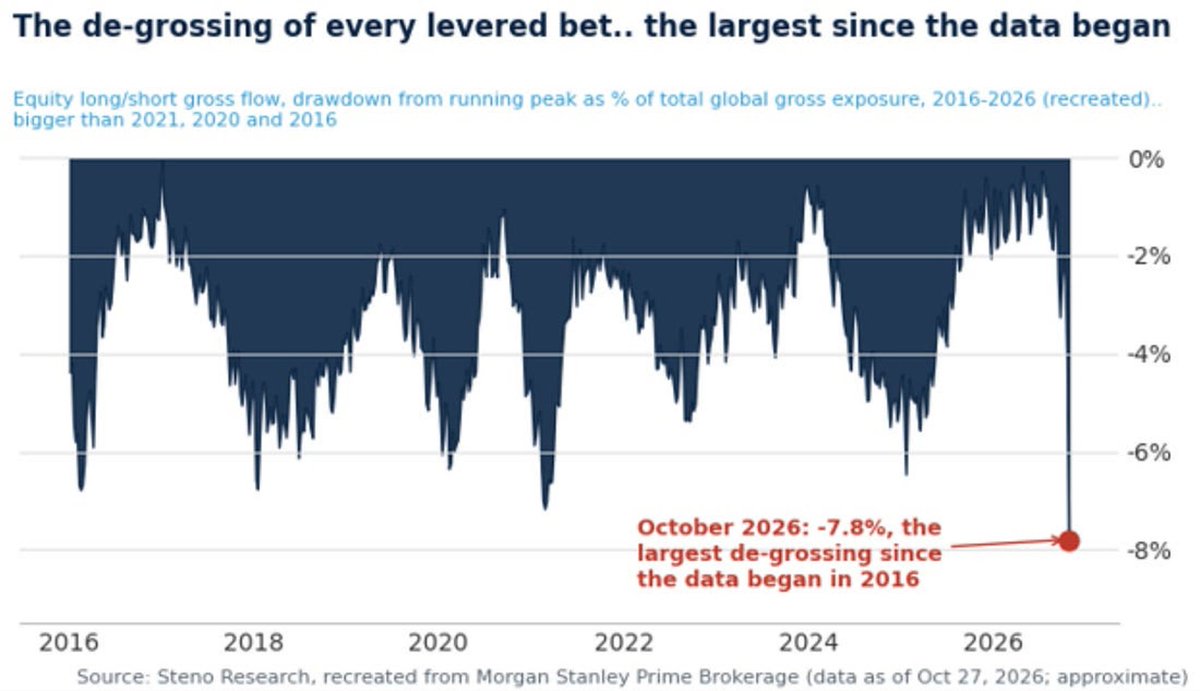
Chart 1 | Equity long/short gross exposure, drawdown from its running peak as a share of global gross exposure: October 2026 reached 7.8%, bigger than 2016, 2020 and 2021 and the largest since the data began in 2016; data as of October 27. (Source: Steno Research, recreated from Morgan Stanley Prime Brokerage, @RyanDetrick)
The third is retail investors. Vanda Research counts about $338 million of single-stock net selling by US retail investors on November 5 (intraday data); since 2020 only March 17 and March 12, 2020 saw more, and retail selling in the first 30 minutes after the open was the largest in months. UBS says the retail-led selling set off risk controls in futures markets and forced deleveraging in leveraged ETFs.
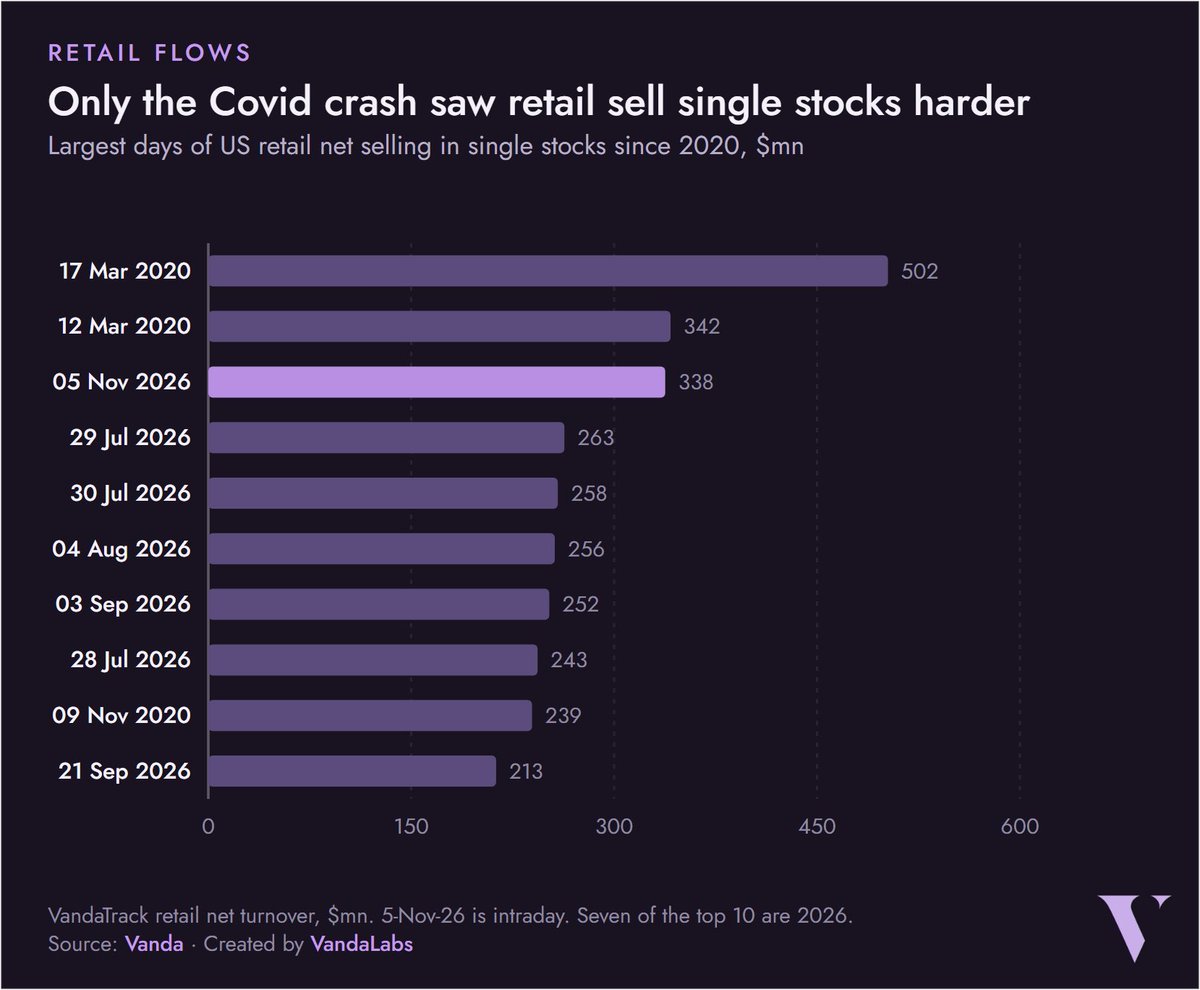
Chart 2 | The ten biggest days of US retail net selling in single stocks since 2020: March 17, 2020 at $502 million, March 12, 2020 at $342 million, and November 5, 2026 third at $338 million; seven of the ten are in 2026. (Source: Vanda, @BrianSozzi)
The three groups cut for different reasons: systematic money adjusts by price and volatility rules, hedge funds reduced exposure after losses grew on crowded AI positions, and retail investors sold in a rush that in turn forced other money to deleverage. Goldman Sachs' basket of the most-shorted tech stocks fell about 10% that day, and Bloomberg's analysis argues that when the most-shorted stocks fall the most, the longs who had been betting against the shorts are being forced to give up. Selling of this kind is driven by positions and prices, which is why it arrives so fast and so concentrated.
The selling has not stopped, but there is less and less left to sell
How much rule-based money sells depends on where prices go. Trend-following funds had already cut hard before the election. Data compiled by Citadel Securities show that by November 3 the z-score of their net US equity positioning (a standardized measure where 0 is normal and more negative means more bearish) had fallen to -3.3, in the lowest 2% of the past year.
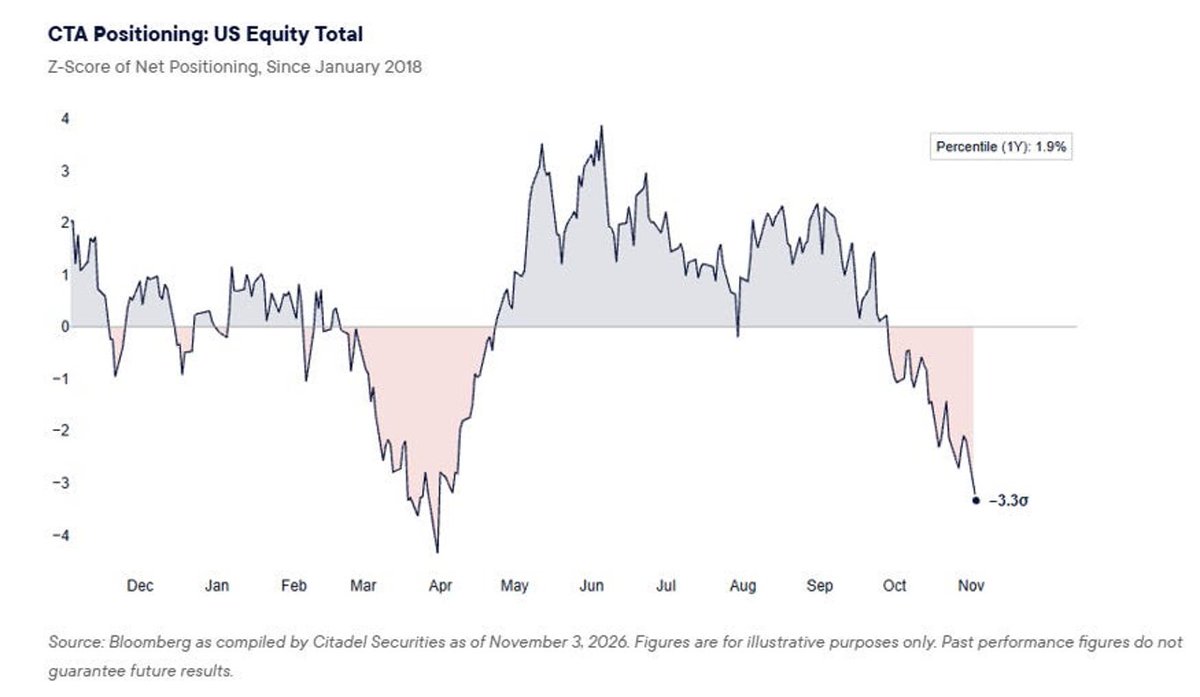
Chart 3 | CTA net US equity positioning, z-score: -3.3 on November 3, in the 1.9th percentile of the past year. (Source: Bloomberg, Citadel Securities, @RyanDetrick)
But it is not finished. JPMorgan estimates that volatility-targeting funds, which automatically cut equity weight as volatility rises, still need to shed about $50 billion over the coming days, taking leverage from a historically high level down to a low one. UBS estimates that systematic funds could sell more than $100 billion on November 6 and warns that this correction may not have bottomed. Goldman Sachs' CTA model estimates that if prices fall further, the S&P 500 faces about $164 billion more of systematic selling.
On the other side, positions have kept shrinking. The passive rebalancing that leveraged ETFs must do for every 1% move has fallen from about $7.5 billion to about $6.5 billion, and JPMorgan notes that with most trend signals already short, the risk to future flows now leans toward buying back. In other words, how much more gets sold depends on whether prices break lower again, but hedge funds, trend funds and leveraged ETFs now hold far smaller long positions than a week ago.
The Asian session on November 6 showed what this kind of selling looks like. The Korea Composite Index fell as much as 8.78% within five minutes of the open and was down 5.68% at around 12:30 pm Taipei time; SK hynix opened 13.84% lower and was later down 8.86%; Samsung Electronics fell as much as 11.07% and was later down 5.91%; the Nikkei 225 fell as much as 7.09% and was later down 5.94%; Advantest fell as much as 16.38% and was later down only 2.92%; TSMC opened 9.82% lower and was later down 4.46%. Concentrated selling hit in the morning session and the losses then narrowed, but the Korea Composite Index, down only 3.90% at one point around noon Seoul time, slipped again afterward, so the selling has not fully stopped.
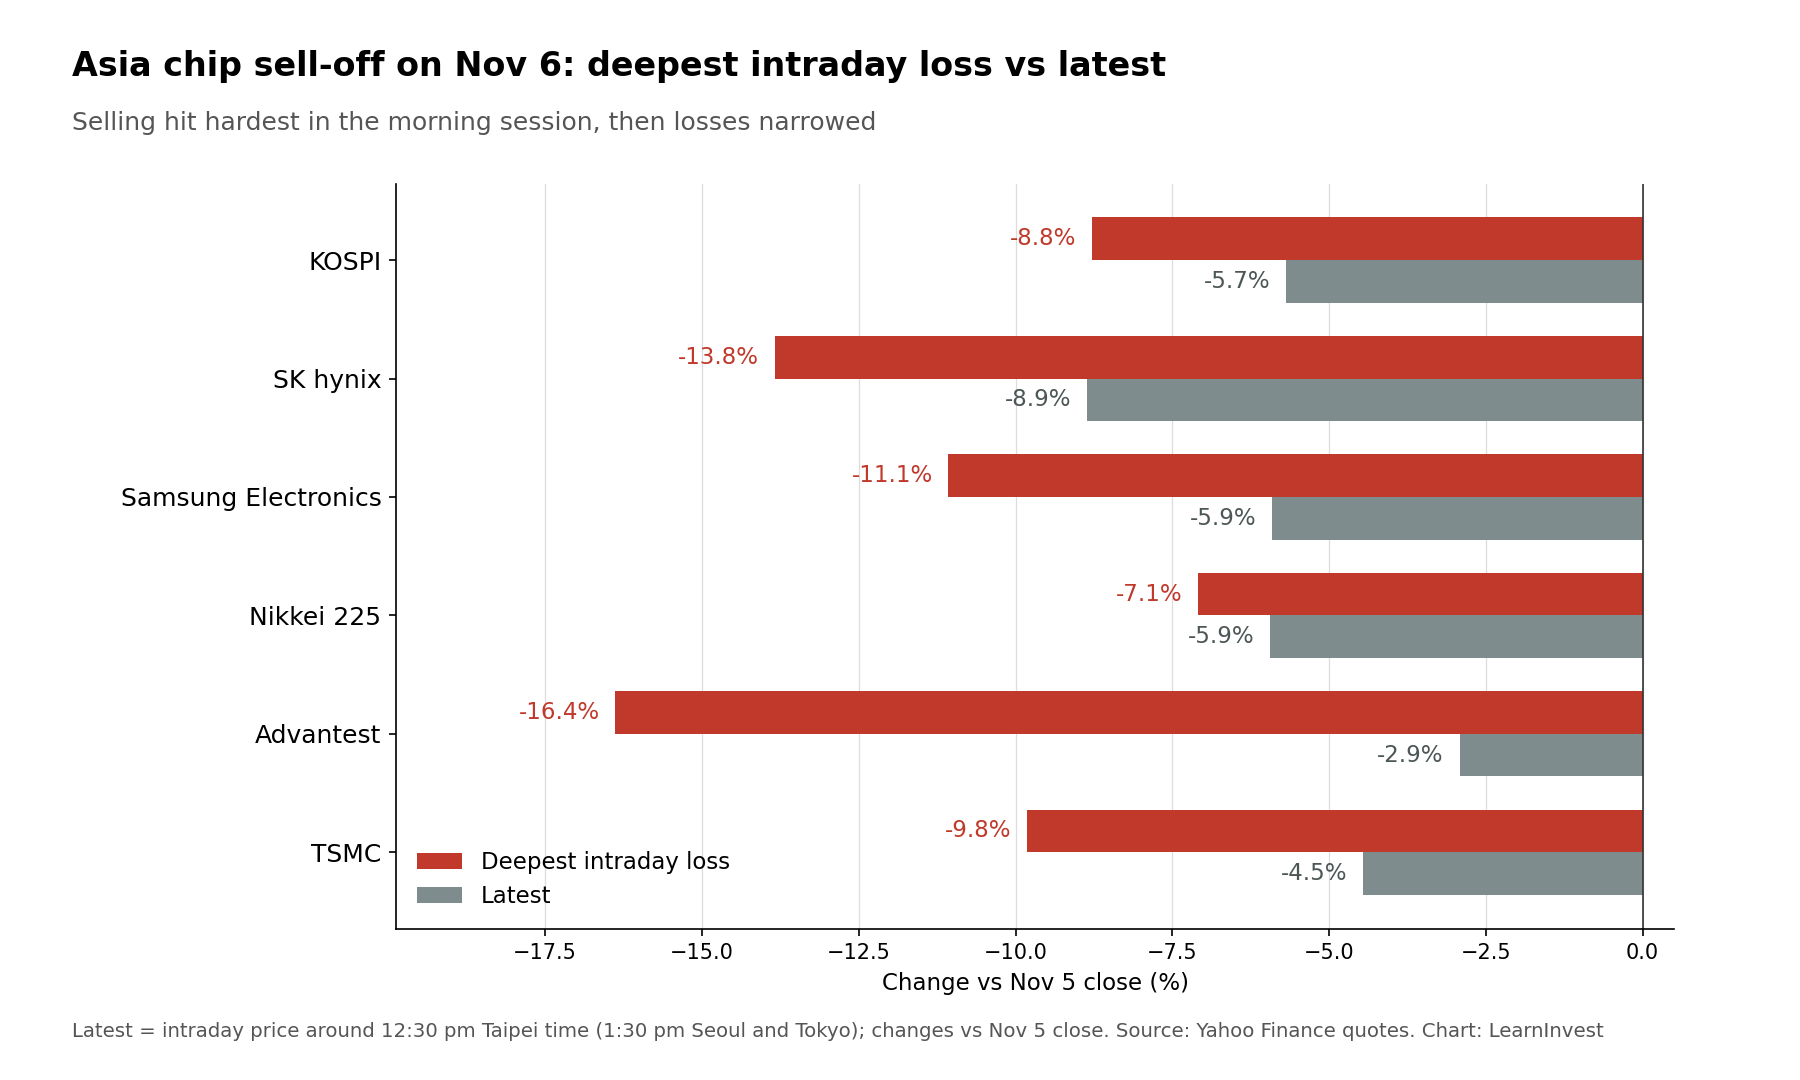
Chart 4 | Major Asian indices and chip stocks on November 6: deepest intraday loss, and the loss at around 12:30 pm Taipei time (both versus the November 5 close). (Source: Yahoo Finance quotes, compiled by LearnInvest)
Buyers are not coming back because nobody can price 2028 orders
The selling will stop, but buyers have not returned. Goldman Sachs trader John Flood described November 5 as a day when no buyers had yet stepped in. The reason is the timetable.
Wells Fargo notes that Texas data center permits have been frozen by executive order since August, and that after the new governor takes office, the condition for lifting the freeze changes from finishing an audit to waiting for the state legislature to act; the Texas legislature convenes on January 12 and adjourns on May 31. Nomura says most data centers due to come online in 2027 are already under construction, so the projects most affected are those planned for 2028; a Goldman Sachs analyst adds that some Texas capacity scheduled for 2027 could also slip into 2028. Chip and memory makers' 2027 orders are still largely backed by projects under construction, while their 2028 orders have become hard to estimate.
Memory is the most sensitive to this. JPMorgan's August estimate was that DRAM supply would fall short of demand by 3% in 2026 and 7% in 2027, and only roughly balance in 2028.
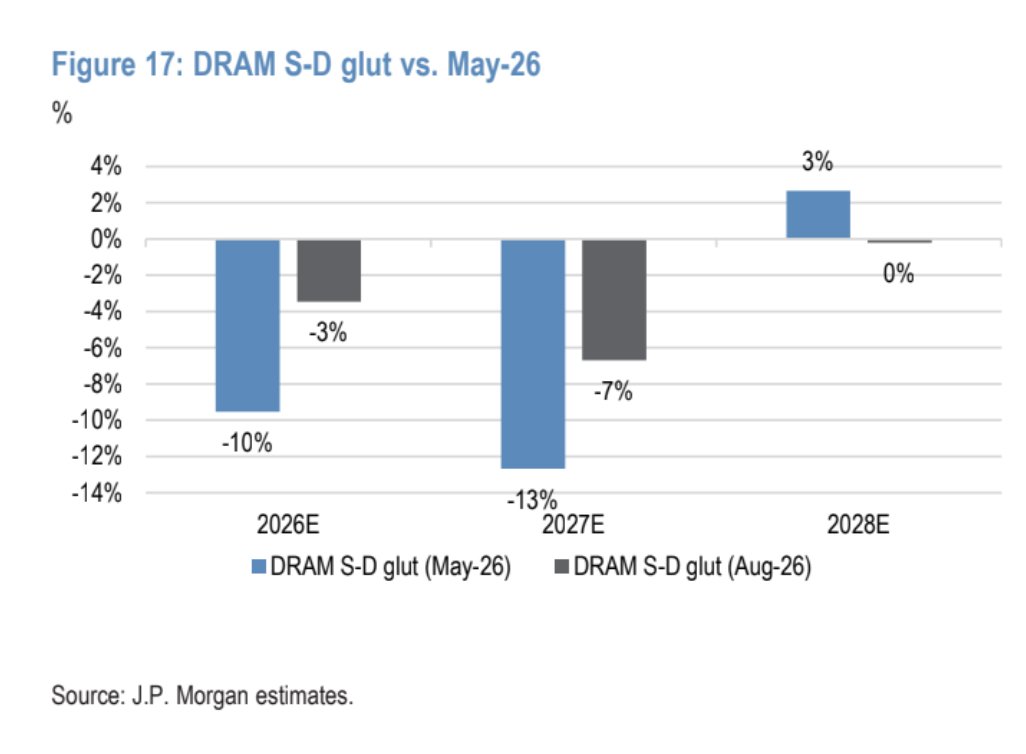
Chart 5 | JPMorgan's DRAM supply-demand gap (negative means a shortage): the August version expects -3% in 2026, -7% in 2027 and 0% in 2028; the May version was -10%, -13% and +3%. (Source: JPMorgan, @pequityresearch)
Goldman Sachs' trading desk lays out the transmission: if land, power and racks for 2028 lag because of permitting, chip capacity becomes relatively excessive, and memory prices that were propped up by the supply gap lose their support. The optimistic memory forecasts rest on data centers being deployed on schedule; if 2028 projects slip, that year could tip from rough balance into surplus.
After meeting investors in Hong Kong, Bank of America found that most had turned bearish on memory. Citrini Research analyst Jukan relayed the view of a veteran Shanghai investor: even at 3 times 2027 earnings, memory stocks are not cheap, because in past cycles, once prices fell more than 60% from the peak, customers walked away from prepayments and stopped honoring long-term agreements. Bank of America's own view is more measured: it thinks it is too early to expect cuts to US AI data center chip orders, because the big cloud companies are actively signing long-term agreements and data centers under construction will most likely be finished on schedule.
Cheap, in other words, does not bring buyers. Citadel Securities data show that as of November 3, the forward P/E of S&P 500 semiconductor stocks was 13.8 times, only 0.75 times the S&P 500's 18.3 times, the widest discount since 2018.
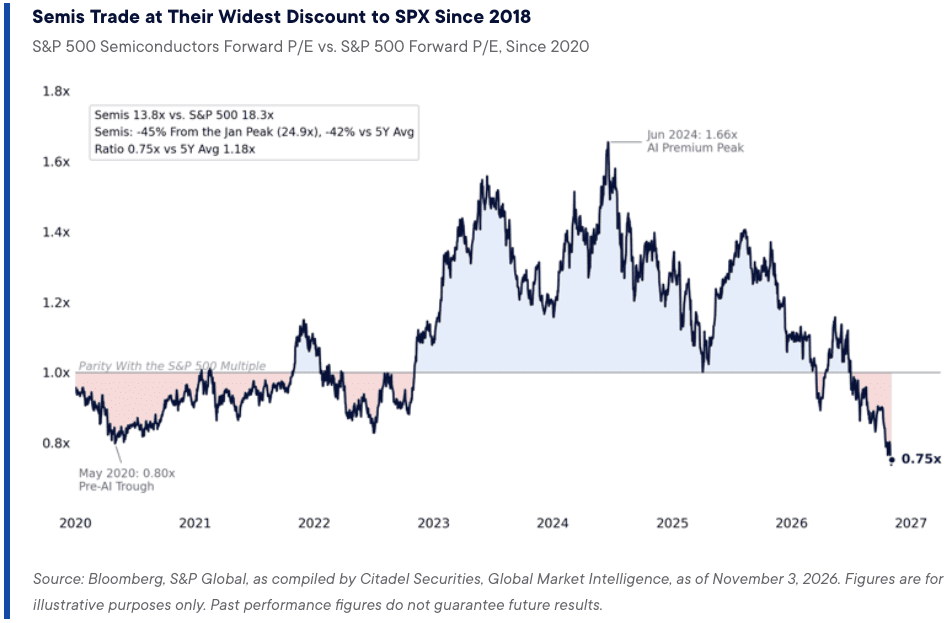
Chart 6 | Forward P/E of S&P 500 semiconductors relative to the S&P 500: 0.75 times on November 3 versus a five-year average of 1.18 times; semiconductors at 13.8 times, the S&P 500 at 18.3 times. (Source: Bloomberg, S&P Global, Citadel Securities, @Barchart)
Timing changes are already showing up at individual companies. Compute provider IREN said more than $4 billion of annualized revenue that was expected to land in 2026 has been pushed to January at the earliest; co-CEO Daniel Roberts confirmed that the customer who requested the change is Microsoft, which asked for upgraded network equipment to serve the latest models, together with supplier timing, and IREN said the revenue is already contracted and funded.
The revenue has not disappeared, only moved later; Roberts also said that over the past few weeks the questions from capital markets have moved from how big a contract is to whether it can be delivered, financed and run at a profit. Bloomberg also reports that Microsoft is tightening oversight of some data center projects at Nebius, IREN and Nscale and exiting those it considers riskier.
The index's history does not carry over to chip stocks
The VIX volatility index rose from 16.61 to 28.18 on November 5, a 70% jump and the third-largest one-day increase since 1990. Charlie Bilello of Creative Planning shows that after the 20 biggest one-day VIX spikes, the S&P 500 rose 17% on average over the following year, above the 12% of all other periods.
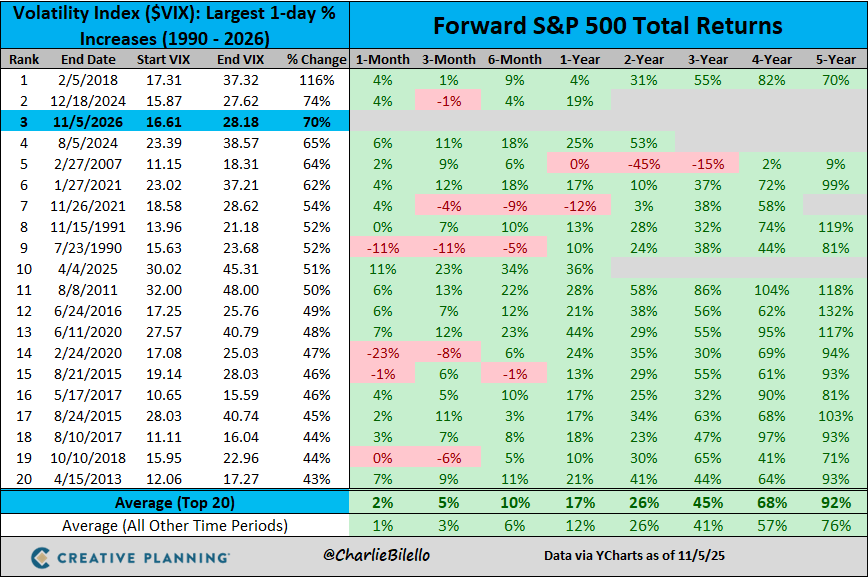
Chart 7 | The 20 largest one-day VIX increases since 1990 and the S&P 500's total return afterward: November 5, 2026 ranks third; the average one-year return after the top 20 is 17%. (Source: YCharts, Creative Planning, @charliebilello)
But that is the S&P 500 average, not chip stocks. Initial jobless claims for the week ended October 31, released on November 5, were only 189,000, the lowest since July, and layoffs remain few; once the mechanical selling stops, the decline may slow. For chip stocks to get back to their pre-election levels, though, someone has to be willing to pay for 2028 orders; if the Texas freeze lasts until the legislature adjourns, it would not lift before the end of May next year.
CoreWeave reports earnings on November 10 and Nebius on November 12. How they describe delivery and financing timelines for 2027 and 2028 will be the next post-election answer from the compute providers themselves.
Sources: JPMorgan, Goldman Sachs, UBS, Wells Fargo, Nomura, Bank of America, Vanda Research, Citadel Securities, CNBC, Bloomberg, Yahoo Finance and market quotes (images from Steno Research, Morgan Stanley, @RyanDetrick, Vanda, @BrianSozzi, Citadel Securities, LearnInvest, JPMorgan, @pequityresearch, @Barchart, YCharts, Creative Planning, @charliebilello)