【Daily · 2026-11-06】
美國期中選舉後的第二個交易日,AI股從「分成兩半」變成一起跌。11月5日費城半導體指數跌12.25%,是2020年3月疫情崩盤以來最大的單日跌幅,收在9,011點,比6月22日的高點低了38.4%;三倍做多半導體ETF(SOXL)一天跌了38.7%。記憶體股跌得最深,Sandisk跌22.3%、美光跌17.5%;前一天還在漲的微軟、亞馬遜、蘋果,這次也跌了1.5%到3.6%。賣壓在台北時間6日早上延伸到亞洲:台積電開盤跌9.82%,韓國綜合指數開盤後五分鐘內最深跌8.78%、觸發熔斷。
這兩天跌得這麼快,很大一部分是照規則必須減碼的資金在賣;這類賣盤還沒賣完,但能賣的部位愈減愈少,剩下多少取決於還會不會再跌;等它停下來,股價能彈多高,要看2028年的資料中心能不能按時蓋出來。
賣壓來自三種資金:照訊號交易的、避險基金和散戶
這一天的成交很不尋常。科技類股ETF(XLK)跌約8%,和半導體類股一樣是2020年3月以來最差的一天,成交量是30日均量的三倍多;紐約證交所下跌2,344家、上漲只有416家。
第一種是照訊號交易的系統性資金。摩根大通股票衍生品團隊估計,11月5日追蹤價格趨勢的基金(CTA)和槓桿ETF,合計拋掉超過700億美元的股票曝險。開盤後一個半小時,標普500期貨的淨賣盤就達到約110億美元,CTA的部位轉為淨空;槓桿ETF在收盤前賣掉逾600億美元,九成集中在半導體、那斯達克100和科技類ETF,是一週內第二次大規模減碼。
第二種是避險基金。高盛的數據顯示,避險基金兩週內淨賣約200億美元科技股,只用五個交易日,就把2025年初以來累積的AI股淨多頭部位清掉。減碼在選舉前就開始了:摩根士丹利替避險基金提供融資與交易服務的主經紀商部門資料顯示,到10月27日,股票多空基金的總曝險(多頭加空頭部位)從高點回落約7.8%,是2016年有資料以來最大的一次。規模170億美元的多策略基金Walleye Capital 10月虧損5.9%,隨後解雇股票多空主管、裁減相當部分的內部多空團隊,並將返還部分資金給投資人。
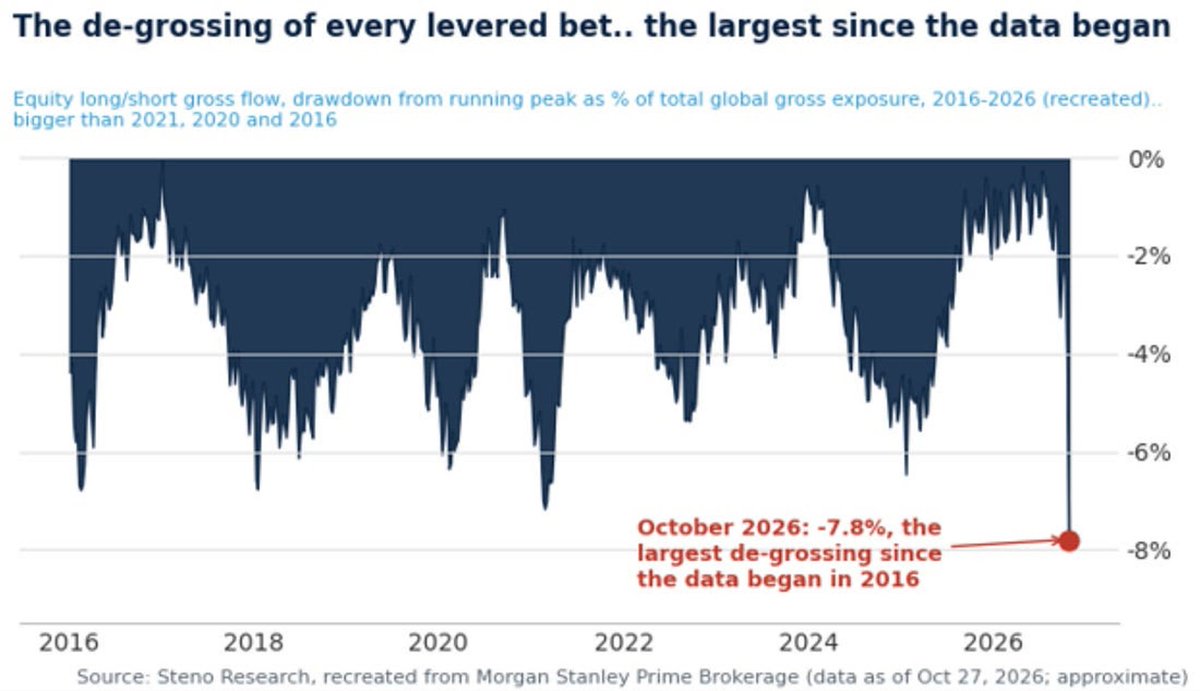
圖 1|股票多空基金總曝險從高點的回落幅度(占全球總曝險比例):2026年10月回落7.8%,超過2016、2020和2021年,是2016年有資料以來最大;資料截至10月27日。(資料來源:Steno Research整理摩根士丹利主經紀商資料,@RyanDetrick)
第三種是散戶。Vanda Research統計,11月5日散戶單日淨賣個股約3.38億美元(盤中數據),2020年以來只有2020年3月17日和3月12日兩天賣得更多,開盤後30分鐘的散戶賣盤是近幾個月最大。瑞銀認為,散戶主導的拋售觸發了期貨市場的風險控制與槓桿ETF的強制減碼。
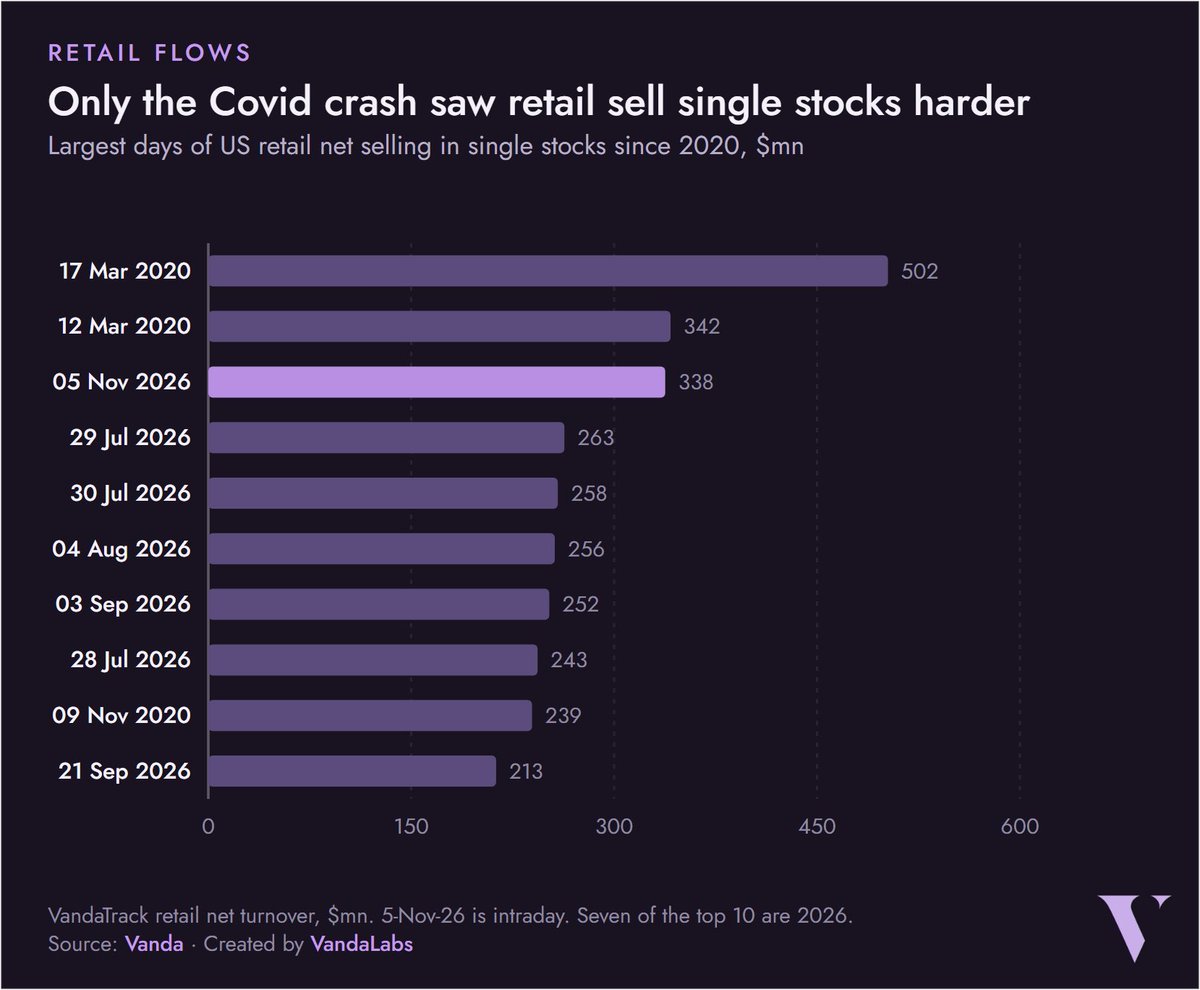
圖 2|2020年以來美國散戶單日淨賣個股最多的十天:2020年3月17日5.02億美元、3月12日3.42億美元,2026年11月5日3.38億美元排第三;前十名有七天在2026年。(資料來源:Vanda,@BrianSozzi)
三種資金減碼的原因不同:系統性資金照價格和波動的規則調整,避險基金是在擁擠的AI部位虧損擴大後降低曝險,散戶則是集中拋售,又觸發了其他資金的強制減碼。高盛的科技類股最受放空籃子當天重挫約10%,彭博的分析認為,當跌最多的正好是被放空最多的股票,代表空方判斷正確,原本和空方對作的多頭正在被迫認輸。這類賣壓看的是部位和價格,所以來得又快又集中。
這類賣盤還沒停,但能賣的部位愈來愈少
照規則減碼的資金,賣多少取決於價格往哪走。追蹤趨勢的基金在選前就大幅減碼,Citadel Securities整理的數據顯示,到11月3日,這類基金美股淨部位的Z分數(把部位高低標準化,0代表平常水準,負得愈多代表愈偏空)已降到-3.3,落在過去一年最低的2%。
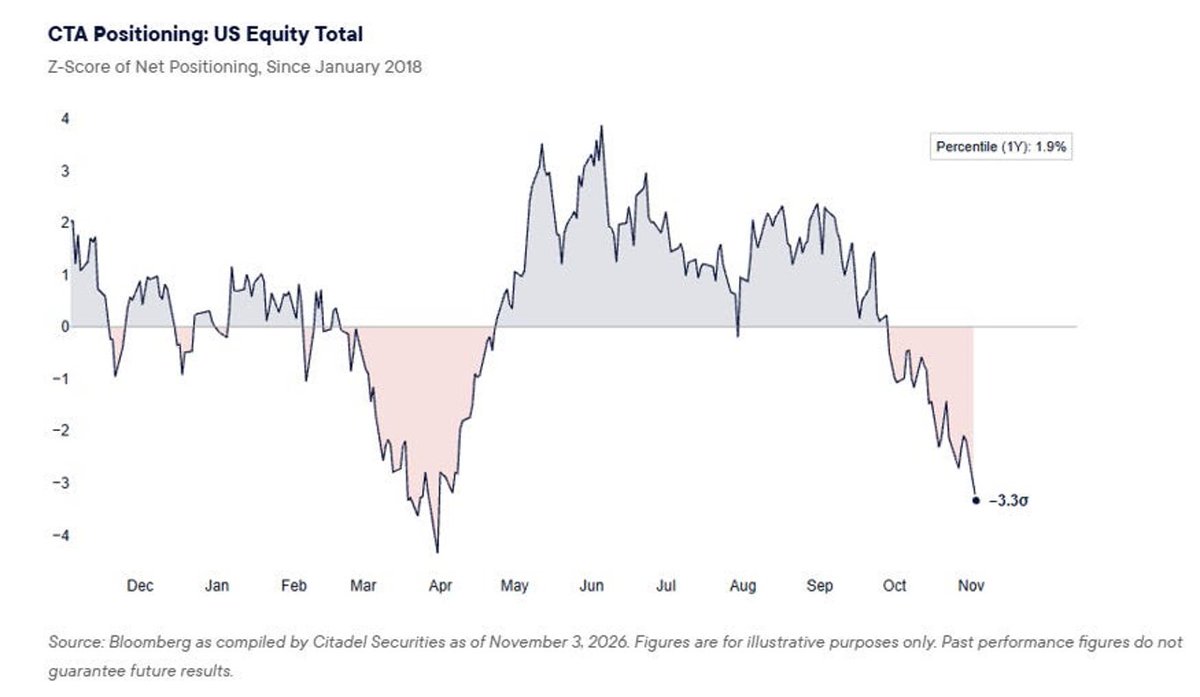
圖 3|追蹤趨勢基金(CTA)的美股淨部位Z分數:11月3日降到-3.3,在過去一年的百分位只有1.9%。(資料來源:彭博、Citadel Securities,@RyanDetrick)
但還沒賣完。摩根大通估計,波動率目標基金會隨波動上升自動降低股票比重,未來幾天還要再減約500億美元,把槓桿從歷史上偏高的水準降到偏低的水準;瑞銀估計11月6日系統性基金的賣盤可能超過1,000億美元,並警告這輪調整可能還沒見底;高盛的CTA模型則估算,若股價再走低,標普500還會面臨約1,640億美元的系統性賣壓。
另一面,部位已經一路減少。槓桿ETF每波動1%要再平衡的被動賣盤,已從約75億美元降到約65億美元;摩根大通也指出,多數趨勢訊號已經轉空,後續資金流向的風險反而偏向買回。也就是說,接下來還會賣多少,取決於股價會不會再往下破,但避險基金、趨勢基金和槓桿ETF手上的多頭部位,已經比一週前少很多。
台北時間6日的亞洲盤,看得到這種賣壓的形狀。韓國綜合指數開盤後五分鐘內最深跌8.78%,到台北時間12時30分左右跌5.68%;SK海力士開盤跌13.84%,之後跌8.86%;三星電子最深跌11.07%,之後跌5.91%;日經225最深跌7.09%,之後跌5.94%;愛德萬測試最深跌16.38%,之後只跌2.92%;台積電開盤跌9.82%,之後跌4.46%。早盤先被集中拋售,之後跌幅縮小;不過韓國綜合指數在韓國時間中午一度只跌3.90%,之後又再走低,賣壓還沒有完全停下。
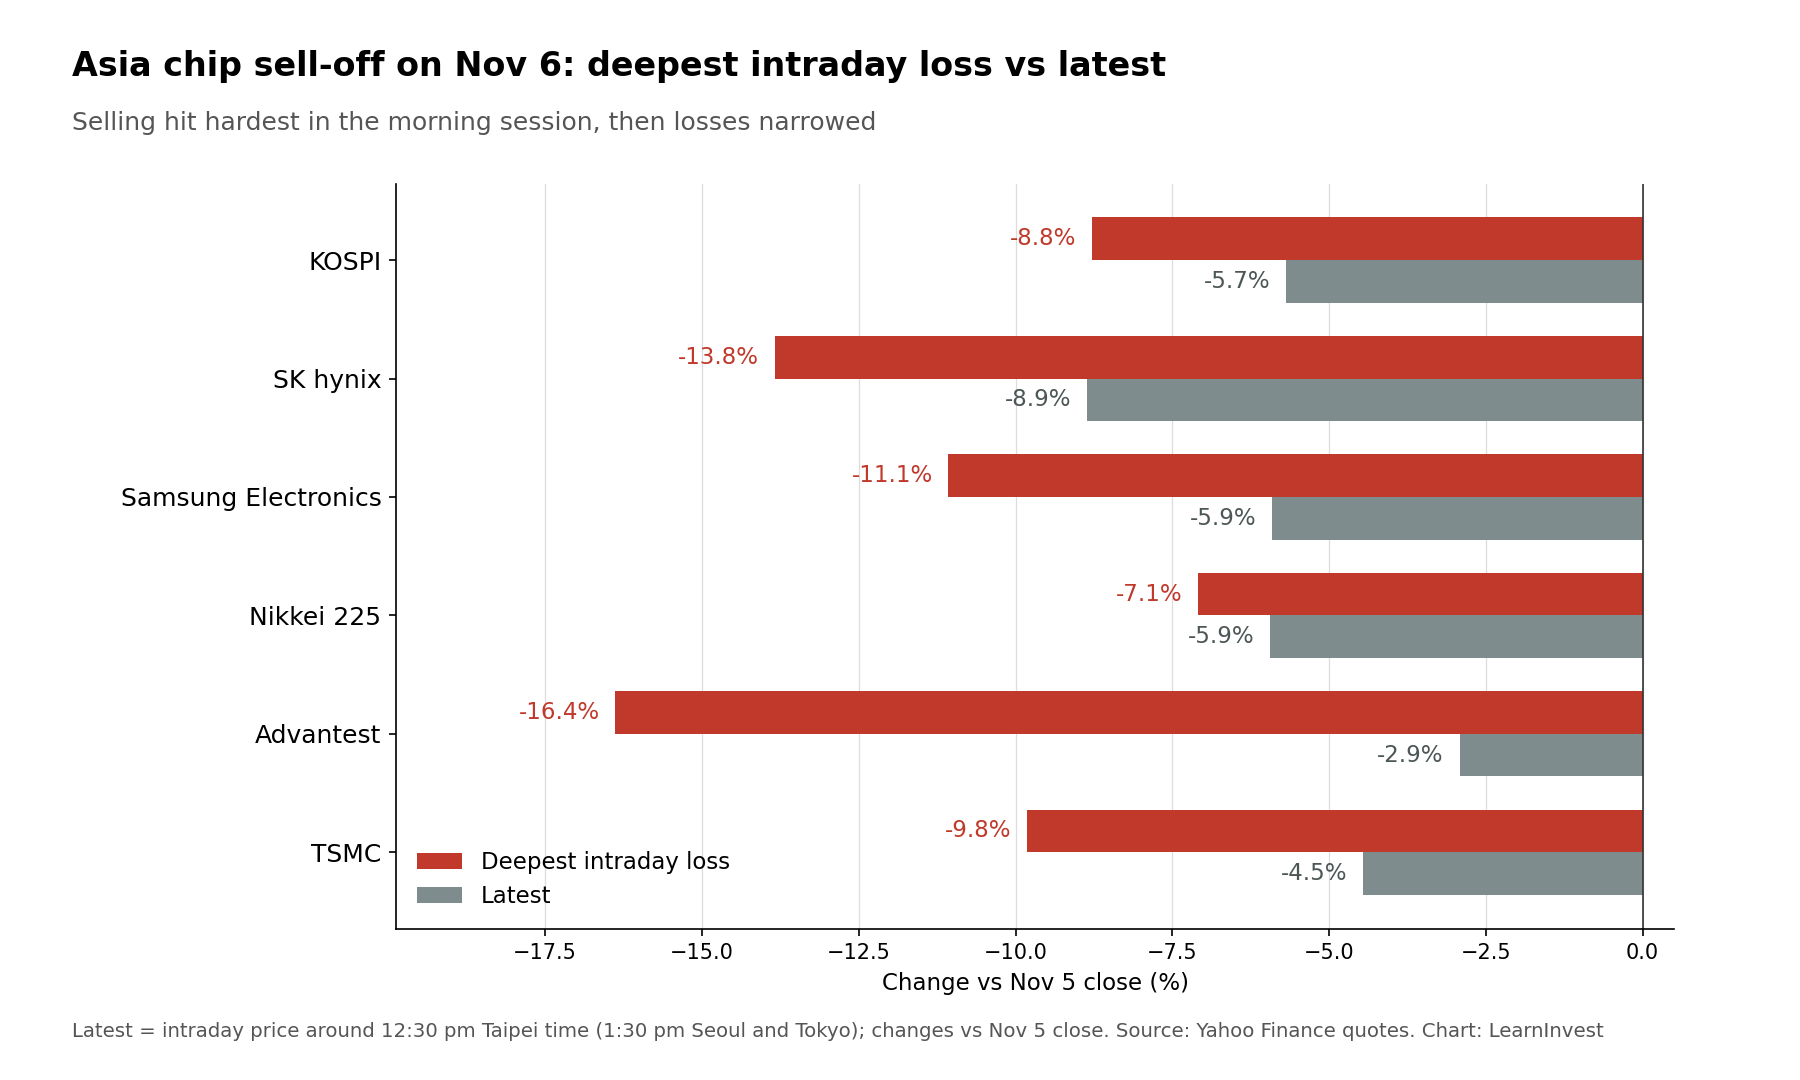
圖 4|11月6日亞洲主要指數與晶片股:盤中最低跌幅,以及台北時間12時30分左右的跌幅(皆相對11月5日收盤)。(資料來源:雅虎財經報價,LearnInvest整理)
買盤不回來,是因為2028年的訂單沒人算得出來
賣盤會停,買盤卻沒有回來。高盛交易員弗勒德(John Flood)形容11月5日的情況是「目前尚未看到買家入場接盤」。原因在時間表。
富國銀行指出,德州的資料中心許可審查自8月起已被行政命令凍結,新州長上任後,解凍條件從完成審計改成等州議會立法;德州議會明年1月12日開議、5月31日休會。野村認為,2027年要上線的資料中心多數已經動工,受影響的主要是2028年的案子;高盛分析師則提醒,德州部分原定2027年交付的容量也可能延到2028年。晶片和記憶體廠2027年的訂單大致還有工地支撐,2028年的訂單則變得難以估算。
記憶體對這件事最敏感。摩根大通8月的預估是,DRAM在2026年供給短缺3%、2027年短缺7%,到2028年才大致平衡。
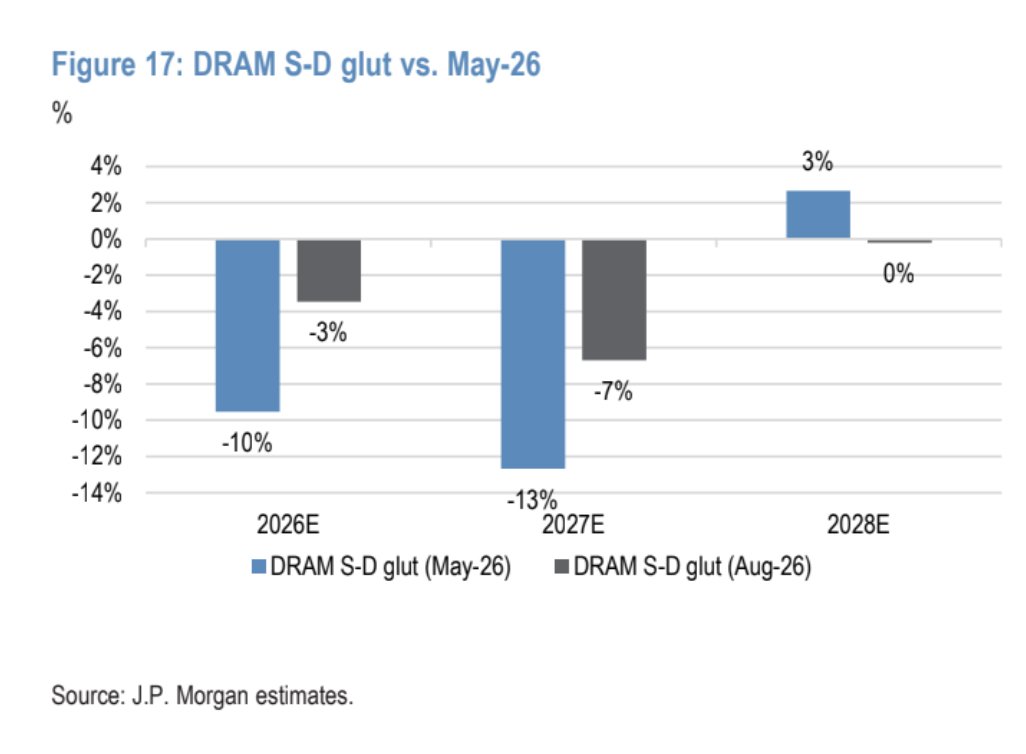
圖 5|摩根大通估計的DRAM供需缺口(負值代表供給不足):8月版預估2026年-3%、2027年-7%、2028年0%;5月版為-10%、-13%與+3%。(資料來源:摩根大通,@pequityresearch)
高盛交易台給出的傳導是:如果2028年的土地、電力和機櫃因為許可審查跟不上,晶片產能就會相對過剩,記憶體靠供需缺口撐起來的價格也會失去支撐。記憶體的樂觀預估建立在資料中心照進度部署之上,2028年的案子若延後,那一年可能從大致平衡轉為供給過剩。
美銀在香港和投資人交流後發現,多數人已經轉為看空記憶體;Citrini Research分析師Jukan轉述一位上海資深投資人的看法:就算記憶體股以2027年獲利計算本益比只有3倍也不算便宜,因為過去價格從高點跌超過60%時,客戶就會放棄預付款、不再履行長約。美銀自己的看法比較保留,認為現在就預期美國AI資料中心晶片訂單削減還太早,因為雲端巨頭正主動簽長約,在建的資料中心很可能會照計畫完工。
所以便宜不等於有人買。Citadel Securities的數據顯示,到11月3日,標普500半導體類股的預估本益比是13.8倍,只有標普500(18.3倍)的0.75倍,是2018年以來最大的折價。
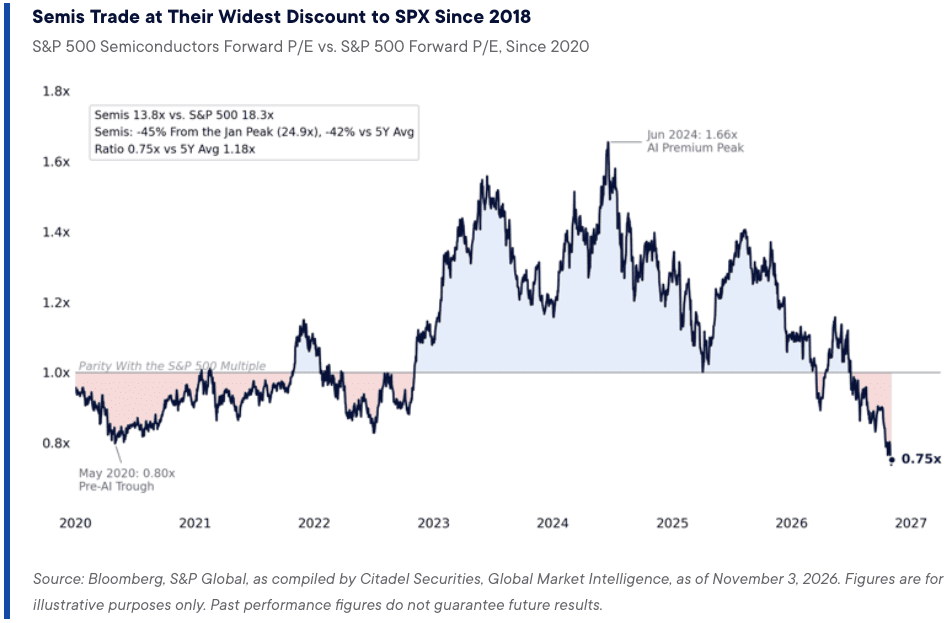
圖 6|標普500半導體類股預估本益比相對標普500的倍數:11月3日為0.75倍,五年平均1.18倍;半導體13.8倍、標普500為18.3倍。(資料來源:彭博、S&P Global、Citadel Securities,@Barchart)
時程變動也已經出現在個別公司的帳上。算力租賃商IREN公布,原預計2026年入帳、逾40億美元的年化營收,延到最早明年1月;共同執行長羅伯茲(Daniel Roberts)證實,提出變更的客戶是微軟,原因是微軟要求升級網路設備以支援新一代模型,加上供應商交期;IREN表示這筆營收已經簽約、資金也已到位。
營收沒有消失,只是往後延;羅伯茲也說,資本市場過去幾週問的,已經從合約有多大,變成能不能交付、能不能取得資金、能不能賺錢。彭博也報導,微軟正加強監督Nebius、IREN與Nscale的部分資料中心專案,並退出它認為風險較高的案子。
指數的經驗,不能直接套到半導體
VIX恐慌指數11月5日從16.61升到28.18,漲70%,是1990年以來第三大的單日漲幅。Creative Planning的比利洛(Charlie Bilello)整理,前20次VIX單日暴漲之後,標普500一年後平均上漲17%,高於其他時間的12%。
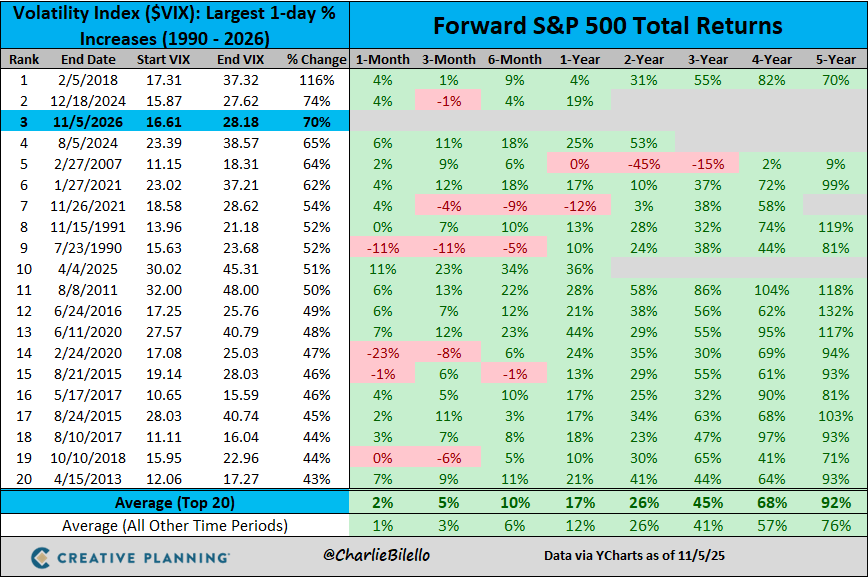
圖 7|1990年以來VIX單日漲幅最大的20天,以及之後標普500的總報酬:2026年11月5日排第三;前20次的一年後平均報酬17%。(資料來源:YCharts、Creative Planning,@charliebilello)
但這是標普500的平均,不是半導體。11月5日公布、截至10月31日當週的初領失業救濟金只有18.9萬人,是7月以來最低,裁員仍少;等機械性賣盤停下來,跌勢可能放慢。可是半導體要回到選前的價位,需要有人願意替2028年的訂單出價;德州的凍結若延續到州議會休會,要到明年5月底才可能解除。
CoreWeave將在11月10日公布財報、Nebius在11月12日公布,它們怎麼說明2027年和2028年的交付與融資時程,會是選後下一批來自算力業者本身的答案。
資料來源:摩根大通、高盛、瑞銀、富國銀行、野村、美國銀行、Vanda Research、Citadel Securities、CNBC、彭博、雅虎財經與市場報價(圖片來自Steno Research、摩根士丹利、@RyanDetrick、Vanda、@BrianSozzi、Citadel Securities、LearnInvest、摩根大通、@pequityresearch、@Barchart、YCharts、Creative Planning、@charliebilello)
Daily · 2026-11-06
On the second trading day after the US midterms, AI stocks went from splitting in two to falling together. On November 5 the Philadelphia Semiconductor Index fell 12.25%, its biggest one-day drop since the Covid crash of March 2020, closing at 9,011, 38.4% below its June 22 high. The triple-leveraged long semiconductor ETF (SOXL) lost 38.7% in a single session. Memory stocks fell hardest, with Sandisk down 22.3% and Micron down 17.5%, and Microsoft, Amazon and Apple, which had rallied the day before, also slipped 1.5% to 3.6%. The selling reached Asia on the morning of November 6 Taipei time: TSMC opened 9.82% lower, and the Korea Composite Index fell as much as 8.78% within five minutes of the open, triggering a circuit breaker.
These two days fell this fast in large part because money that must cut exposure by rule was selling; that selling is not finished, but the positions left to sell keep shrinking, and how much remains depends on whether prices fall further; once it stops, how far chip stocks can rebound depends on whether the data centers planned for 2028 get built on time.
The selling came from three kinds of money: signal-driven funds, hedge funds and retail
The trading itself was unusual. The Technology Select Sector SPDR Fund (XLK) fell about 8%, its worst day since March 2020, the same as chip stocks, on more than three times its 30-day average volume. On the New York Stock Exchange, 2,344 stocks fell and only 416 rose.
The first is systematic money that trades on signals. JPMorgan's equity derivatives team estimates that on November 5, trend-following funds (CTAs) and leveraged ETFs together shed more than $70 billion of equity exposure. Within ninety minutes of the open, net selling of S&P 500 futures had already reached about $11 billion, and CTA positioning flipped to net short. Leveraged ETFs sold more than $60 billion before the close, about 90% of it in semiconductor, Nasdaq 100 and technology products, their second large deleveraging in a week.
The second is hedge funds. Goldman Sachs data show hedge funds net sold about $20 billion of tech stocks in two weeks and erased the AI net long they had built since early 2025 in just five trading days. The cutting started before the election: data from Morgan Stanley's prime brokerage, the unit that finances and executes trades for hedge funds, show that by October 27 the gross exposure (longs plus shorts) of equity long/short funds had fallen about 7.8% from its peak, the largest de-grossing since the data began in 2016. Walleye Capital, a $17 billion multi-strategy fund, lost 5.9% in October, then fired the head of its equity long/short business, cut a large part of its in-house long/short team, and plans to return part of its capital to investors.
Chart 1 | Equity long/short gross exposure, drawdown from its running peak as a share of global gross exposure: October 2026 reached 7.8%, bigger than 2016, 2020 and 2021 and the largest since the data began in 2016; data as of October 27. (Source: Steno Research, recreated from Morgan Stanley Prime Brokerage, @RyanDetrick)
The third is retail investors. Vanda Research counts about $338 million of single-stock net selling by US retail investors on November 5 (intraday data); since 2020 only March 17 and March 12, 2020 saw more, and retail selling in the first 30 minutes after the open was the largest in months. UBS says the retail-led selling set off risk controls in futures markets and forced deleveraging in leveraged ETFs.
Chart 2 | The ten biggest days of US retail net selling in single stocks since 2020: March 17, 2020 at $502 million, March 12, 2020 at $342 million, and November 5, 2026 third at $338 million; seven of the ten are in 2026. (Source: Vanda, @BrianSozzi)
The three groups cut for different reasons: systematic money adjusts by price and volatility rules, hedge funds reduced exposure after losses grew on crowded AI positions, and retail investors sold in a rush that in turn forced other money to deleverage. Goldman Sachs' basket of the most-shorted tech stocks fell about 10% that day, and Bloomberg's analysis argues that when the most-shorted stocks fall the most, the longs who had been betting against the shorts are being forced to give up. Selling of this kind is driven by positions and prices, which is why it arrives so fast and so concentrated.
The selling has not stopped, but there is less and less left to sell
How much rule-based money sells depends on where prices go. Trend-following funds had already cut hard before the election. Data compiled by Citadel Securities show that by November 3 the z-score of their net US equity positioning (a standardized measure where 0 is normal and more negative means more bearish) had fallen to -3.3, in the lowest 2% of the past year.
Chart 3 | CTA net US equity positioning, z-score: -3.3 on November 3, in the 1.9th percentile of the past year. (Source: Bloomberg, Citadel Securities, @RyanDetrick)
But it is not finished. JPMorgan estimates that volatility-targeting funds, which automatically cut equity weight as volatility rises, still need to shed about $50 billion over the coming days, taking leverage from a historically high level down to a low one. UBS estimates that systematic funds could sell more than $100 billion on November 6 and warns that this correction may not have bottomed. Goldman Sachs' CTA model estimates that if prices fall further, the S&P 500 faces about $164 billion more of systematic selling.
On the other side, positions have kept shrinking. The passive rebalancing that leveraged ETFs must do for every 1% move has fallen from about $7.5 billion to about $6.5 billion, and JPMorgan notes that with most trend signals already short, the risk to future flows now leans toward buying back. In other words, how much more gets sold depends on whether prices break lower again, but hedge funds, trend funds and leveraged ETFs now hold far smaller long positions than a week ago.
The Asian session on November 6 showed what this kind of selling looks like. The Korea Composite Index fell as much as 8.78% within five minutes of the open and was down 5.68% at around 12:30 pm Taipei time; SK hynix opened 13.84% lower and was later down 8.86%; Samsung Electronics fell as much as 11.07% and was later down 5.91%; the Nikkei 225 fell as much as 7.09% and was later down 5.94%; Advantest fell as much as 16.38% and was later down only 2.92%; TSMC opened 9.82% lower and was later down 4.46%. Concentrated selling hit in the morning session and the losses then narrowed, but the Korea Composite Index, down only 3.90% at one point around noon Seoul time, slipped again afterward, so the selling has not fully stopped.
Chart 4 | Major Asian indices and chip stocks on November 6: deepest intraday loss, and the loss at around 12:30 pm Taipei time (both versus the November 5 close). (Source: Yahoo Finance quotes, compiled by LearnInvest)
Buyers are not coming back because nobody can price 2028 orders
The selling will stop, but buyers have not returned. Goldman Sachs trader John Flood described November 5 as a day when no buyers had yet stepped in. The reason is the timetable.
Wells Fargo notes that Texas data center permits have been frozen by executive order since August, and that after the new governor takes office, the condition for lifting the freeze changes from finishing an audit to waiting for the state legislature to act; the Texas legislature convenes on January 12 and adjourns on May 31. Nomura says most data centers due to come online in 2027 are already under construction, so the projects most affected are those planned for 2028; a Goldman Sachs analyst adds that some Texas capacity scheduled for 2027 could also slip into 2028. Chip and memory makers' 2027 orders are still largely backed by projects under construction, while their 2028 orders have become hard to estimate.
Memory is the most sensitive to this. JPMorgan's August estimate was that DRAM supply would fall short of demand by 3% in 2026 and 7% in 2027, and only roughly balance in 2028.
Chart 5 | JPMorgan's DRAM supply-demand gap (negative means a shortage): the August version expects -3% in 2026, -7% in 2027 and 0% in 2028; the May version was -10%, -13% and +3%. (Source: JPMorgan, @pequityresearch)
Goldman Sachs' trading desk lays out the transmission: if land, power and racks for 2028 lag because of permitting, chip capacity becomes relatively excessive, and memory prices that were propped up by the supply gap lose their support. The optimistic memory forecasts rest on data centers being deployed on schedule; if 2028 projects slip, that year could tip from rough balance into surplus.
After meeting investors in Hong Kong, Bank of America found that most had turned bearish on memory. Citrini Research analyst Jukan relayed the view of a veteran Shanghai investor: even at 3 times 2027 earnings, memory stocks are not cheap, because in past cycles, once prices fell more than 60% from the peak, customers walked away from prepayments and stopped honoring long-term agreements. Bank of America's own view is more measured: it thinks it is too early to expect cuts to US AI data center chip orders, because the big cloud companies are actively signing long-term agreements and data centers under construction will most likely be finished on schedule.
Cheap, in other words, does not bring buyers. Citadel Securities data show that as of November 3, the forward P/E of S&P 500 semiconductor stocks was 13.8 times, only 0.75 times the S&P 500's 18.3 times, the widest discount since 2018.
Chart 6 | Forward P/E of S&P 500 semiconductors relative to the S&P 500: 0.75 times on November 3 versus a five-year average of 1.18 times; semiconductors at 13.8 times, the S&P 500 at 18.3 times. (Source: Bloomberg, S&P Global, Citadel Securities, @Barchart)
Timing changes are already showing up at individual companies. Compute provider IREN said more than $4 billion of annualized revenue that was expected to land in 2026 has been pushed to January at the earliest; co-CEO Daniel Roberts confirmed that the customer who requested the change is Microsoft, which asked for upgraded network equipment to serve the latest models, together with supplier timing, and IREN said the revenue is already contracted and funded.
The revenue has not disappeared, only moved later; Roberts also said that over the past few weeks the questions from capital markets have moved from how big a contract is to whether it can be delivered, financed and run at a profit. Bloomberg also reports that Microsoft is tightening oversight of some data center projects at Nebius, IREN and Nscale and exiting those it considers riskier.
The index's history does not carry over to chip stocks
The VIX volatility index rose from 16.61 to 28.18 on November 5, a 70% jump and the third-largest one-day increase since 1990. Charlie Bilello of Creative Planning shows that after the 20 biggest one-day VIX spikes, the S&P 500 rose 17% on average over the following year, above the 12% of all other periods.
Chart 7 | The 20 largest one-day VIX increases since 1990 and the S&P 500's total return afterward: November 5, 2026 ranks third; the average one-year return after the top 20 is 17%. (Source: YCharts, Creative Planning, @charliebilello)
But that is the S&P 500 average, not chip stocks. Initial jobless claims for the week ended October 31, released on November 5, were only 189,000, the lowest since July, and layoffs remain few; once the mechanical selling stops, the decline may slow. For chip stocks to get back to their pre-election levels, though, someone has to be willing to pay for 2028 orders; if the Texas freeze lasts until the legislature adjourns, it would not lift before the end of May next year.
CoreWeave reports earnings on November 10 and Nebius on November 12. How they describe delivery and financing timelines for 2027 and 2028 will be the next post-election answer from the compute providers themselves.
Sources: JPMorgan, Goldman Sachs, UBS, Wells Fargo, Nomura, Bank of America, Vanda Research, Citadel Securities, CNBC, Bloomberg, Yahoo Finance and market quotes (images from Steno Research, Morgan Stanley, @RyanDetrick, Vanda, @BrianSozzi, Citadel Securities, LearnInvest, JPMorgan, @pequityresearch, @Barchart, YCharts, Creative Planning, @charliebilello)