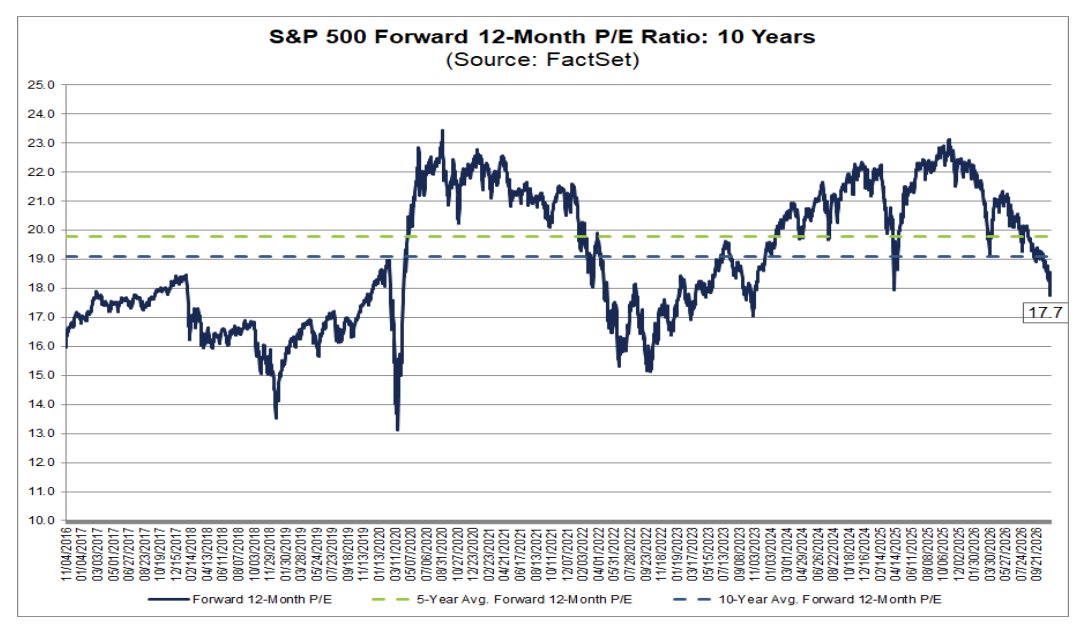
S&P 500 Forward 12-Month P/E Falls to 17.7, Below 5- and 10-Year Averages
S&P 500 forward 12-month P/E, last 10 years | Now 17.7, below the 5-year (19.8) and 10-year (19.1) averages
English financial charts and market context published in 2026-11, page 11.
S&P 500 forward 12-month P/E, last 10 years | Now 17.7, below the 5-year (19.8) and 10-year (19.1) averages
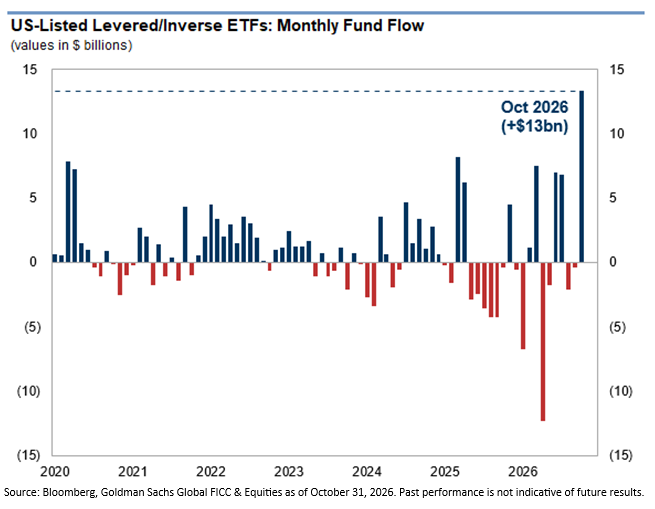
Monthly fund flows into US-listed levered/inverse ETFs | October 2026 saw +$13bn, the largest monthly inflow on record
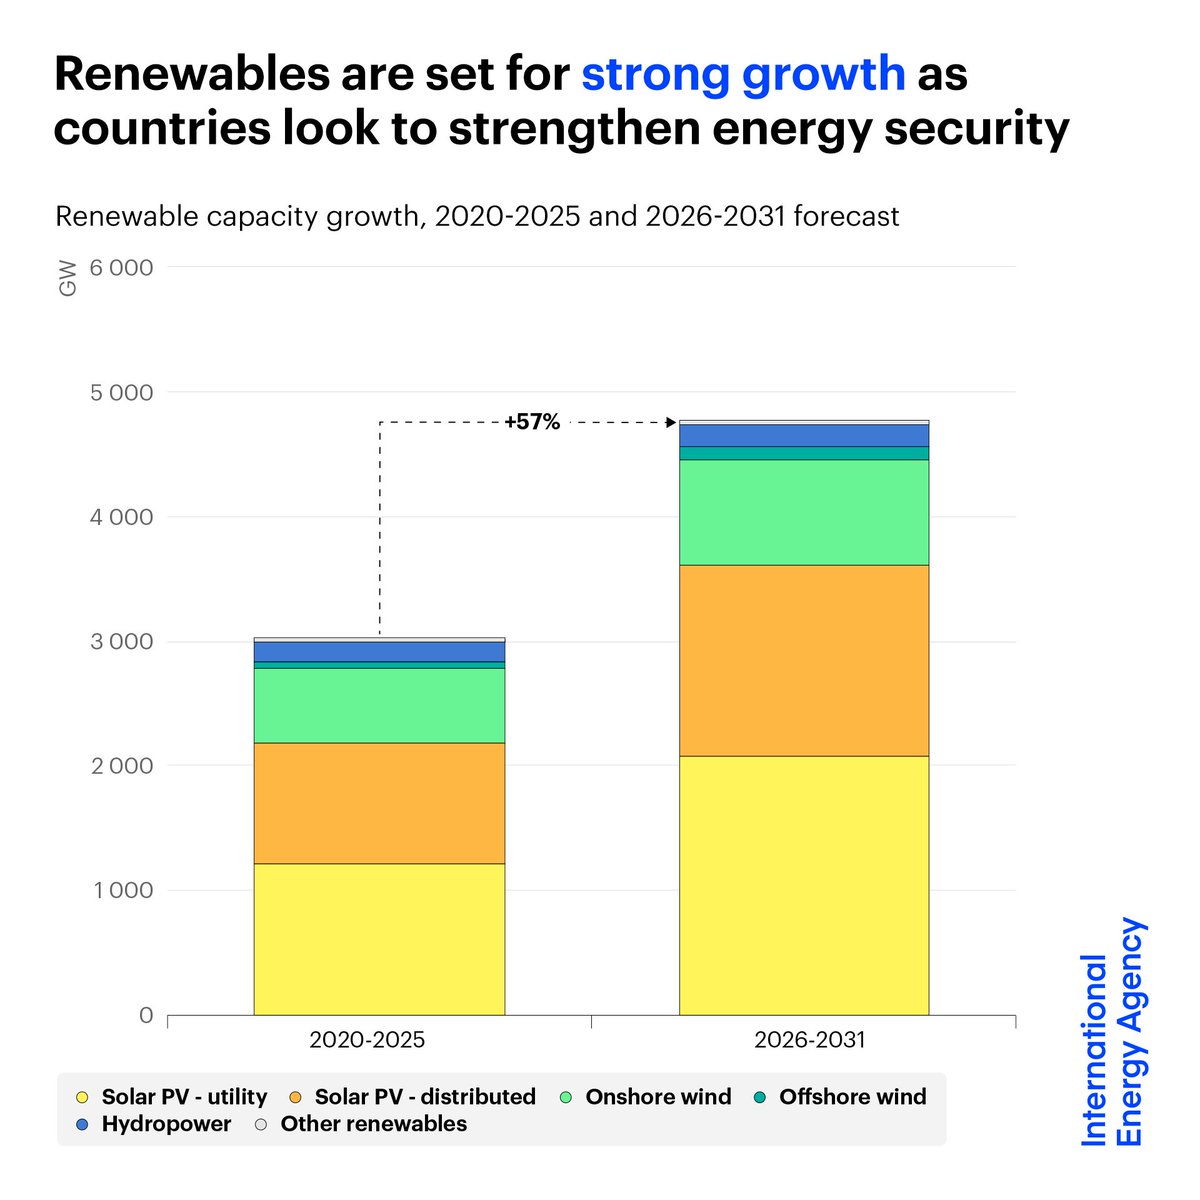
Global renewable capacity additions, 2020-2025 vs 2026-2031 forecast | The coming five years rise 57%, led by solar PV and wind
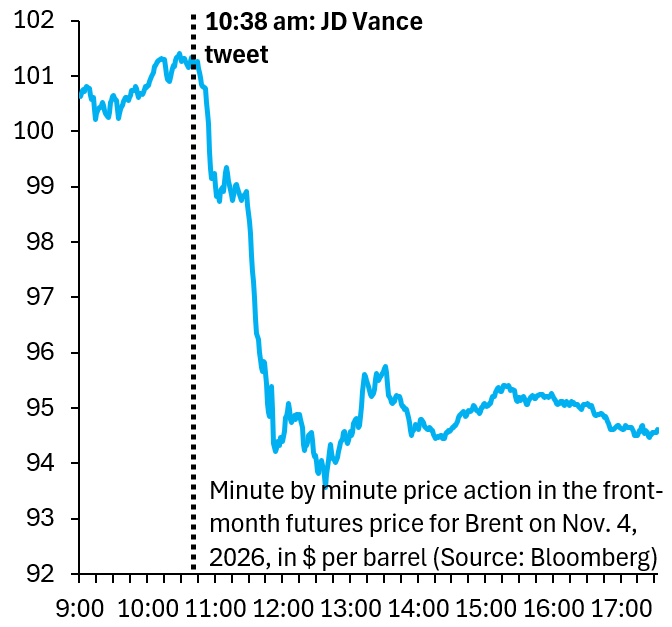
Front-month Brent, minute-by-minute on Nov 4 2026 ($/bbl) | Slid from ~$101.3 to ~$94.5 through the session
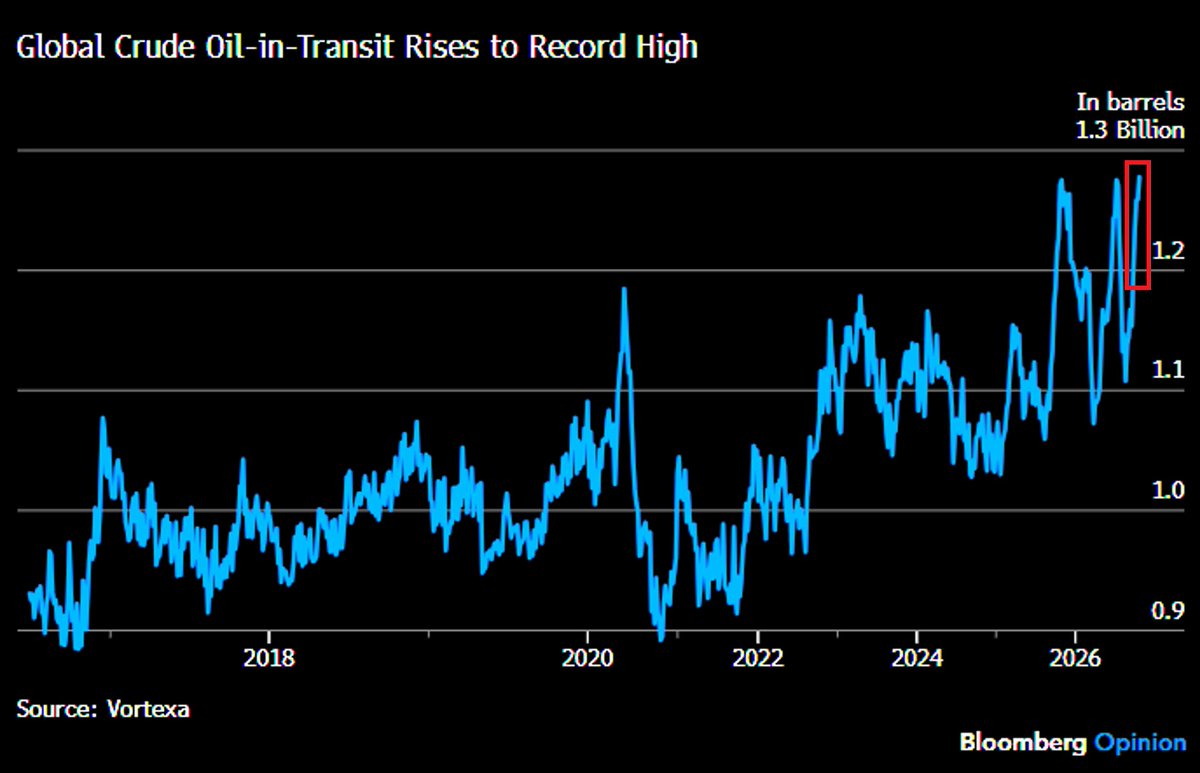
Global crude oil in transit (billion barrels) | Now ~1.28B, an all-time high, up ~180M barrels in recent weeks
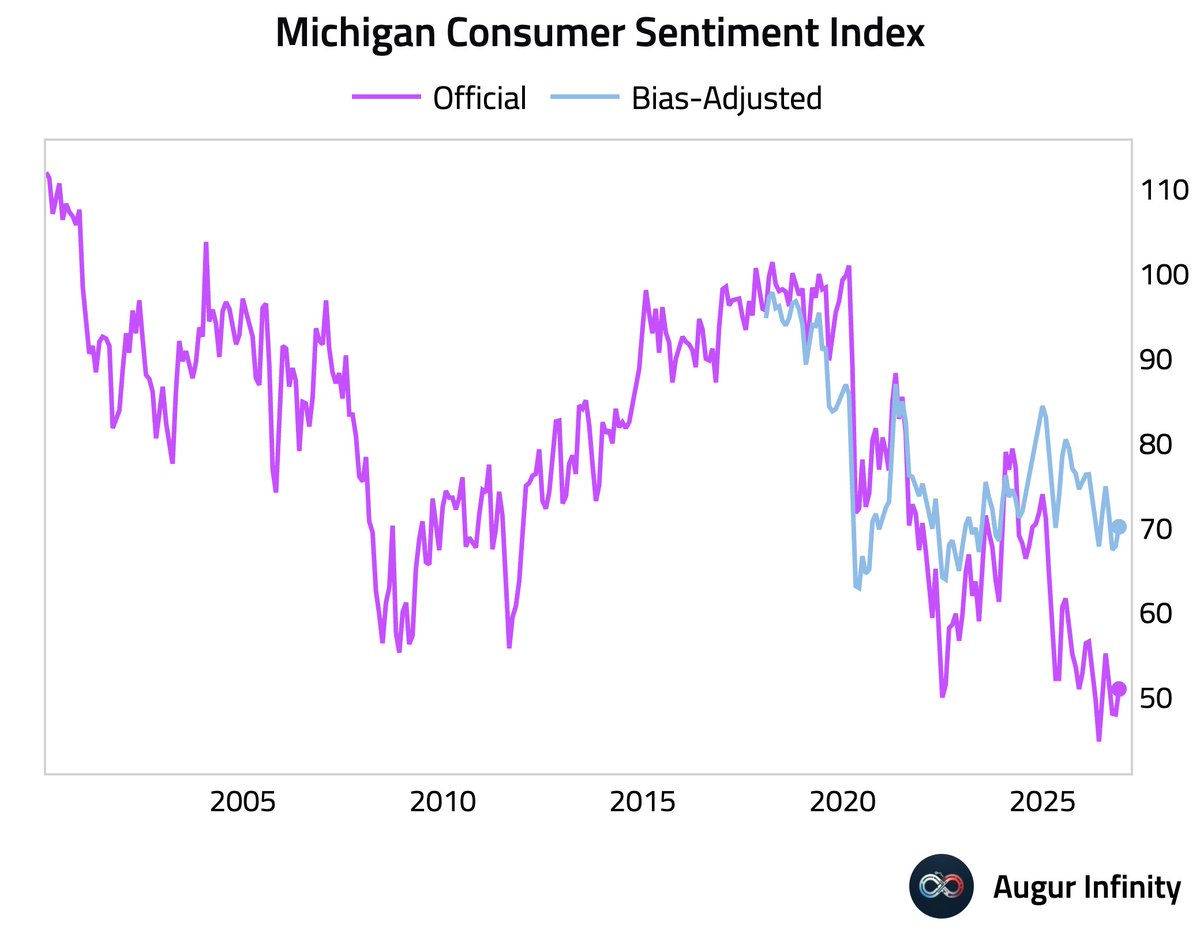
Michigan Consumer Sentiment, official vs bias-adjusted | Official near 51 while bias-adjusted sits around 70, a ~20-point gap
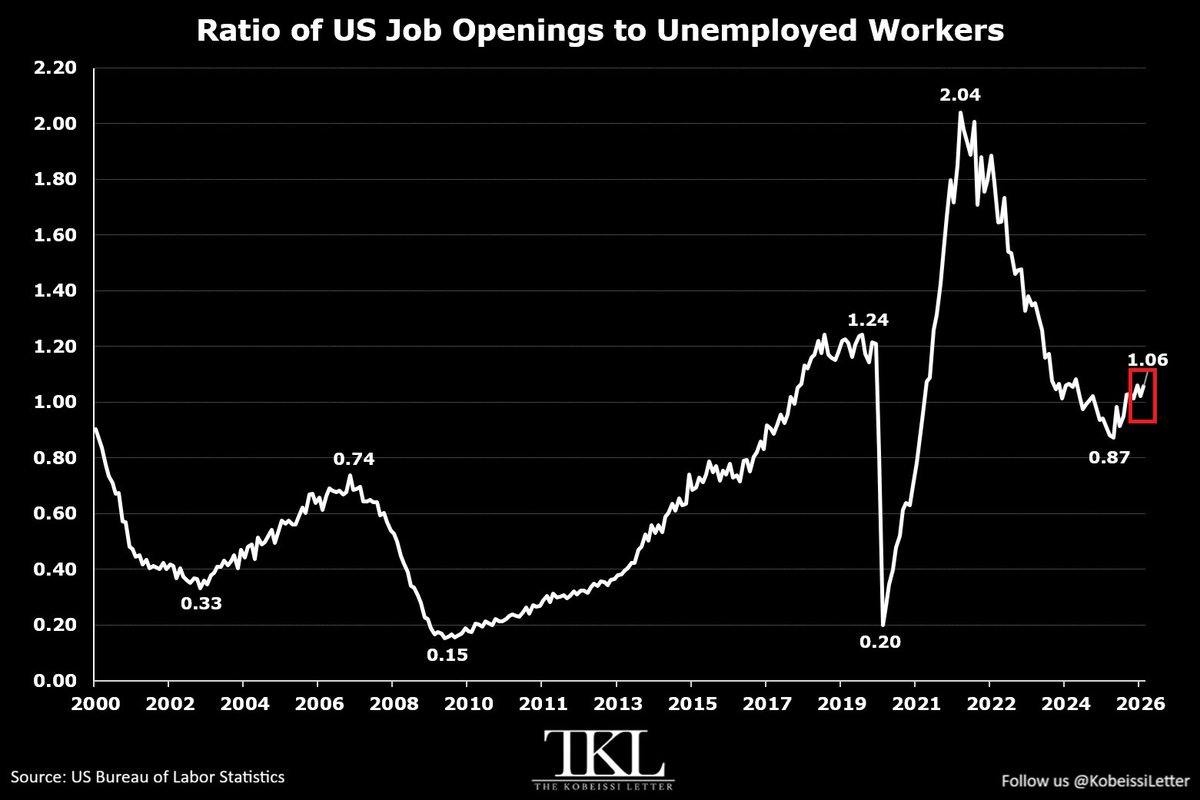
US ratio of job openings to unemployed workers, 2000-2026 | Back up to 1.06 from a recent low of 0.87, below the 2022 peak of 2.04
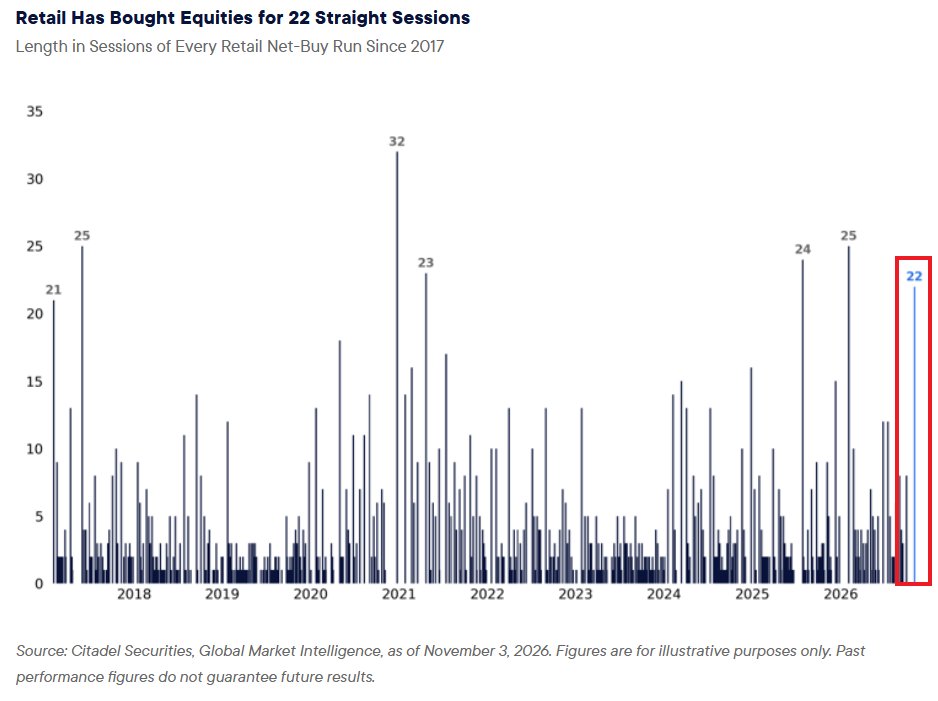
Length in sessions of every retail net-buy run since 2017 | The current 22-session streak is the 6th-longest since 2017, below the 32-session peak in 2021
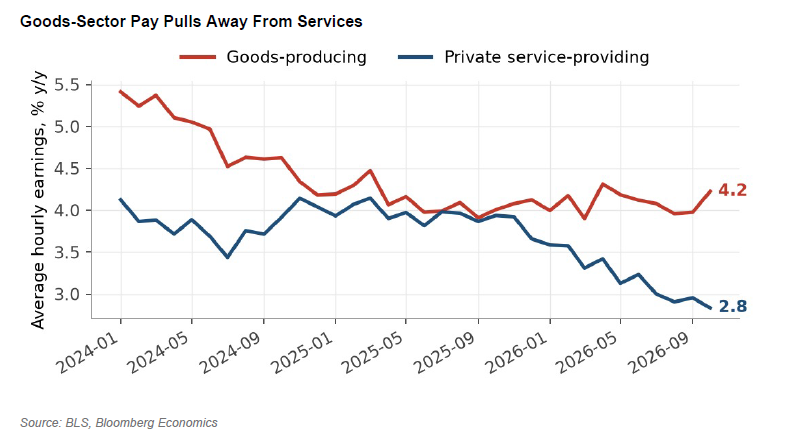
Average hourly earnings growth, goods vs private services, 2024-2026 | Goods +4.2% y/y vs services +2.8%, the widest gap of the period
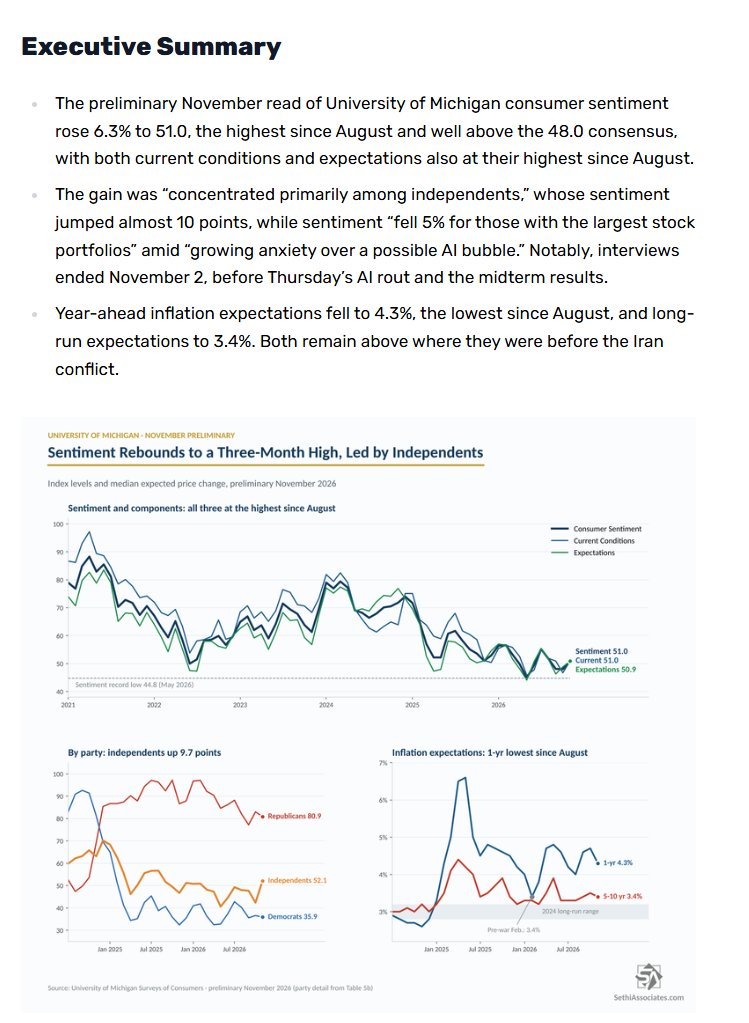
University of Michigan consumer sentiment and components since 2021 | Preliminary November reading 51.0, the highest since August, with 1-year inflation expectations easing to 4.3%
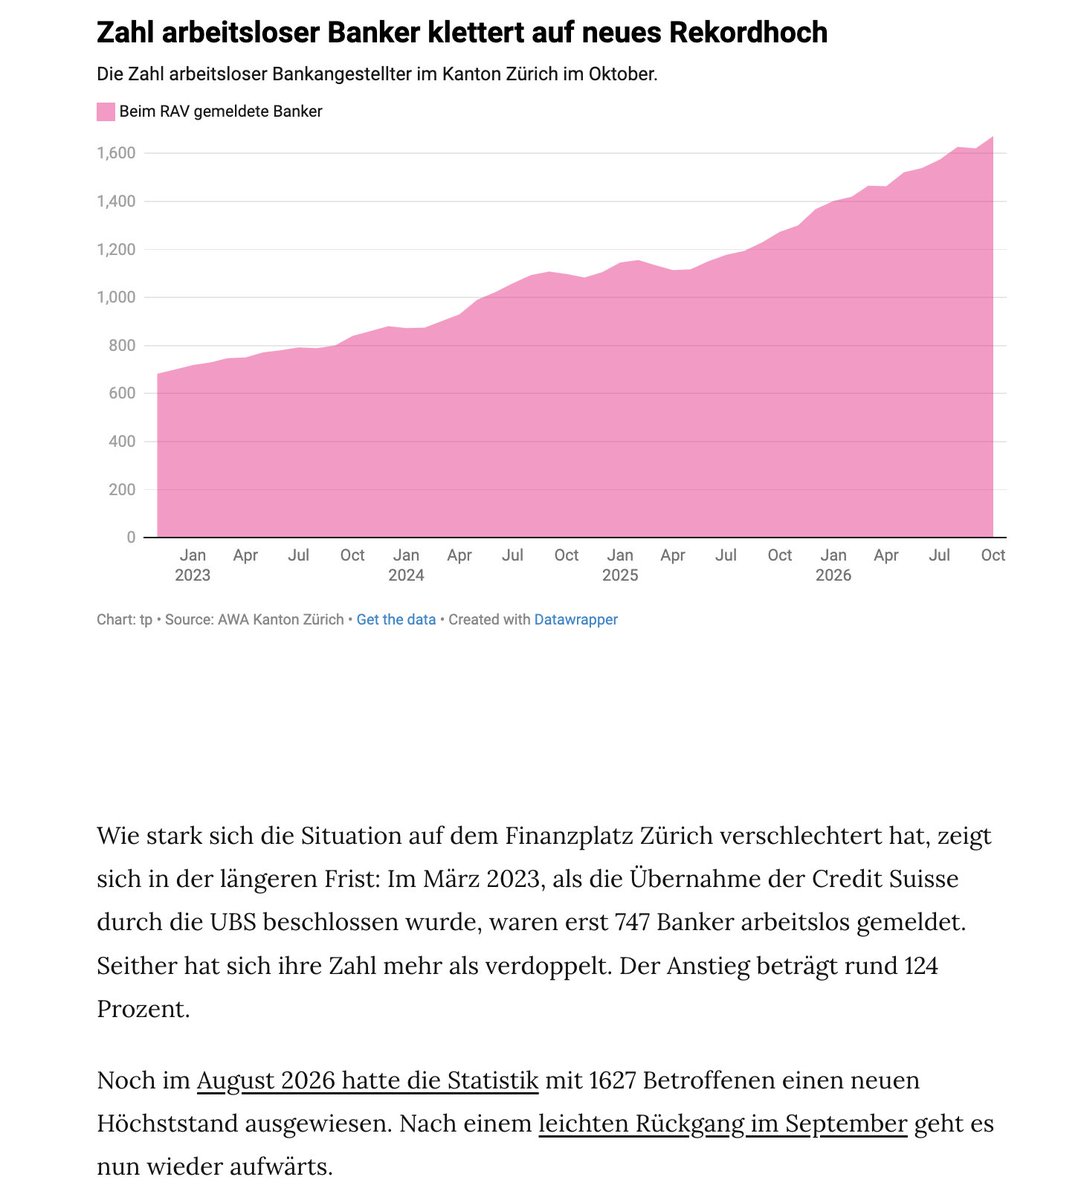
Registered unemployed bank staff in Canton Zurich, 2023-2026 | 1,672 in October 2026, a record high and up 31.3% from a year earlier
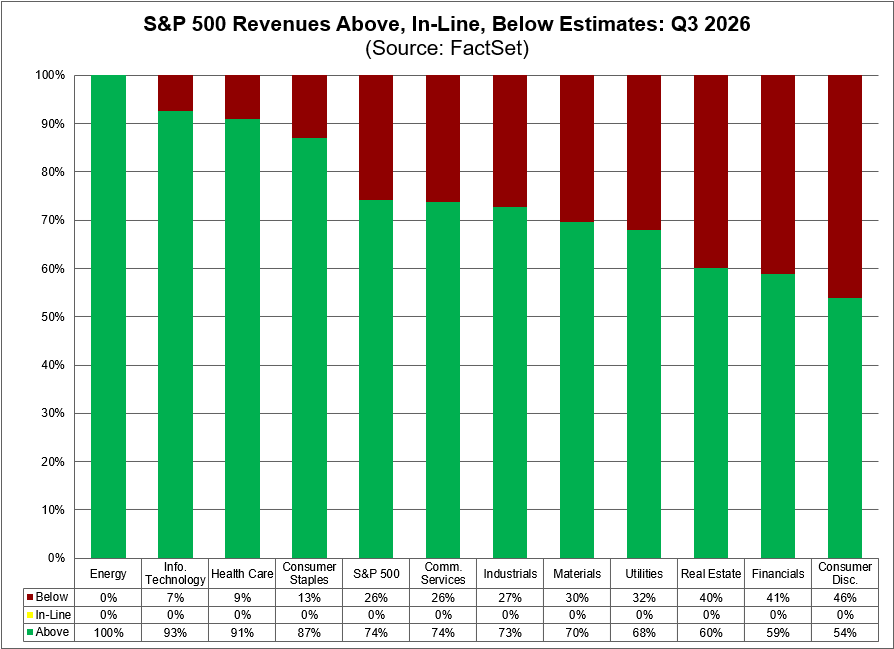
Share of S&P 500 companies above/in-line/below revenue estimates by sector, Q3 | 74% beat overall; Energy 100% and Info Tech 93% lead, Consumer Disc. 54% lowest
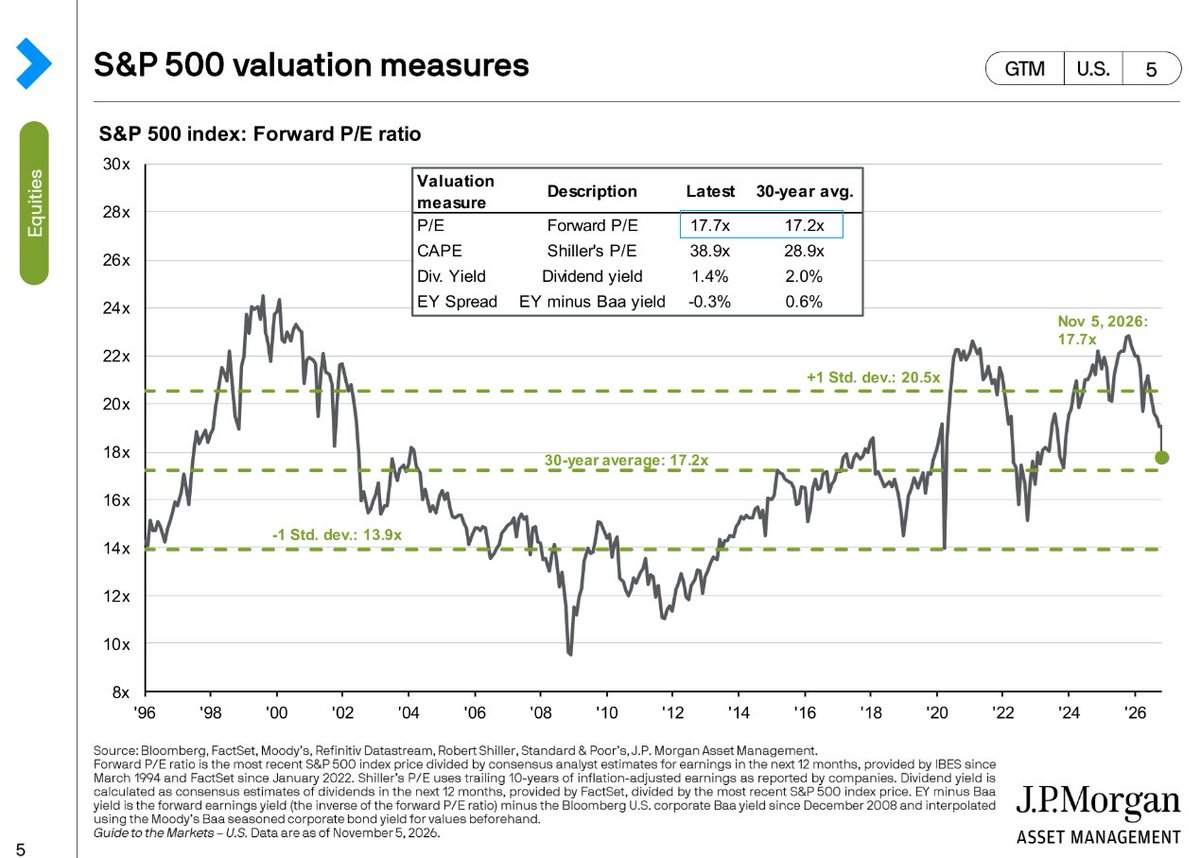
S&P 500 forward P/E ratio, 1996-2026 | Now 17.7x, close to the 30-year average of 17.2x, but CAPE at 38.9x is above its 28.9x average
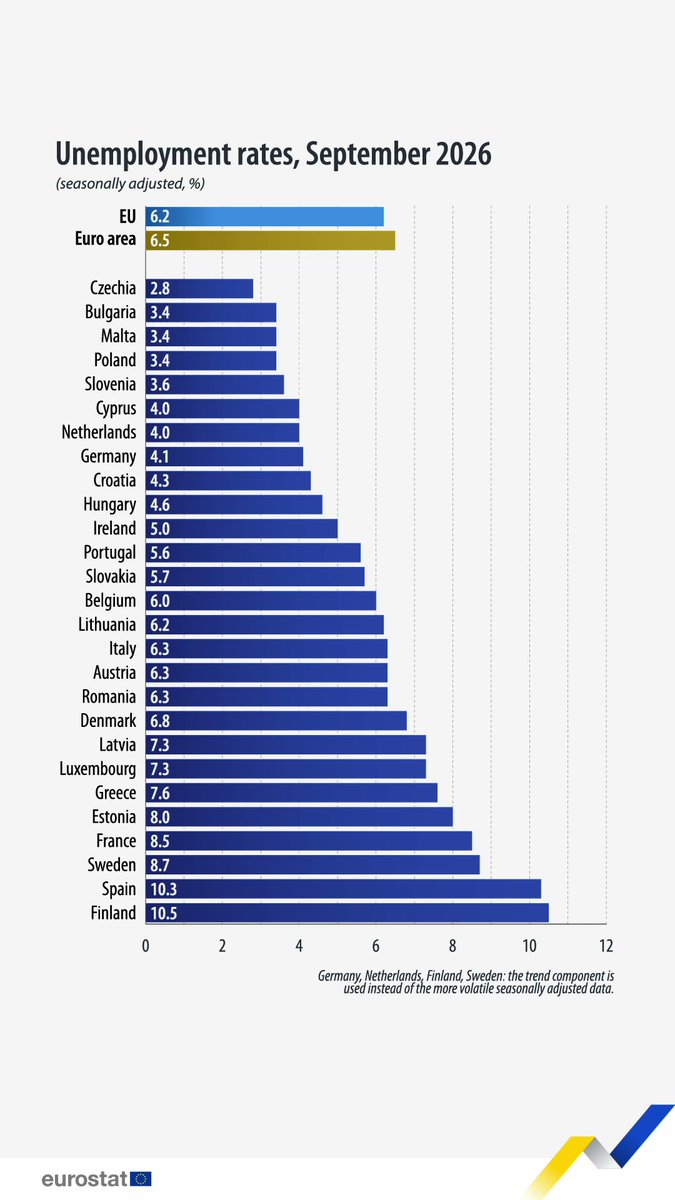
Unemployment rates by EU country, September 2026 | Euro area 6.5% and EU 6.2%; Czechia is lowest at 2.8% and Finland highest at 10.5%
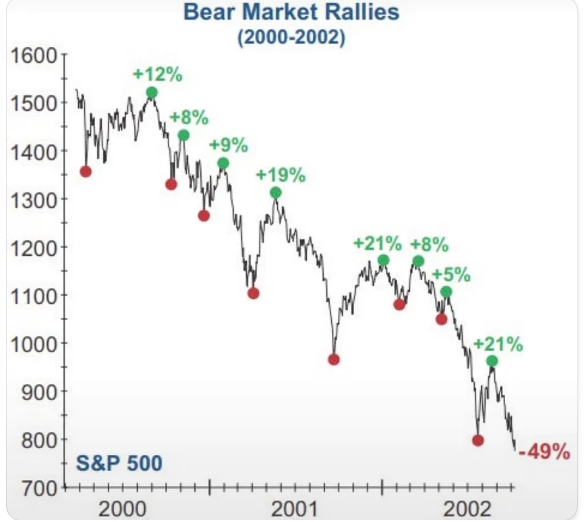
S&P 500 during the 2000-2002 bear market | Eight rallies of +5% to +21% punctuated an overall decline of 49%
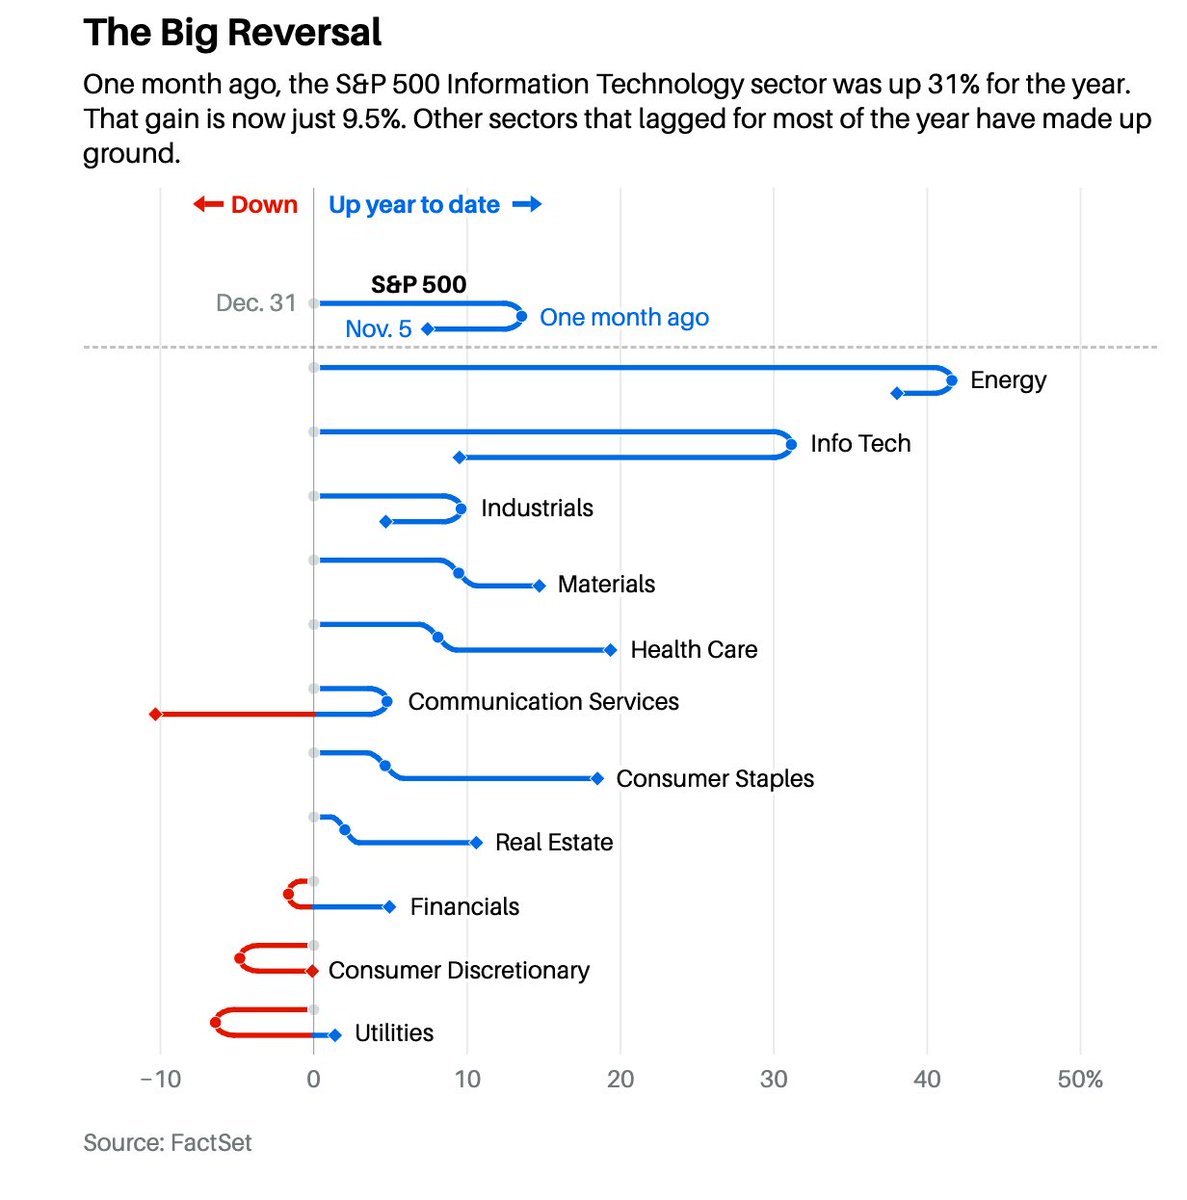
S&P 500 sector YTD returns, one month ago vs Nov 5 | Info Tech fell from +31% to +9.5% while Energy leads near +42% and laggards caught up
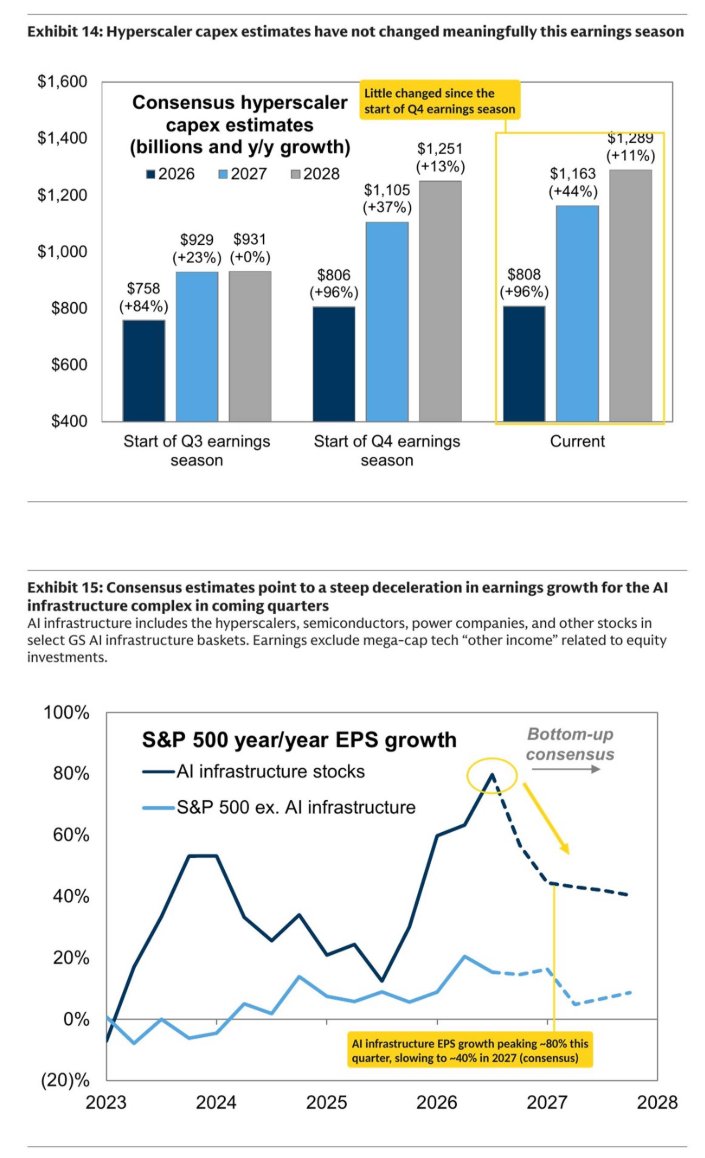
Consensus hyperscaler capex estimates and S&P 500 AI-infrastructure EPS growth | Capex ~$808bn in 2026 (+96%) and ~$1.16tn in 2027; AI EPS growth peaks near 80% and slows to ~40% in 2027
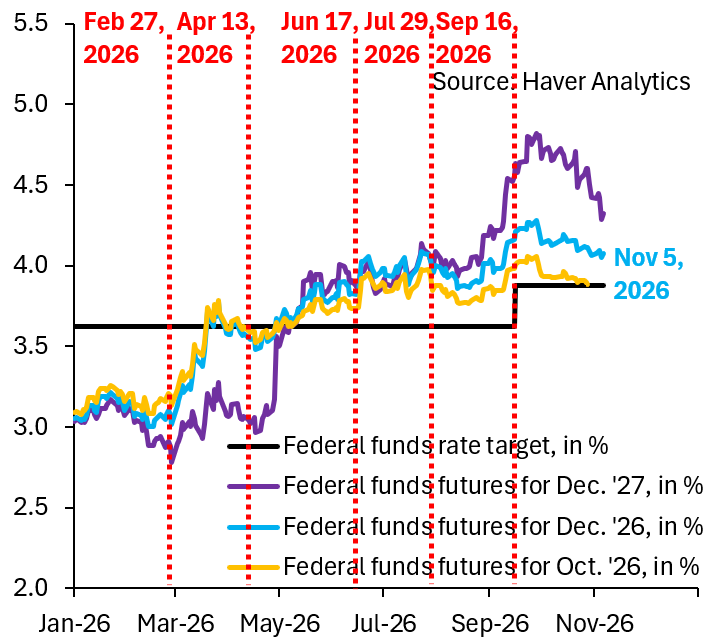
Federal funds rate target and futures for various months (%) | Target stepped up to ~3.875%; the Dec 2027 contract eased from ~4.8% to ~4.3%
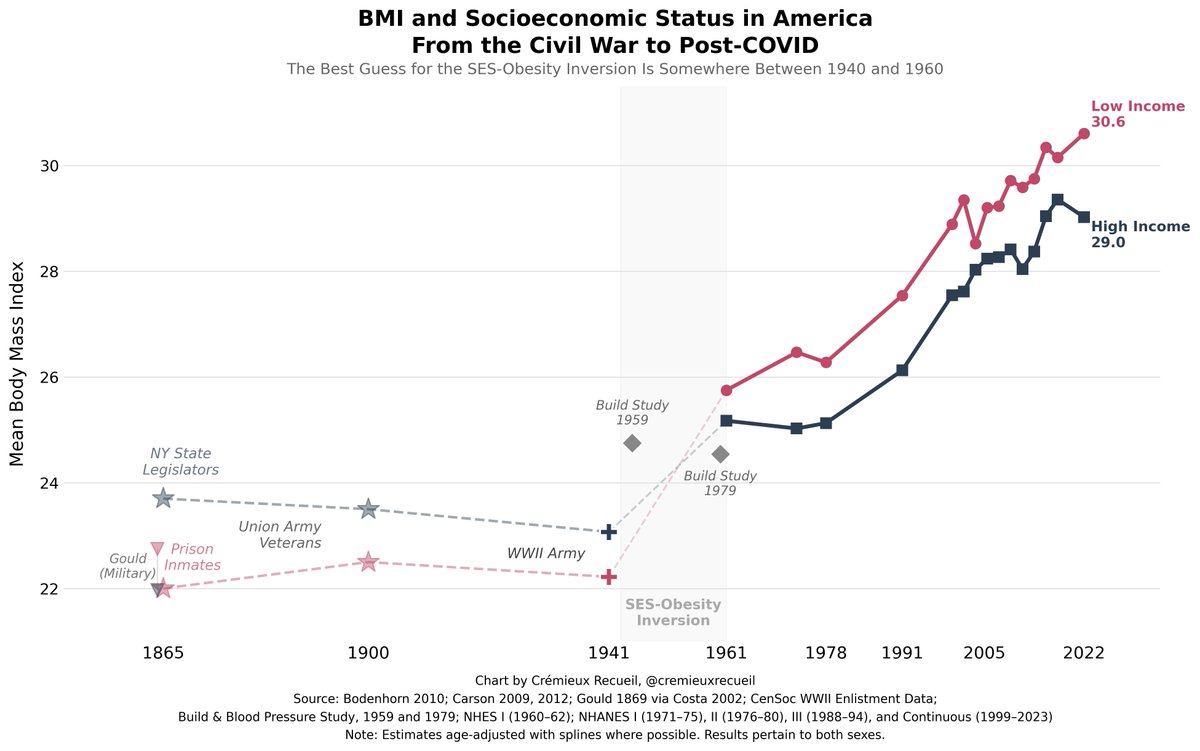
US mean body mass index by income group, 1865-2022 | In 2022 low income at 30.6 vs high income at 29.0; the SES-obesity link inverted around 1940-60
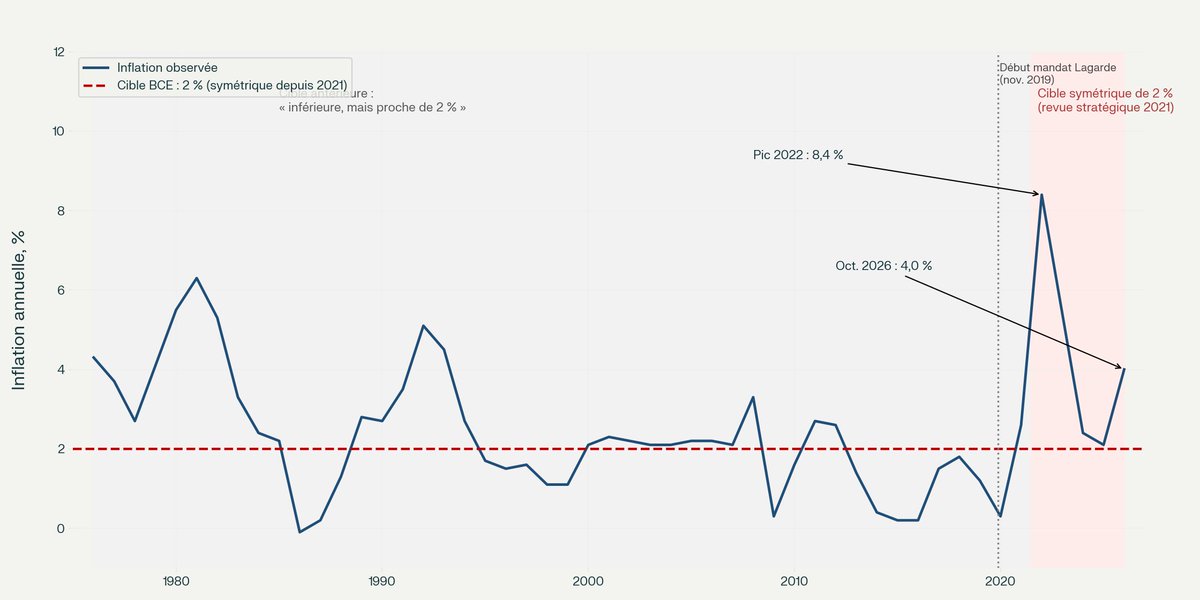
Euro-area annual inflation vs the ECB's 2% target | Peaked at 8.4% in 2022, easing to 4.0% by October 2026 — still twice the target
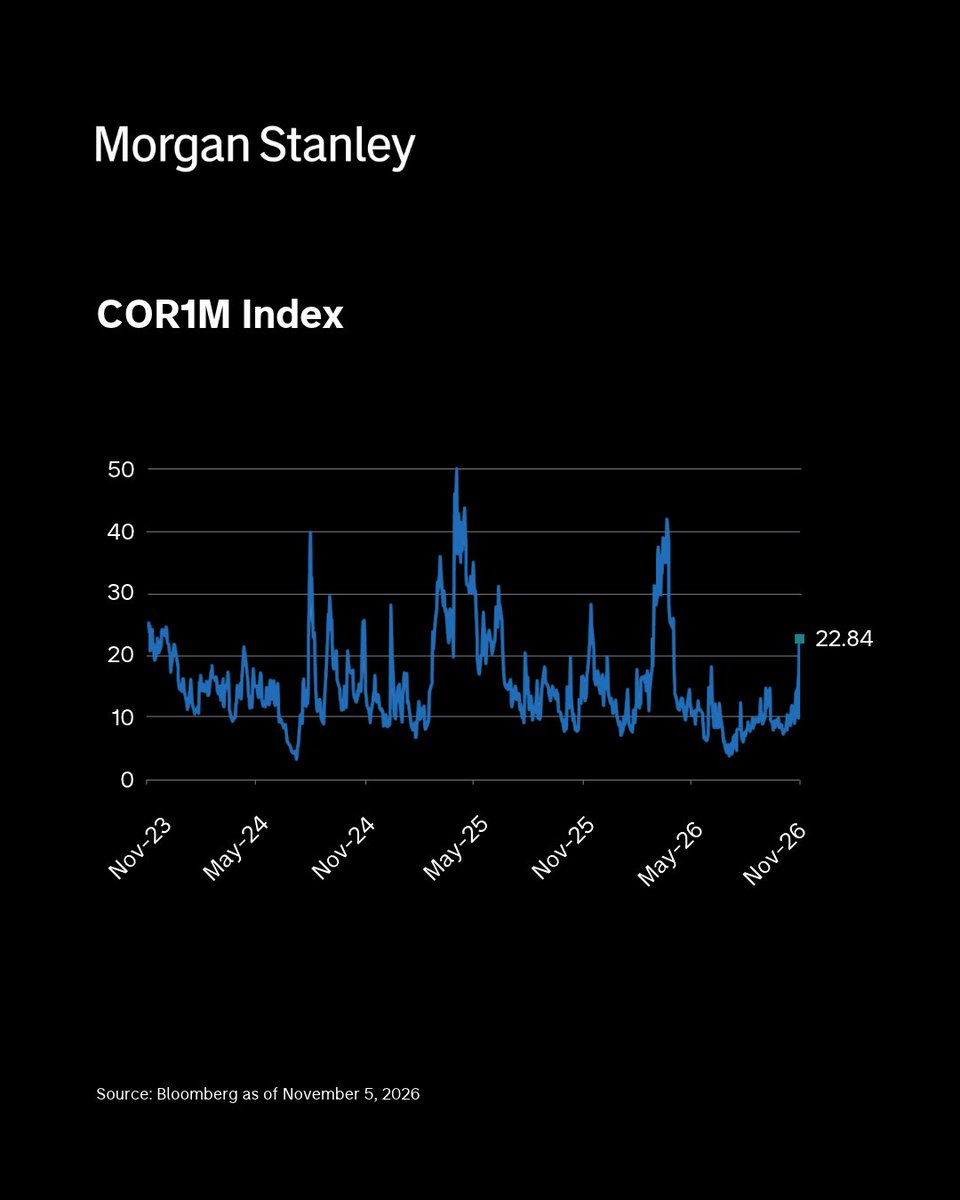
Morgan Stanley COR1M index, 2023-2026 | Rose to 22.84 on Nov 5, a sharp jump from recent lows
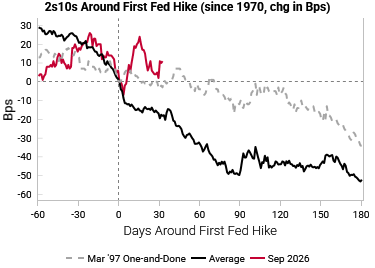
2s10s change in bps around the first Fed hike since 1970 | The September 2026 path mirrors 1997's one-and-done, not the historical average's drift toward inversion
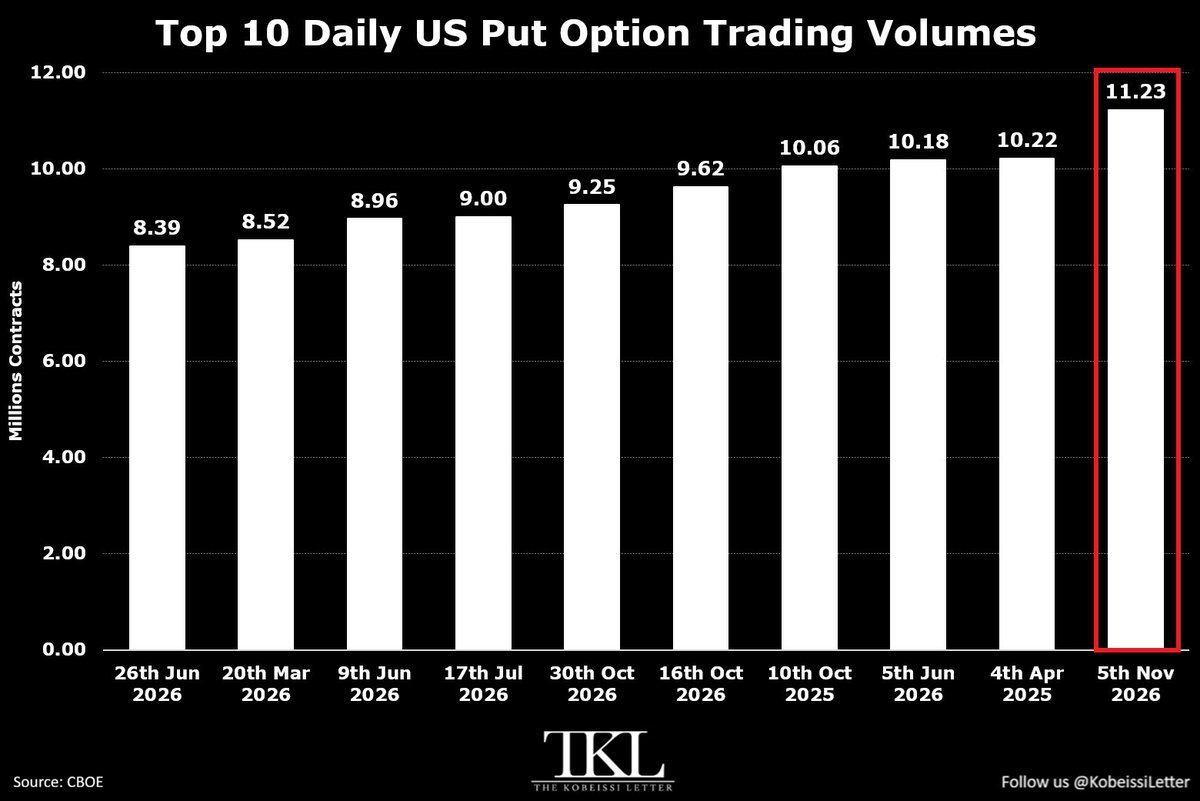
CBOE's top 10 daily US put option trading volumes | Nov 5, 2026 set a record at 11.23M contracts, topping the 10.22M from April 2025
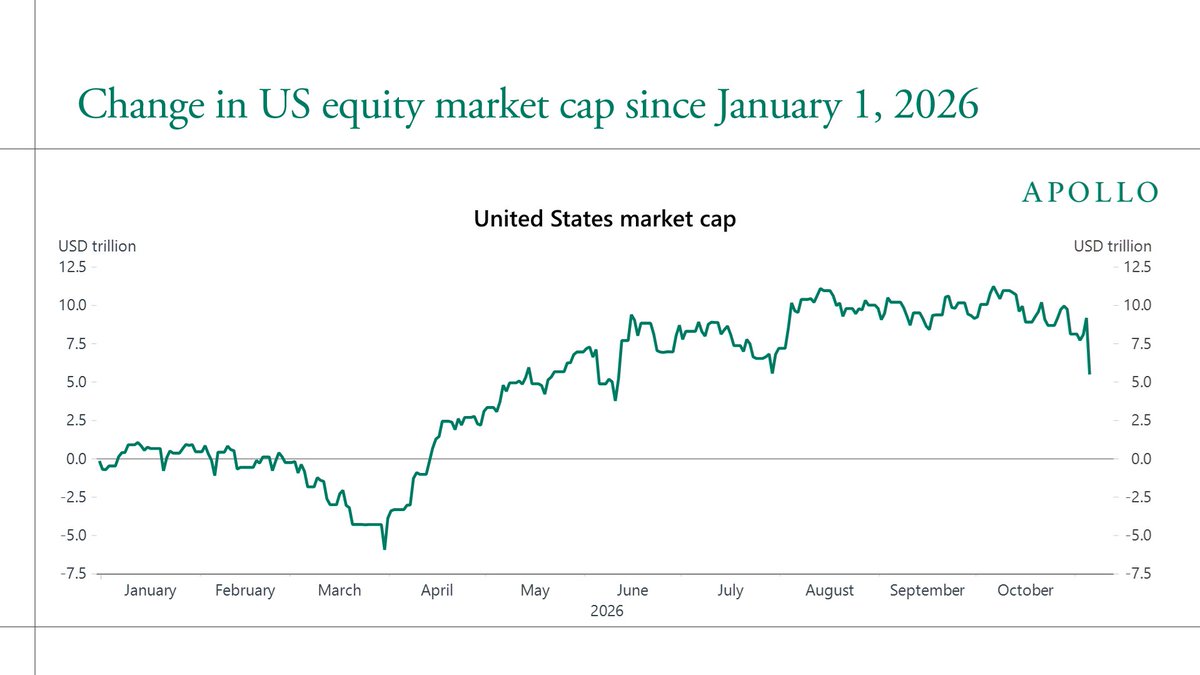
Change in US equity market cap since Jan 1, 2026 | Still up roughly $5 trillion year-to-date, but down from a peak of about +$10.5 trillion
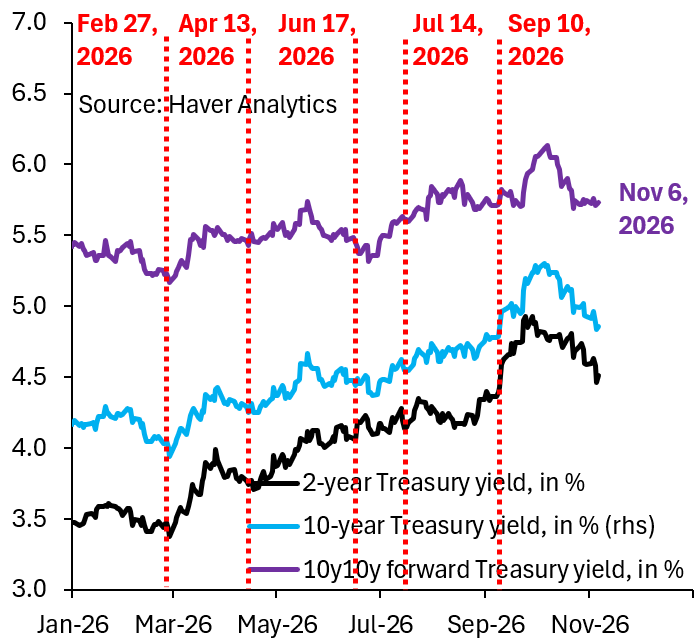
2-year, 10-year and 10y10y forward Treasury yields, 2026 | Short-term yields have fallen while the 10y10y forward holds near 5.7%, pointing to fiscal stress rather than AI
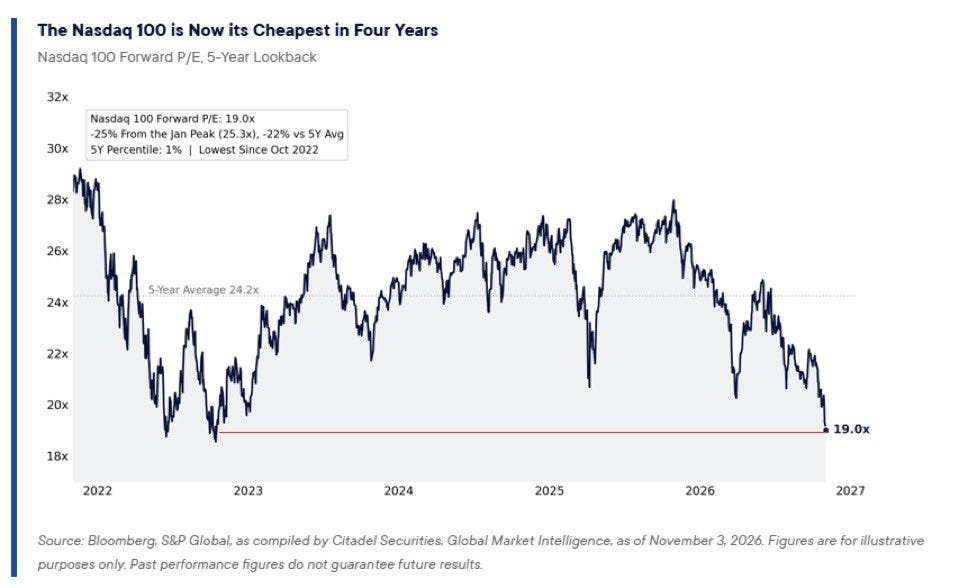
Nasdaq 100 forward P/E, 5-year lookback | Now 19x, down 25% from the January peak of 25.3x and in the 1st percentile over five years
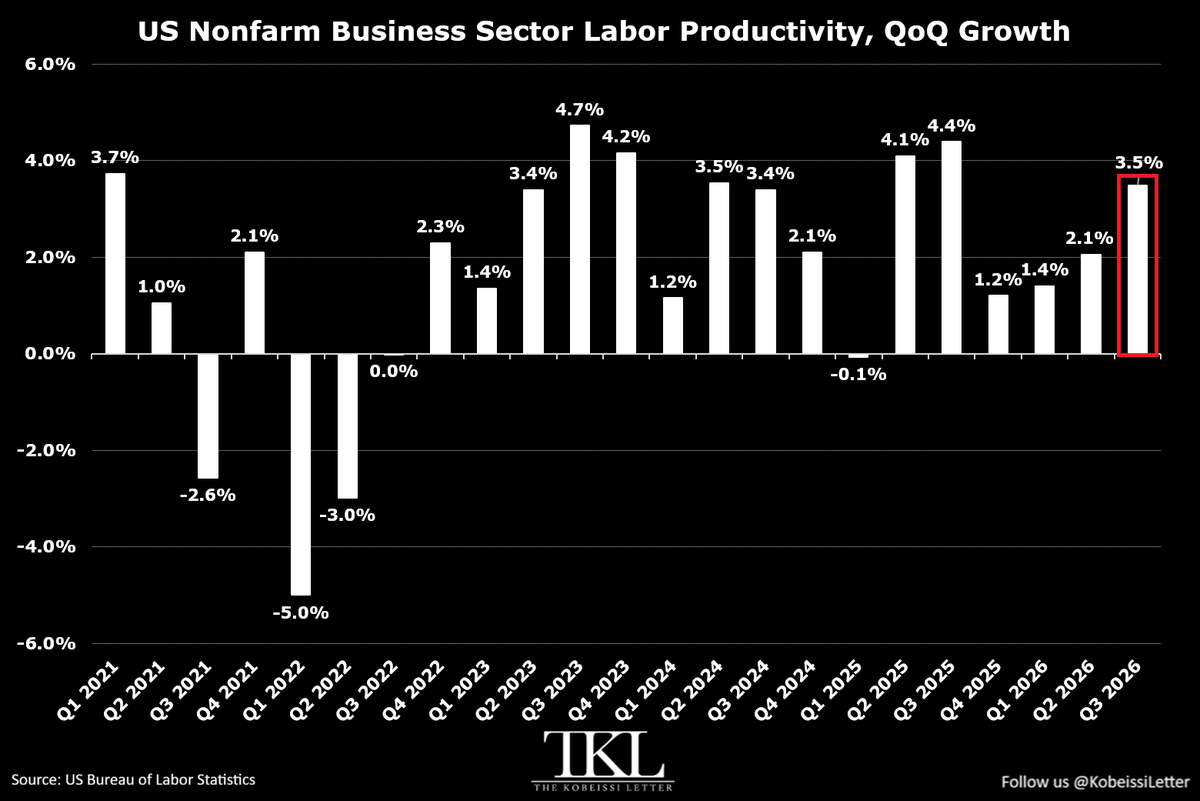
US nonfarm business sector labor productivity, QoQ annualized growth | Q3 2026 at 3.5%, the largest gain since Q3 2025's 4.4%
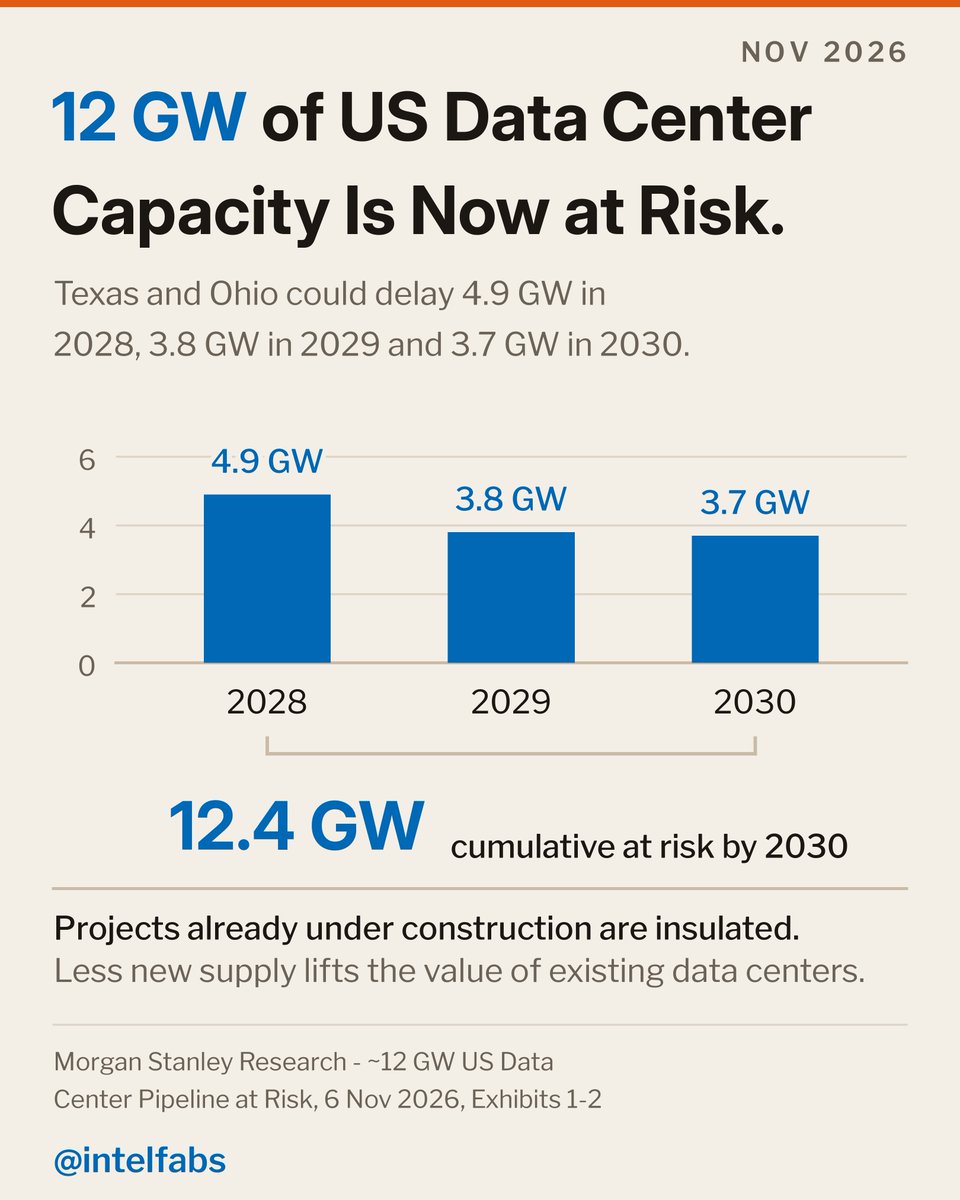
US data-center capacity at risk of delay (GW), 2028-2030 | Texas and Ohio could delay 4.9 GW in 2028 and 3.8 GW in 2029, 12.4 GW cumulatively by 2030
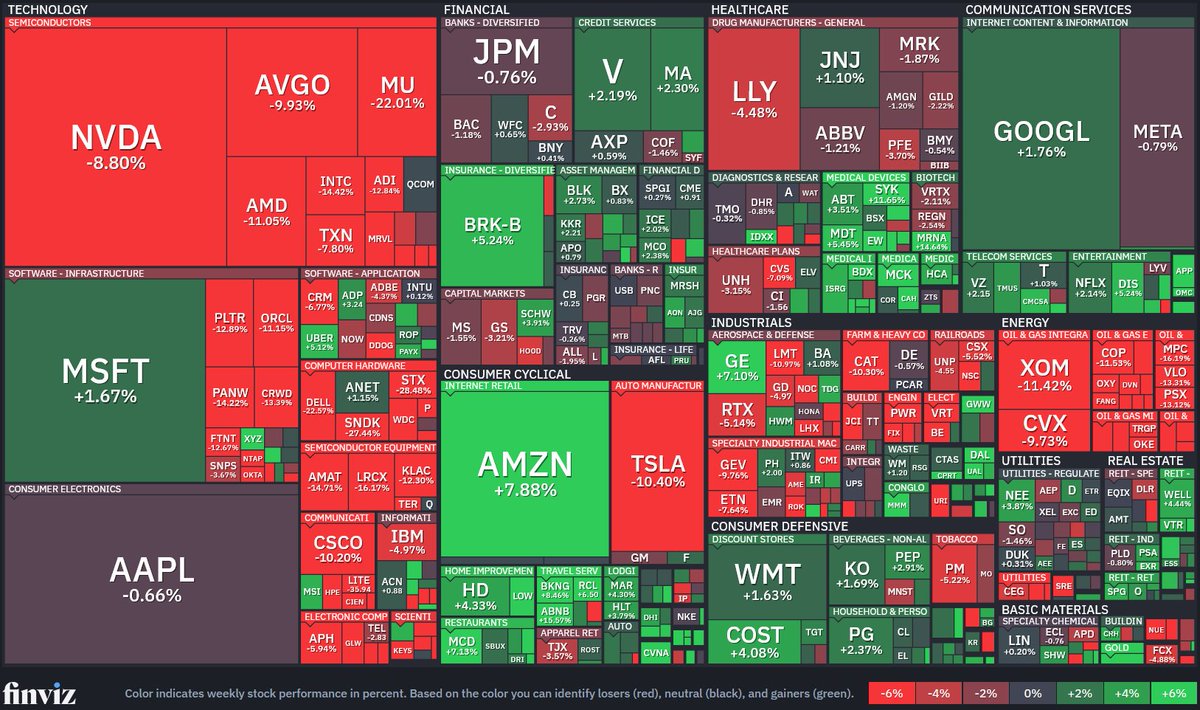
Weekly performance heatmap of US stocks by sector | Semis slump with MU -22% and AVGO -10%, while Amazon stands out at +7.9%
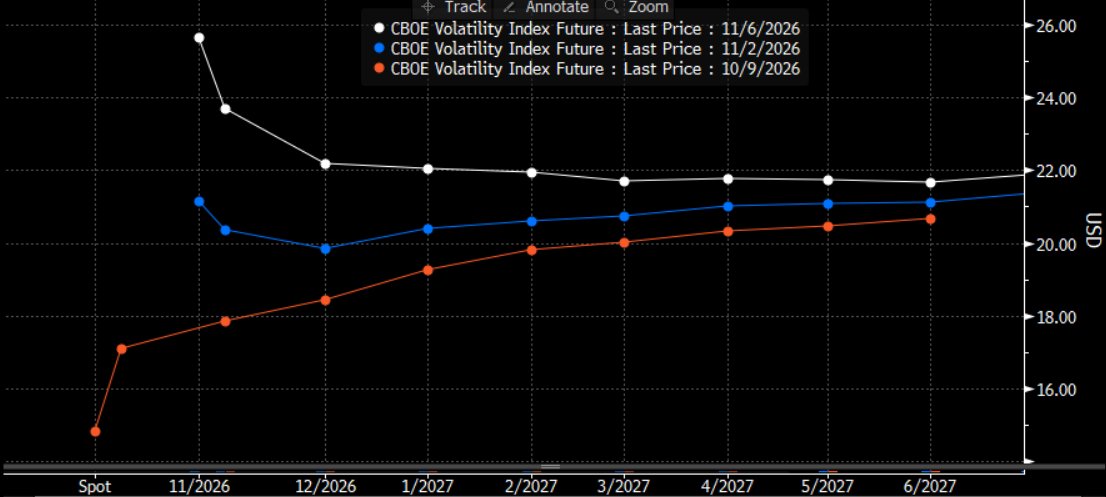
VIX futures term structure on three dates | On Nov 6 the front month at about 25.5 sits above later months in backwardation, versus contango on Oct 9
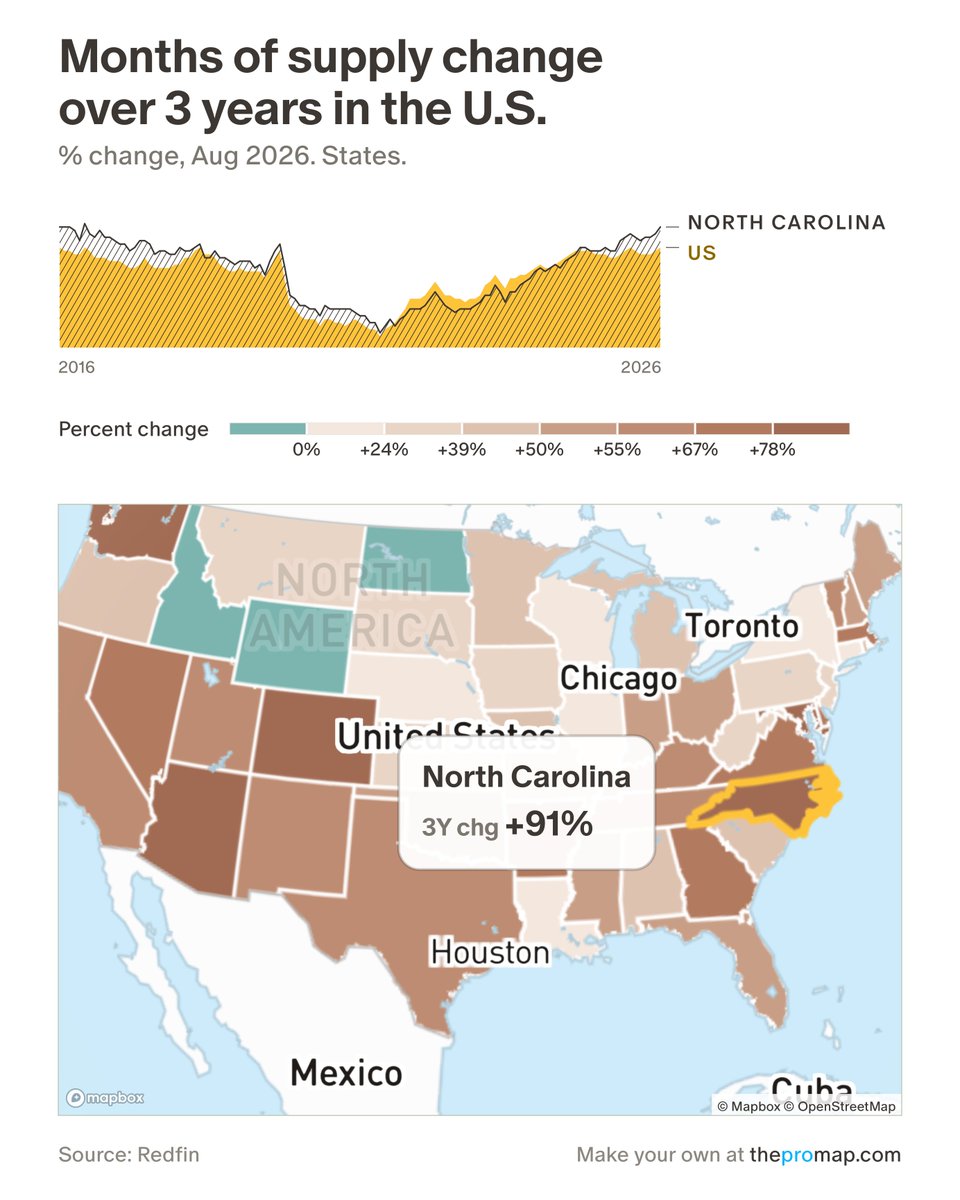
Change in months of housing supply by US state, 3-year | North Carolina +91%, the biggest increase nationwide as of August 2026
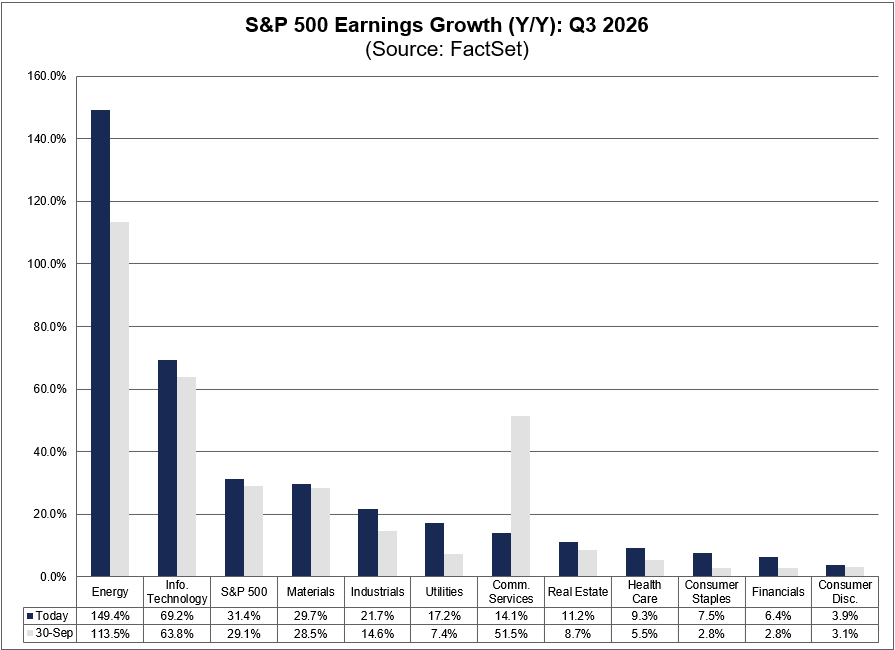
S&P 500 sector Y/Y earnings growth, Q3 2026 | Index up 31.4%, led by Energy at +149% and Info Tech at +69%, with 7 of 11 sectors growing double-digits
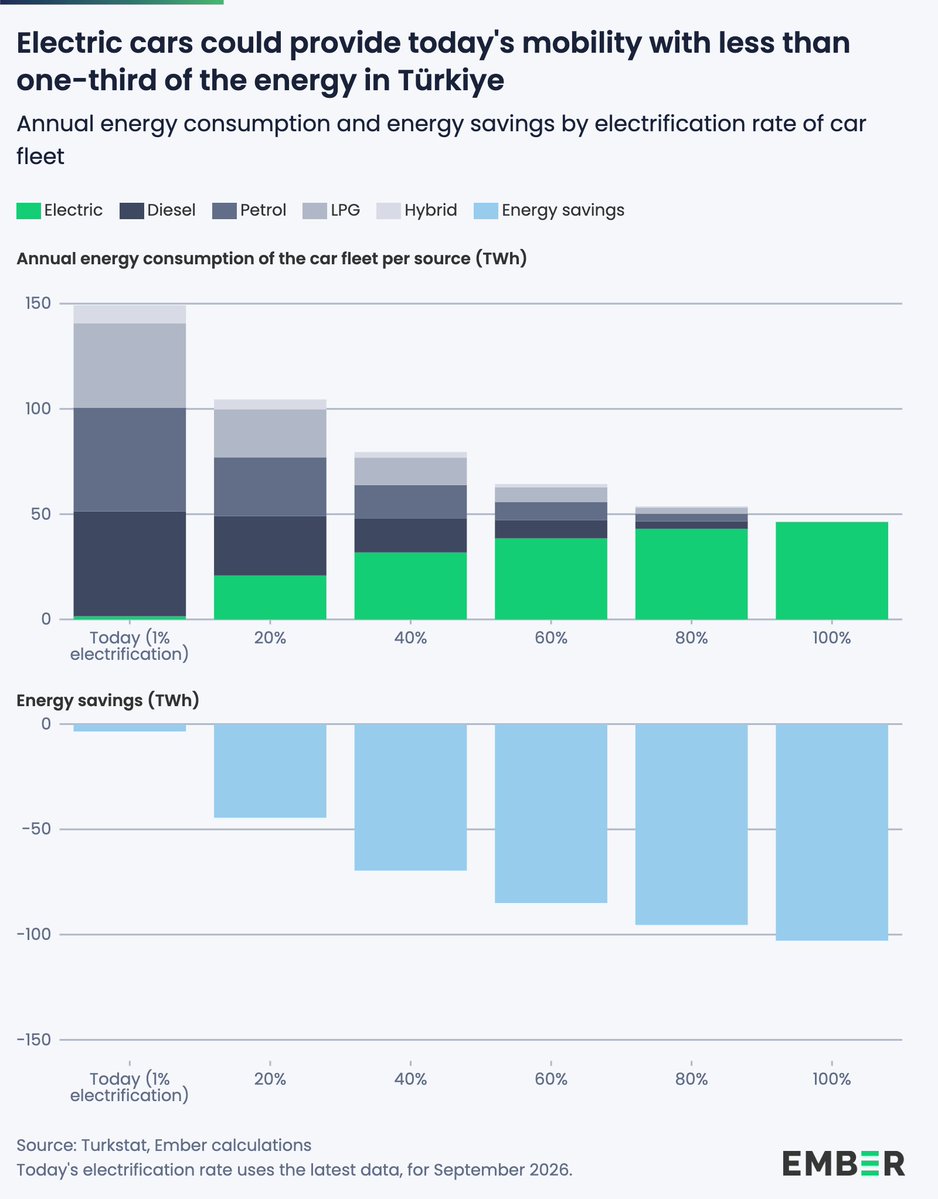
Car-fleet annual energy use and savings by electrification rate | At 1% EV it's about 150 TWh, falling to roughly 45 TWh at 100%, saving around 100 TWh
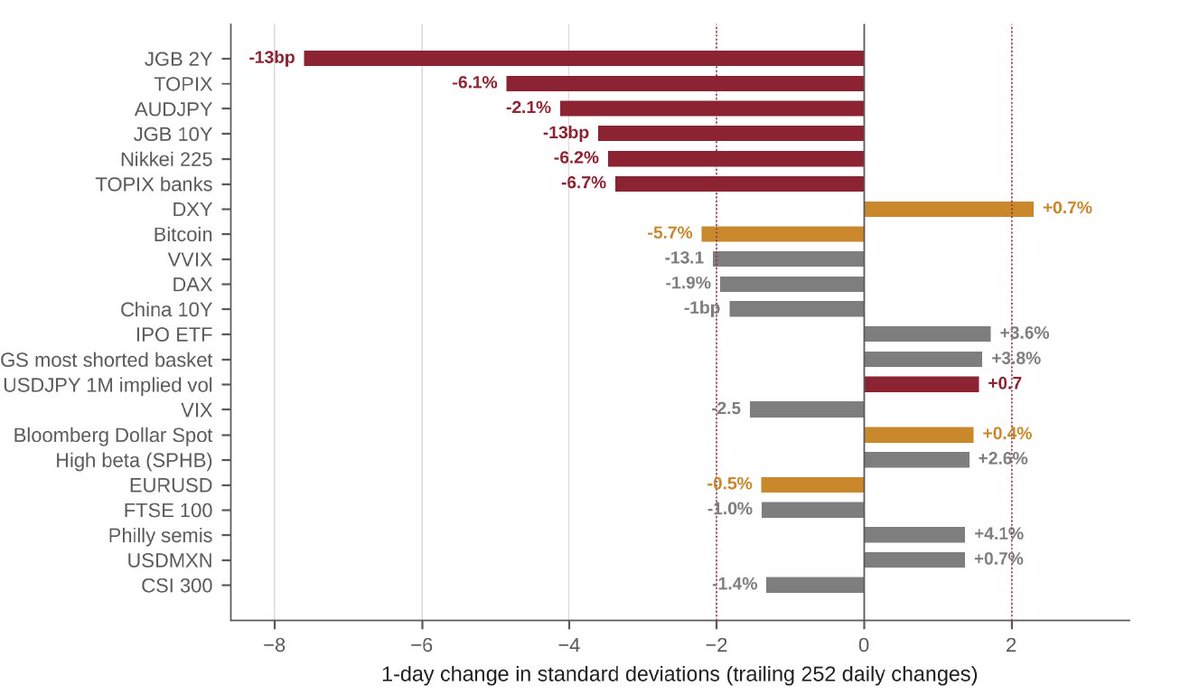
1-day asset moves in standard deviations (trailing 252 days) | JGB 2Y is the most extreme at about -7.5σ, with TOPIX and Nikkei both down over 6%
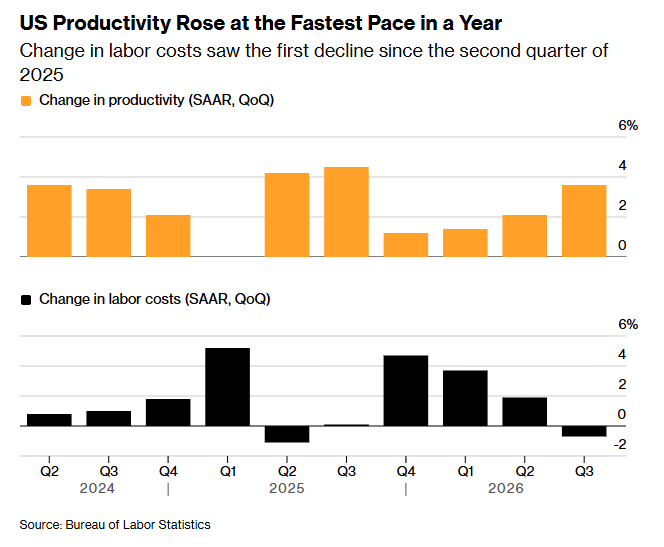
US productivity and unit labor costs, SAAR QoQ | Q3 productivity ~3.5%, the fastest in a year, while labor costs fell for the first time since Q2 2025
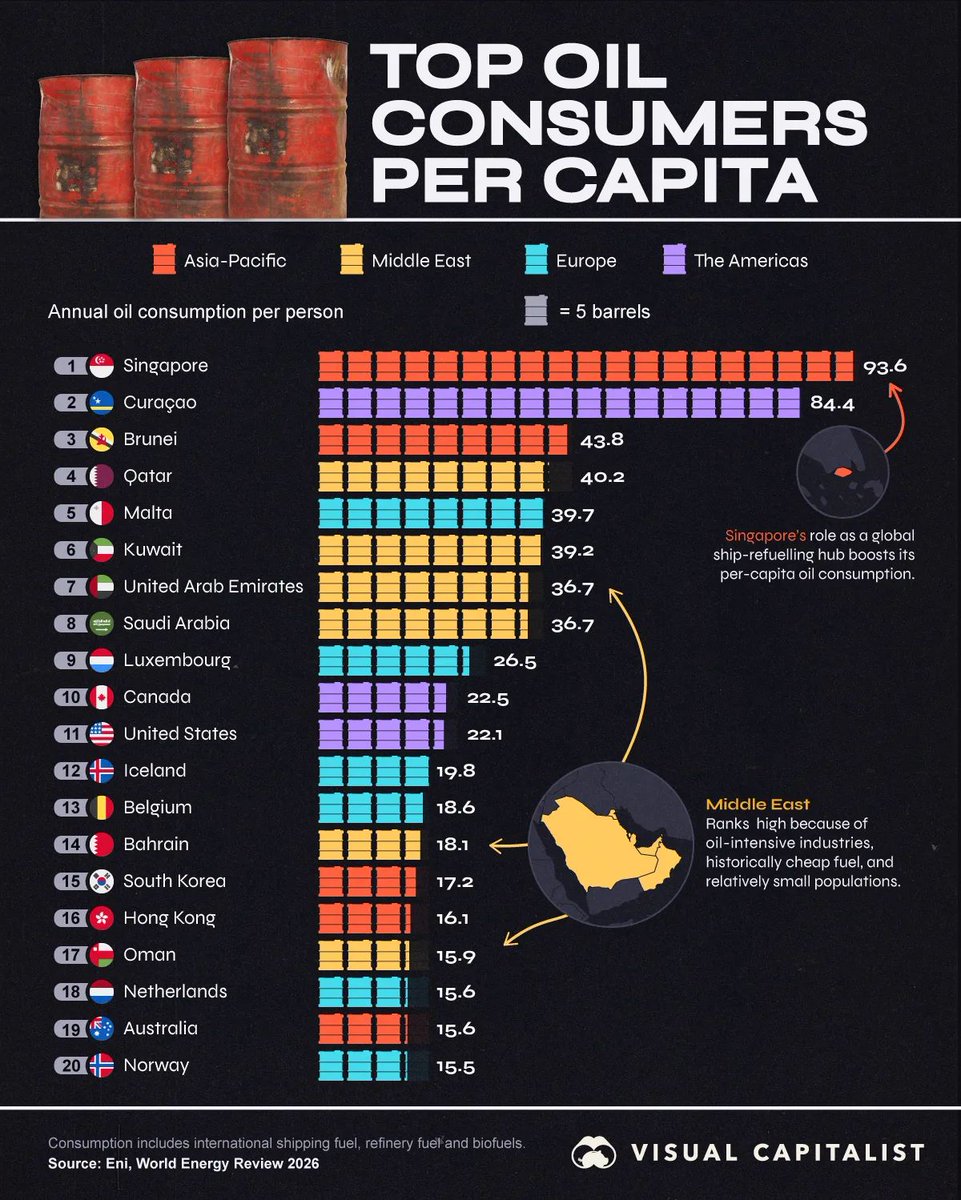
Annual oil consumption per person by country, top 20 | Singapore highest at 93.6 barrels; Saudi Arabia 36.7, US 22.1; four Gulf producers in the top 8
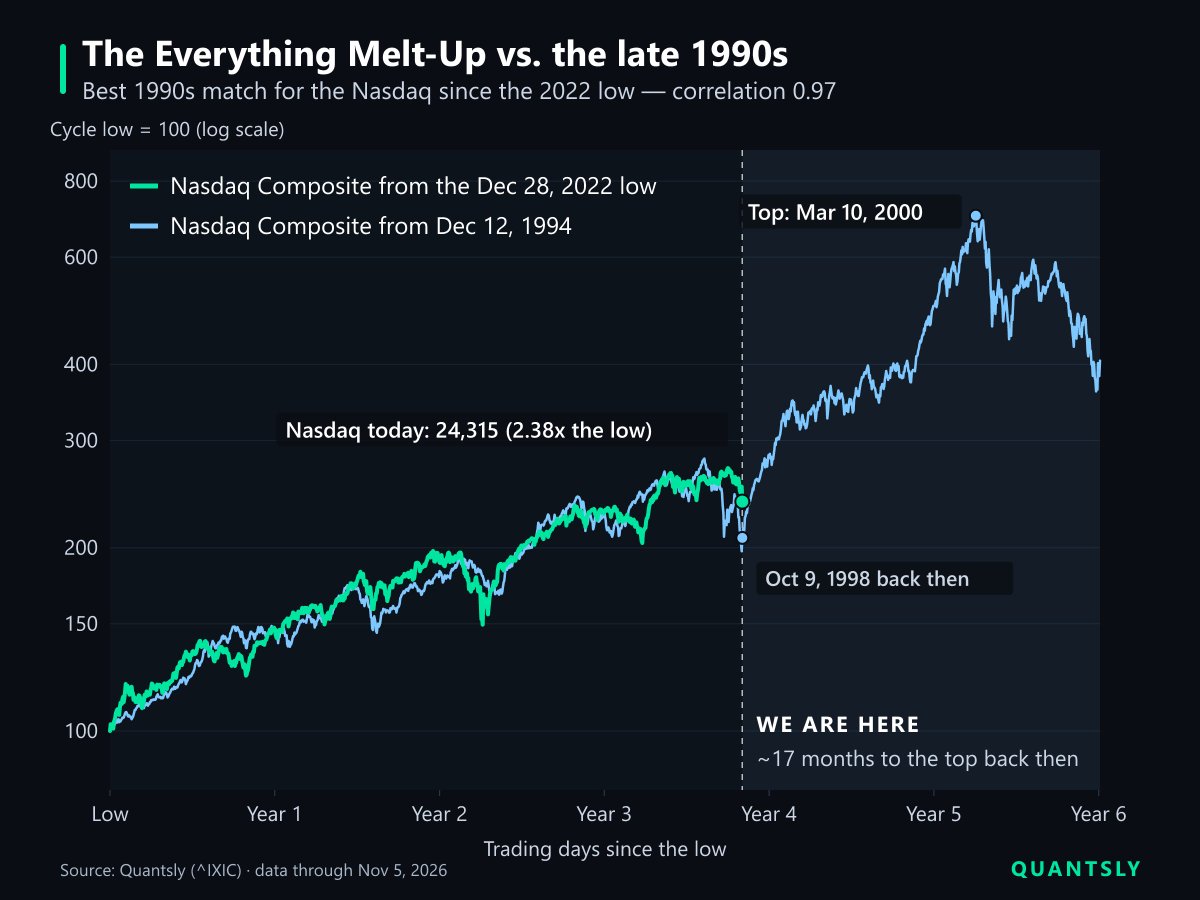
Nasdaq indexed from the 2022 low vs from the 1994 low | Correlation 0.97; today 24,315 (2.38x the low), matching Oct 1998, ~17 months before the March 2000 peak
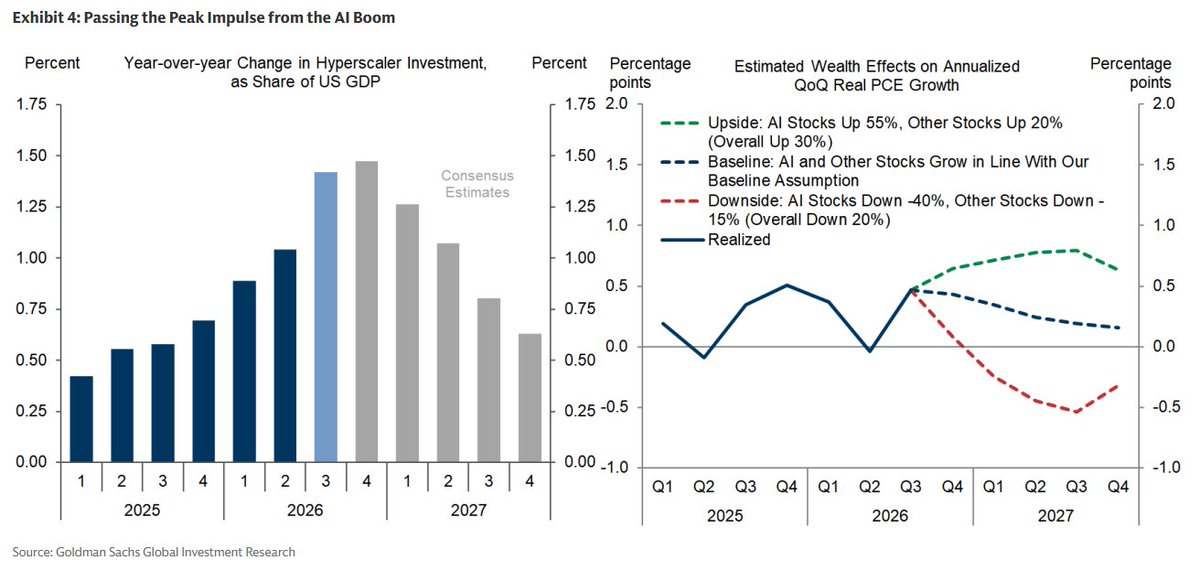
YoY change in hyperscaler investment as a share of US GDP and AI wealth-effect scenarios on PCE growth | Investment contribution peaks near 1.4-1.5% in Q3-Q4 2026, then declines through 2027
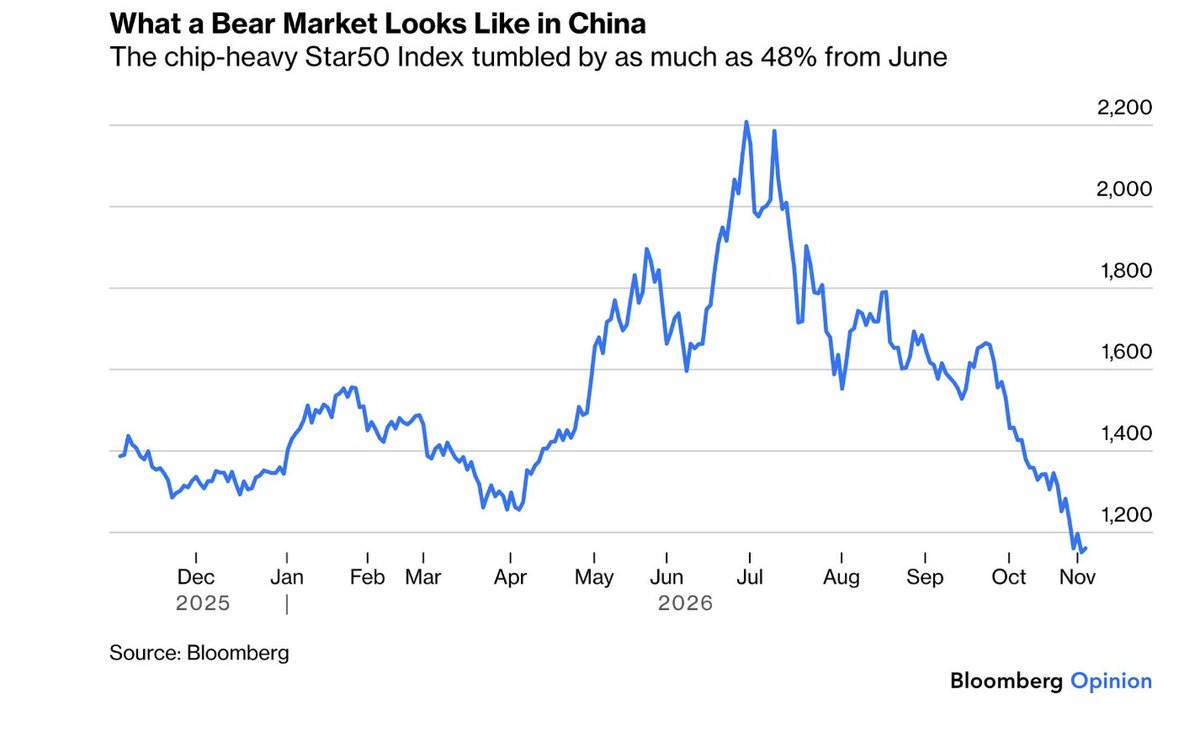
China's Star50 Index, late 2025 to November 2026 | Down as much as 48% from the June-July peak near 2,200, falling below 1,200 in November
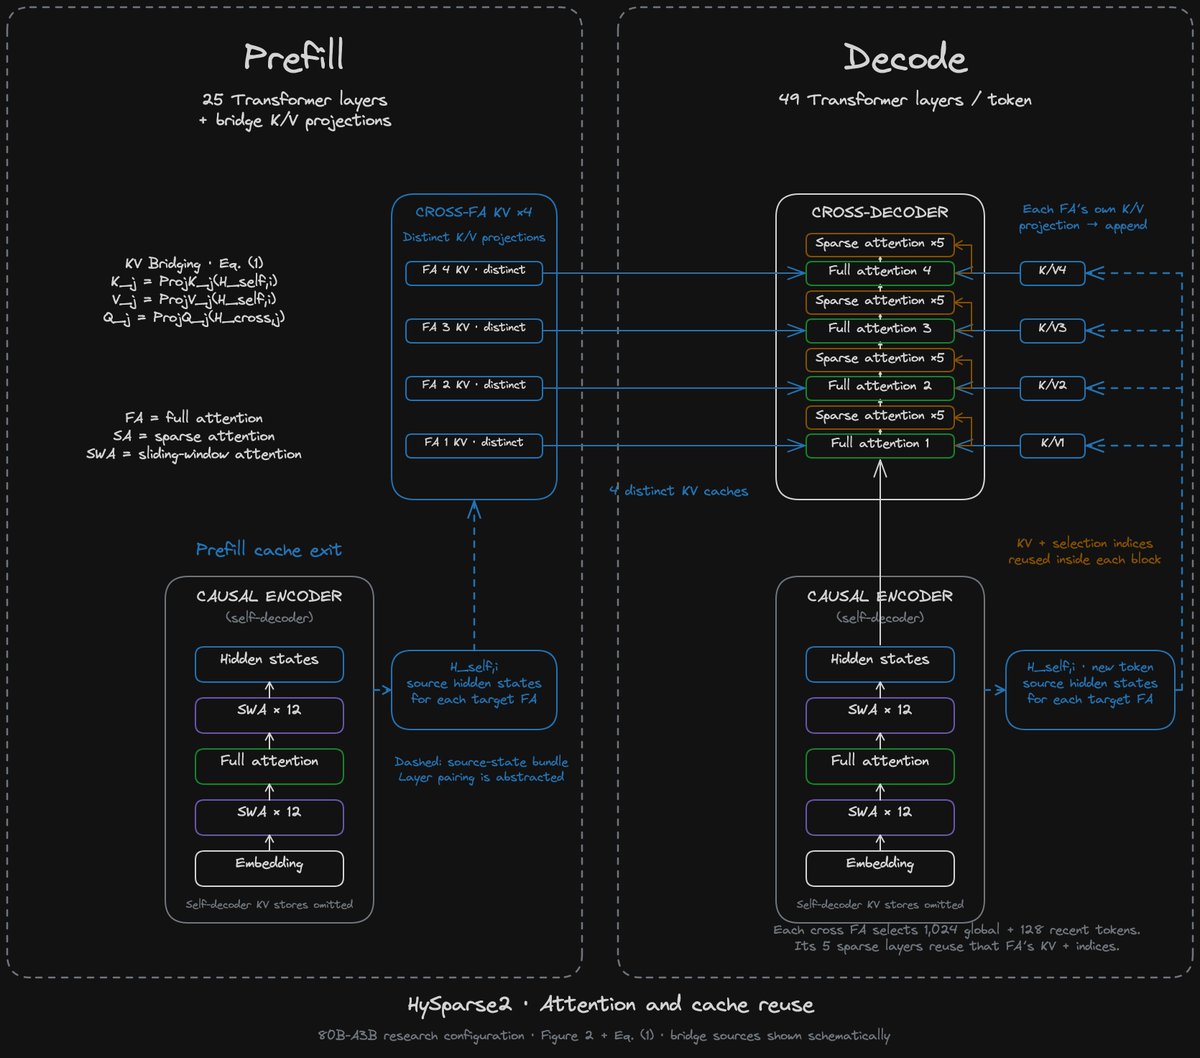
Xiaomi MiMo HySparse2 attention and cache reuse | Prefill runs 25 layers and decode 49; each cross FA selects 1,024 global plus 128 recent tokens
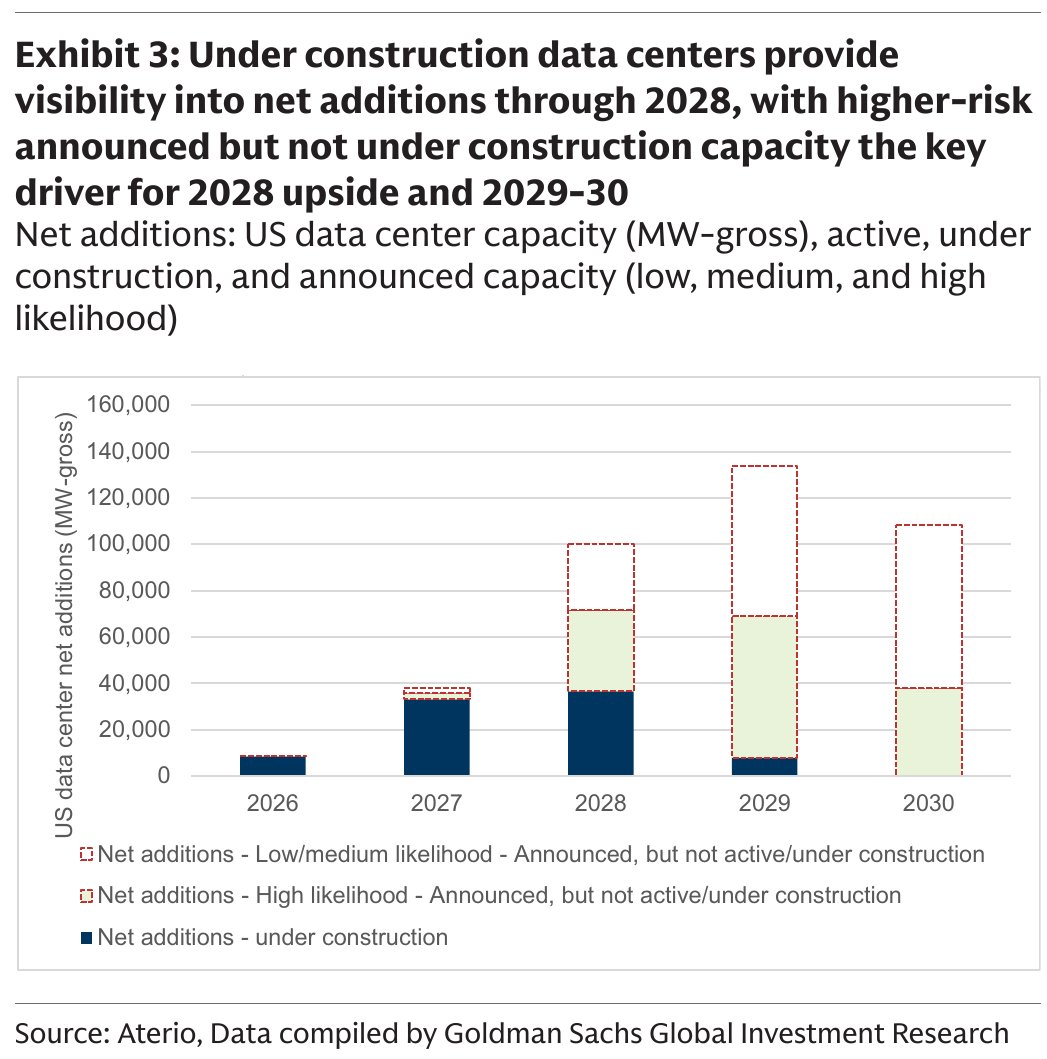
US data-center net additions (MW-gross), 2026-2030 | Under-construction capacity peaks near 36,000 MW in 2028; 2029's ~135,000 MW total leans on announced projects
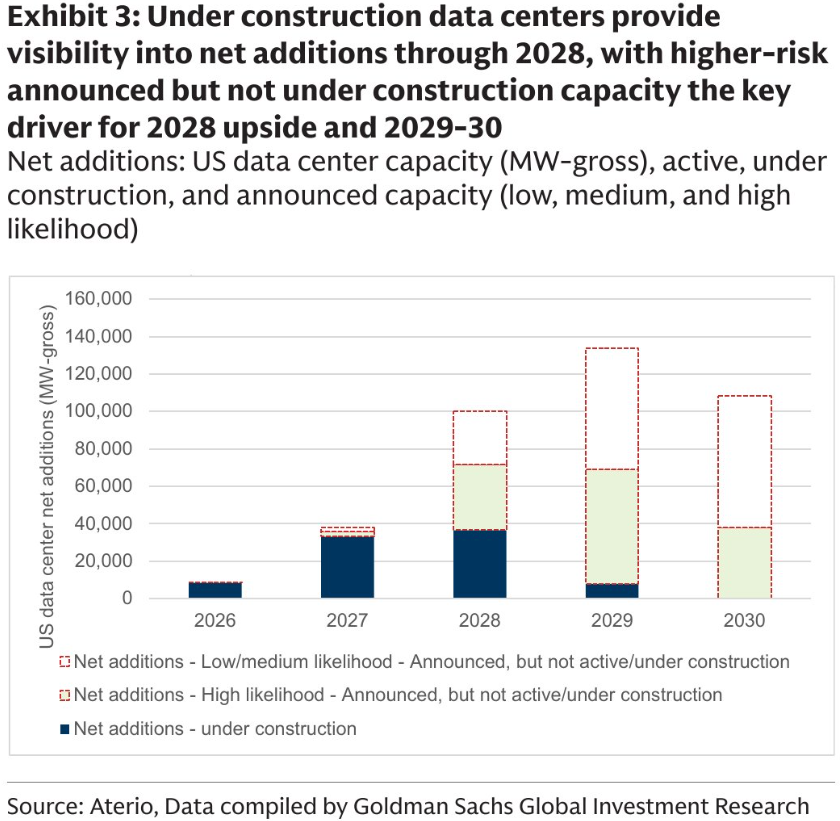
US data center capacity net additions (MW-gross), 2026-2030 | ~100,000 MW in 2028 and ~135,000 MW in 2029; announced capacity drives 2029-30
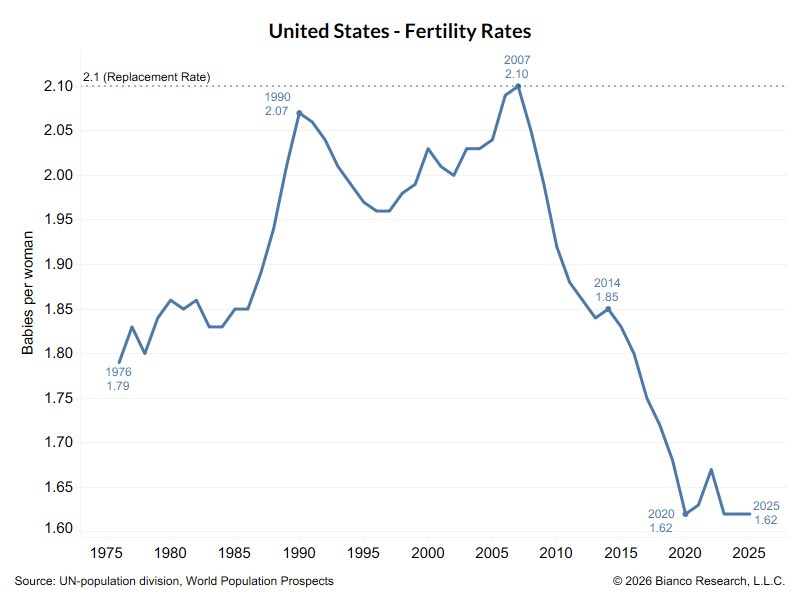
US total fertility rate, 1976-2025 | Peaked at 2.10 in 2007, down to 1.62 by 2025 — below the 2.1 replacement rate
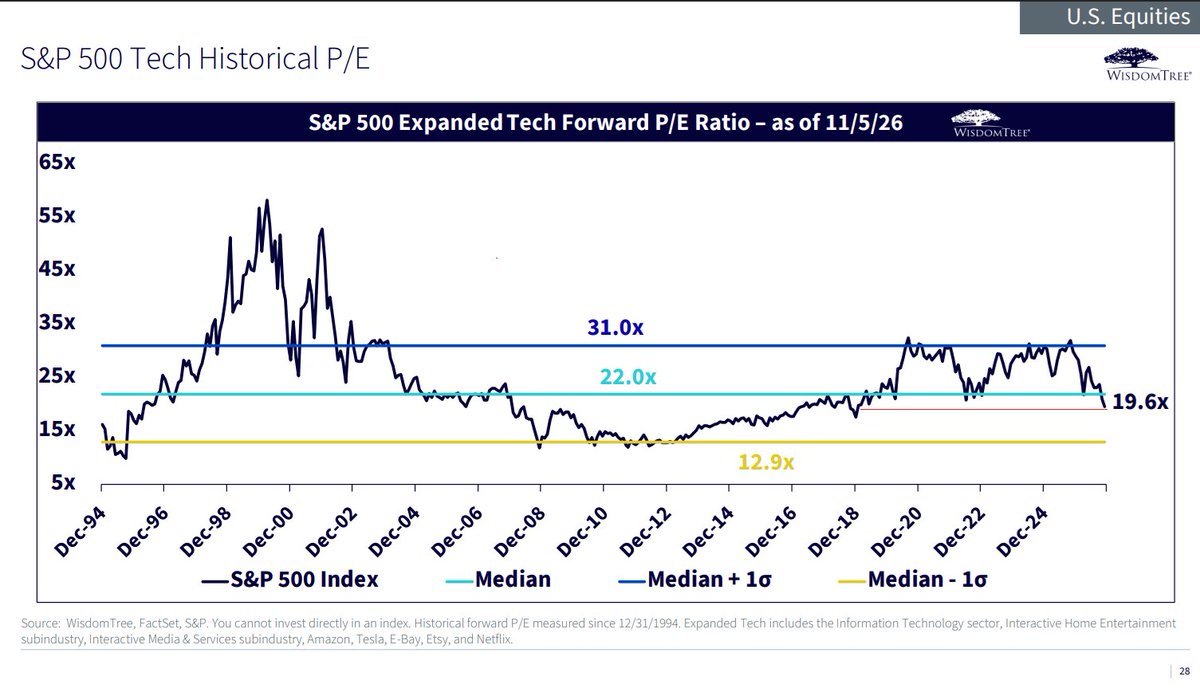
S&P 500 expanded tech forward P/E ratio since 1994 | Now 19.6x, below the 22.0x median and the lowest in nearly eight years
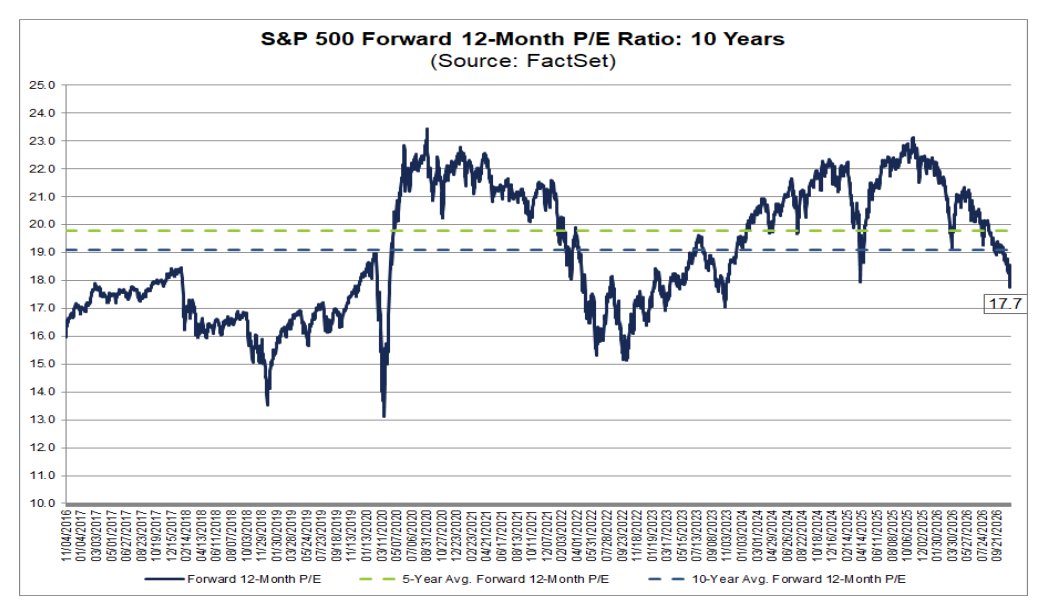
S&P 500 forward 12-month P/E ratio, last 10 years | Now 17.7x, below the 5-year average of about 19.8x and the 10-year average of about 19x, a 3-year-plus low
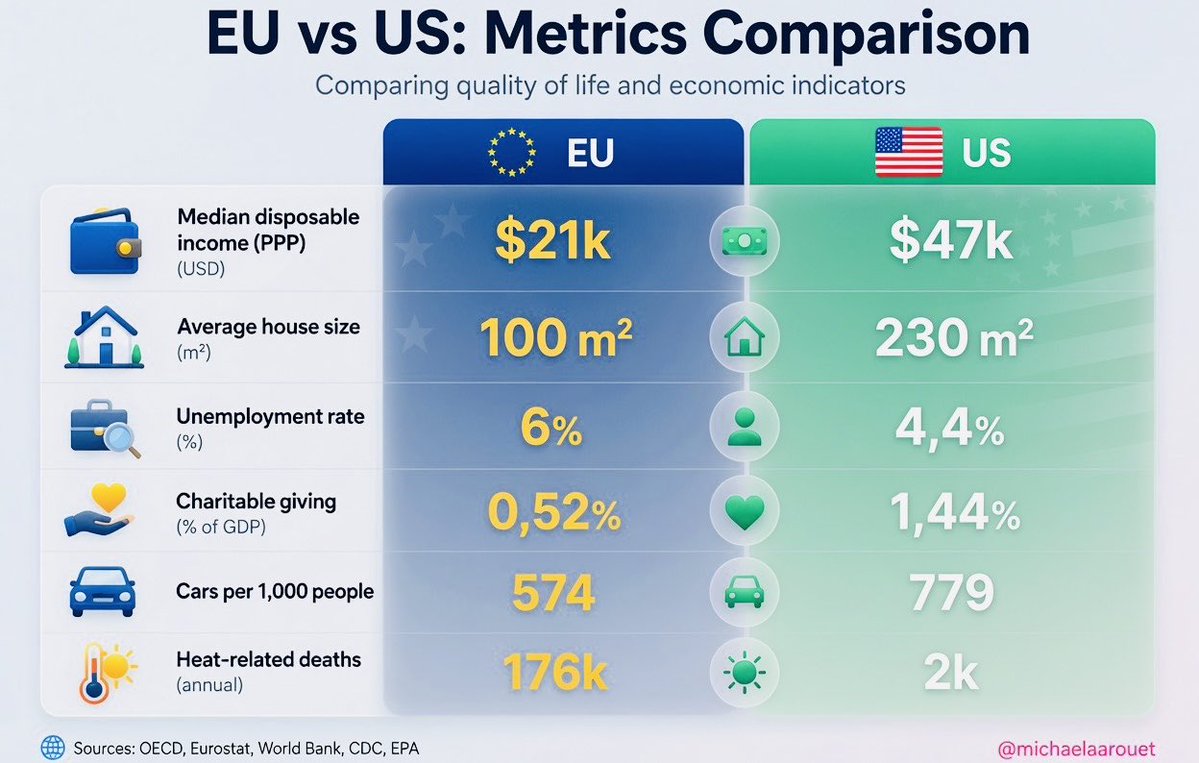
EU vs US quality-of-life and economic indicators | Median disposable income (PPP) $21k in the EU vs $47k in the US; average home 100 vs 230 m²
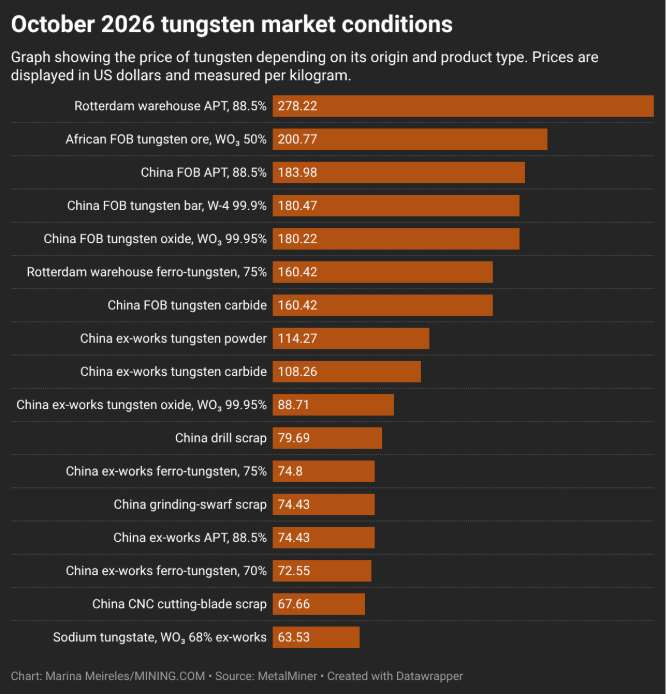
Tungsten prices by origin and product type (US$/kg), Oct 2026 | Rotterdam warehouse APT leads at $278/kg vs China FOB APT at $184/kg
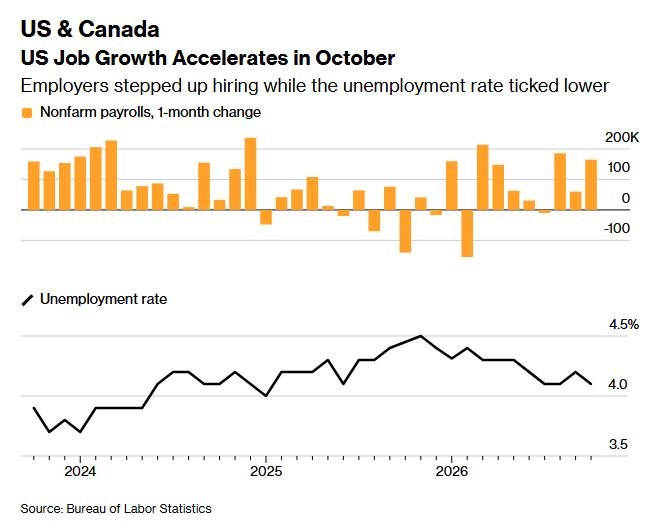
US monthly nonfarm payroll change and the unemployment rate | October hiring rebounded above 100k while the jobless rate eased toward ~4.0%
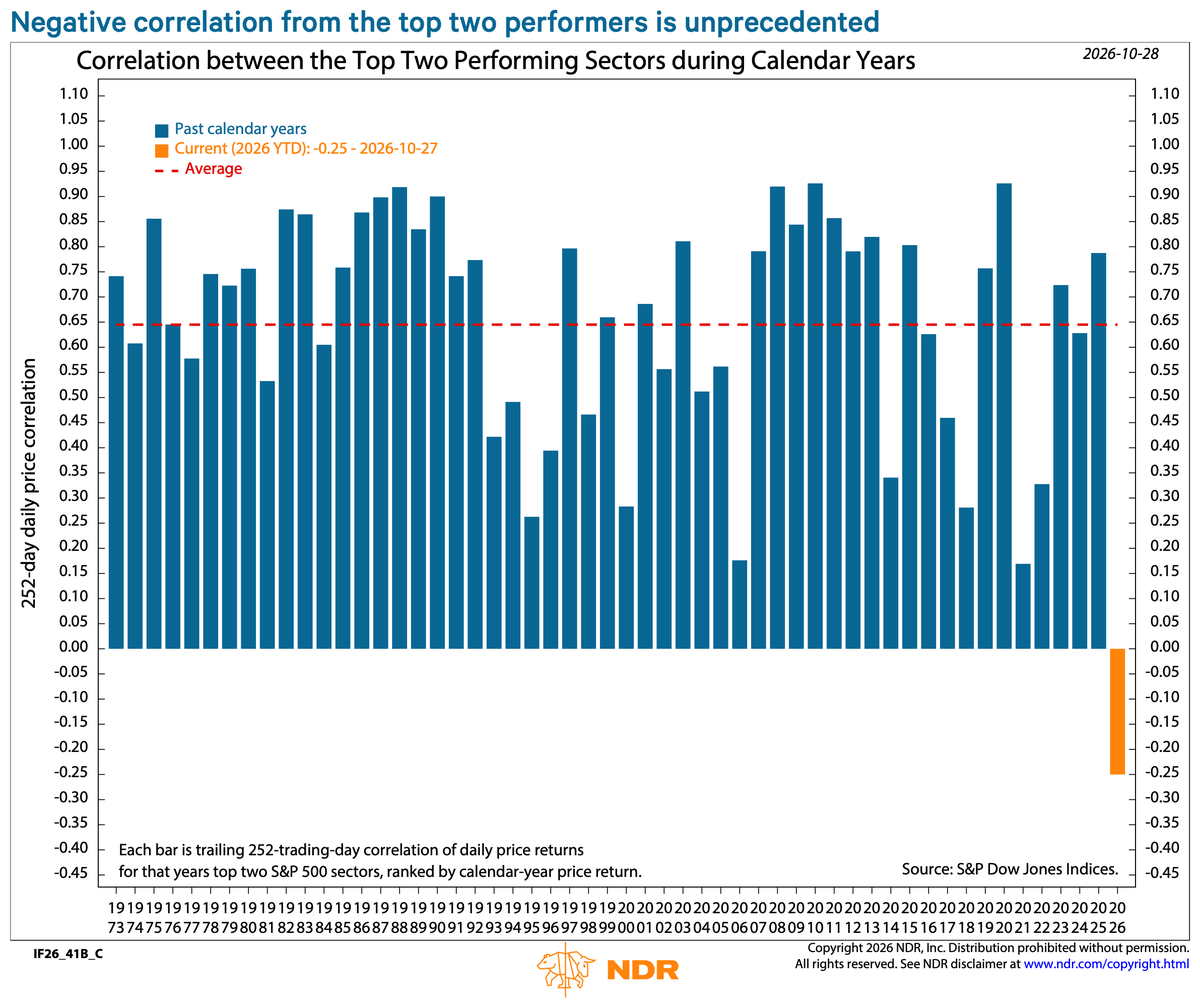
252-day correlation of the top two S&P 500 sectors by calendar year, 1973-2026 | 2026 YTD at -0.25, the first negative reading in 54 years
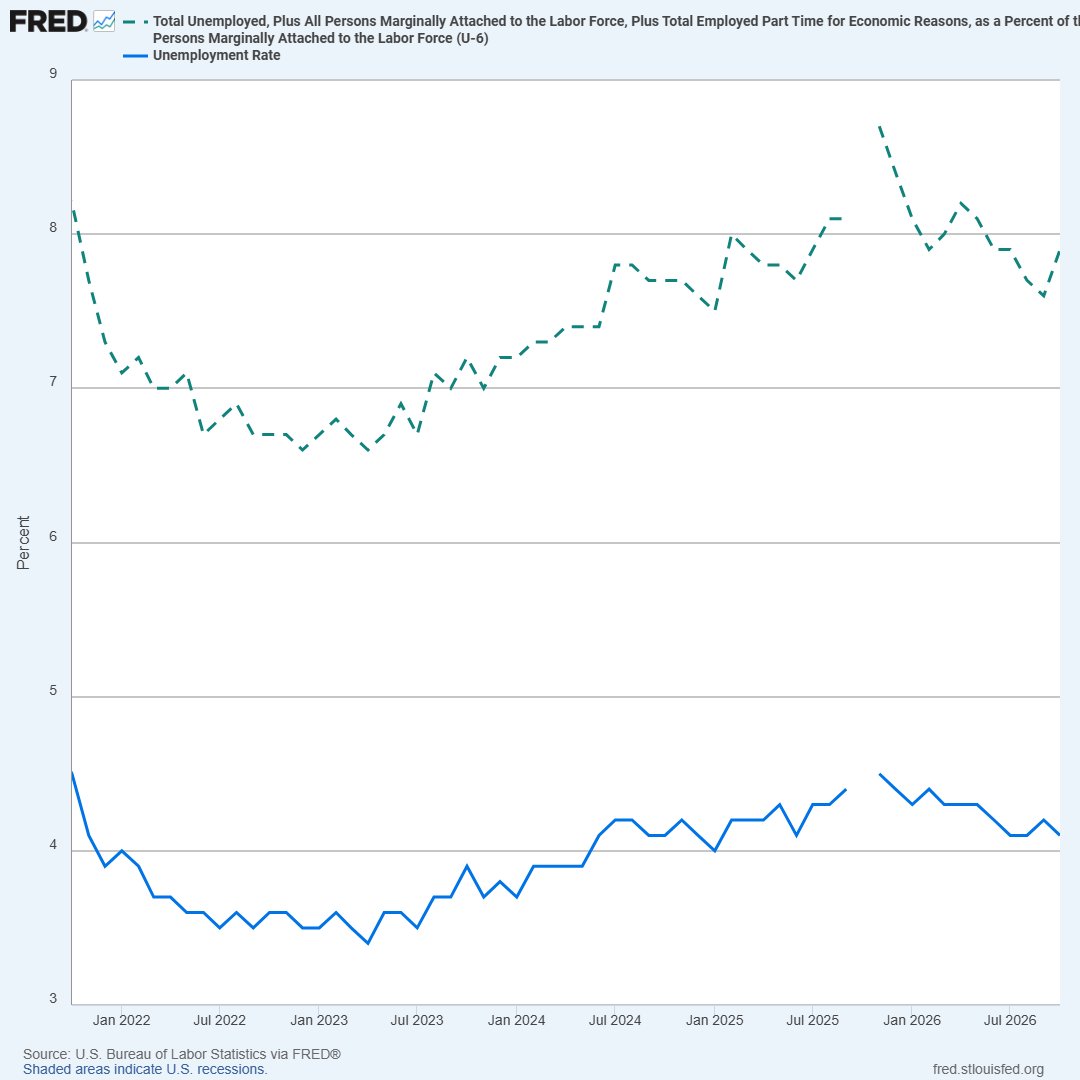
US headline unemployment rate and the broader U-6 rate | October: unemployment 4.1%, U-6 up to 7.9%, the two measures diverging recently
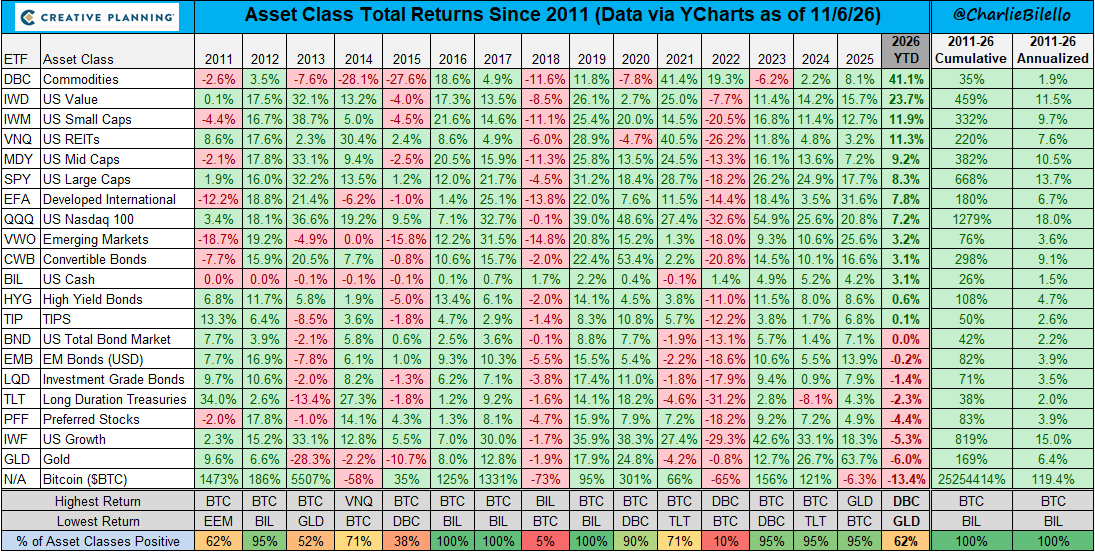
Annual total returns by asset class, 2011-2026 | In 2026 YTD gold -6% and bitcoin -13% lag, while commodities lead at +41%
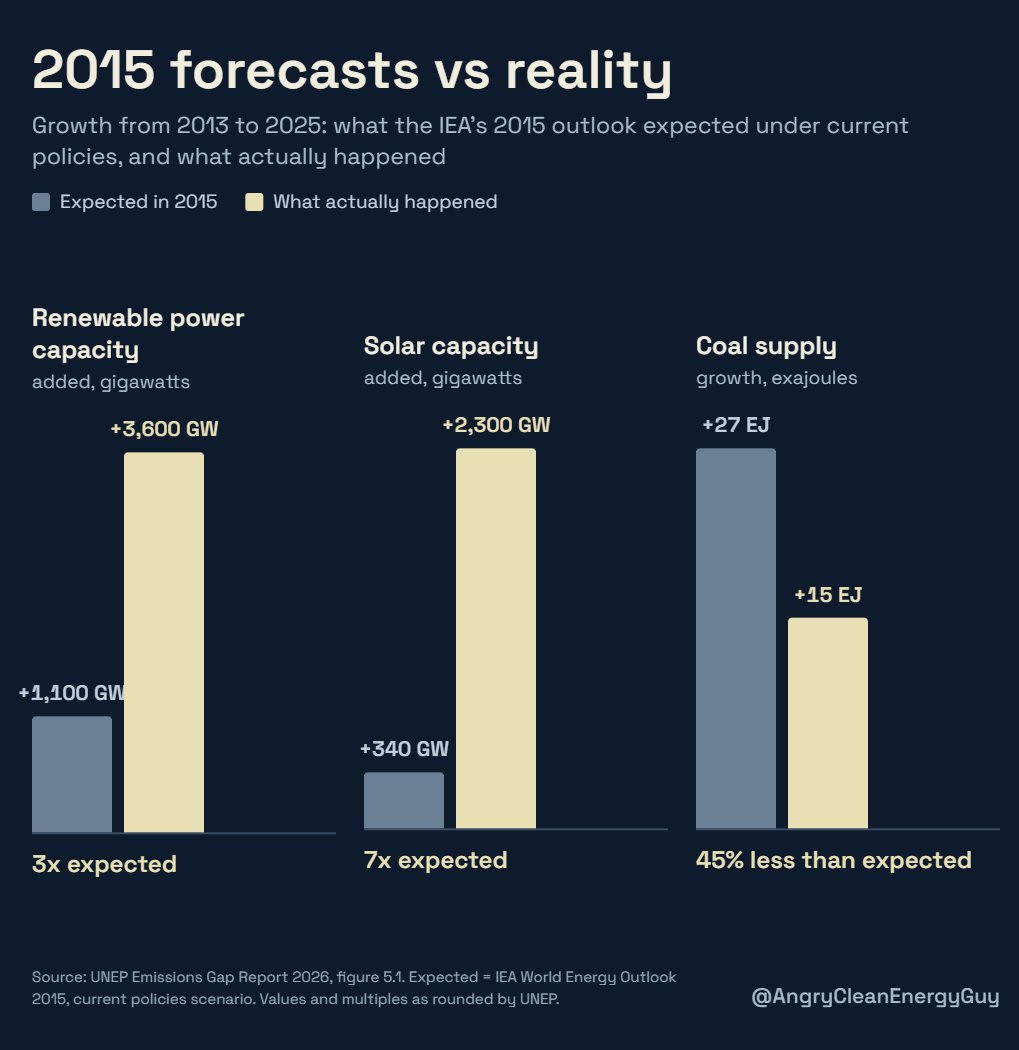
Energy growth 2013-2025, IEA's 2015 expectation vs actual | Renewable additions hit +3,600 GW, 3x expected, and solar +2,300 GW, 7x expected
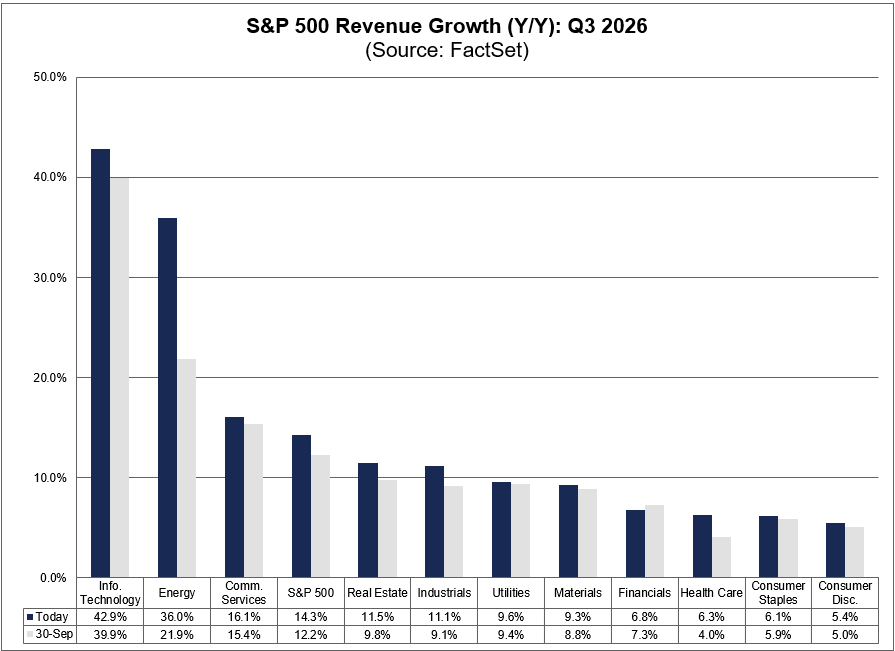
S&P 500 Y/Y revenue growth by sector, Q3 2026 | Info Tech 42.9% and Energy 36.0% lead; the index at 14.3%, above last month's reading
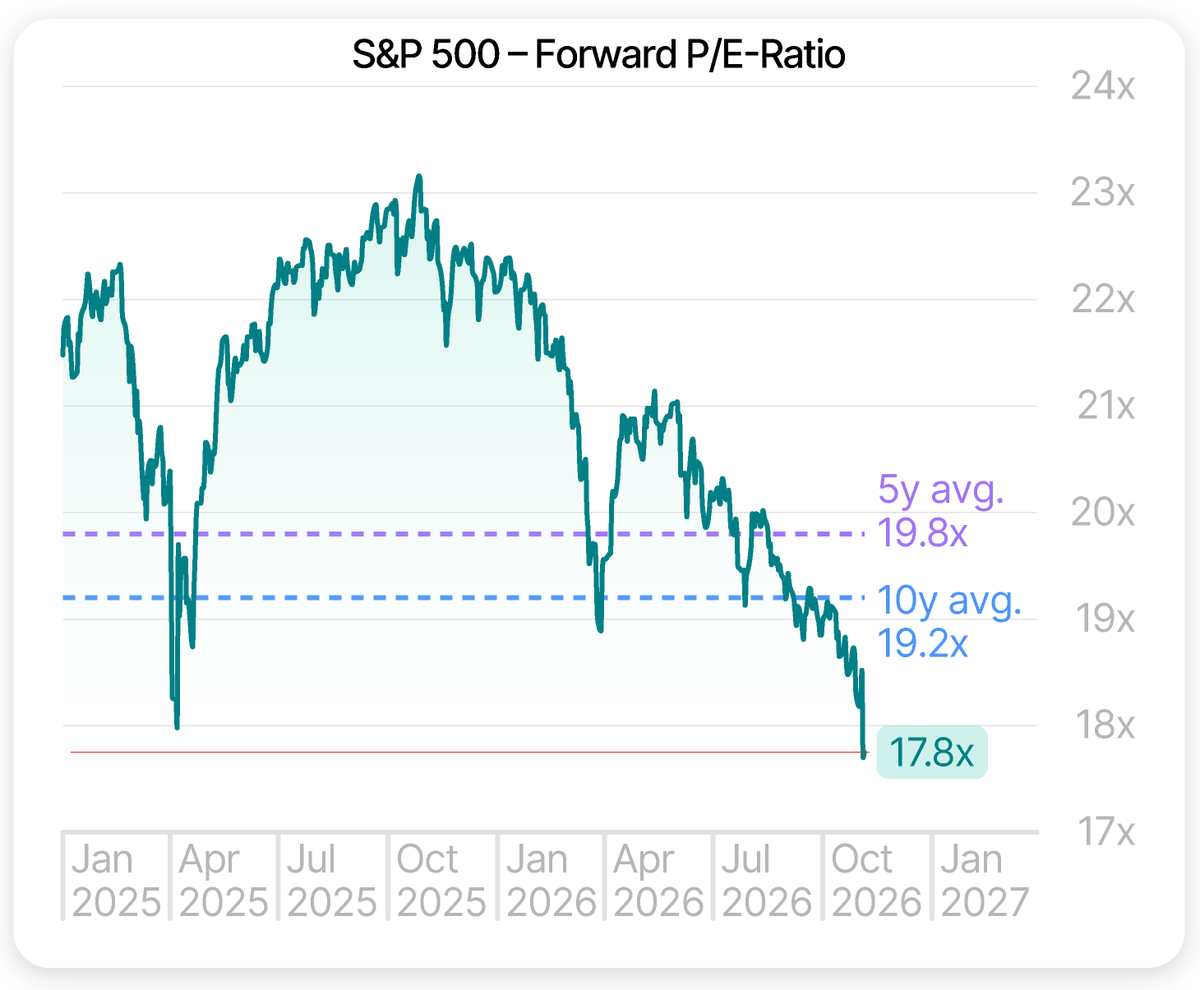
S&P 500 forward P/E ratio, 2025-2026 | Now 17.8x, below the 5-year average of 19.8x and the 10-year average of 19.2x
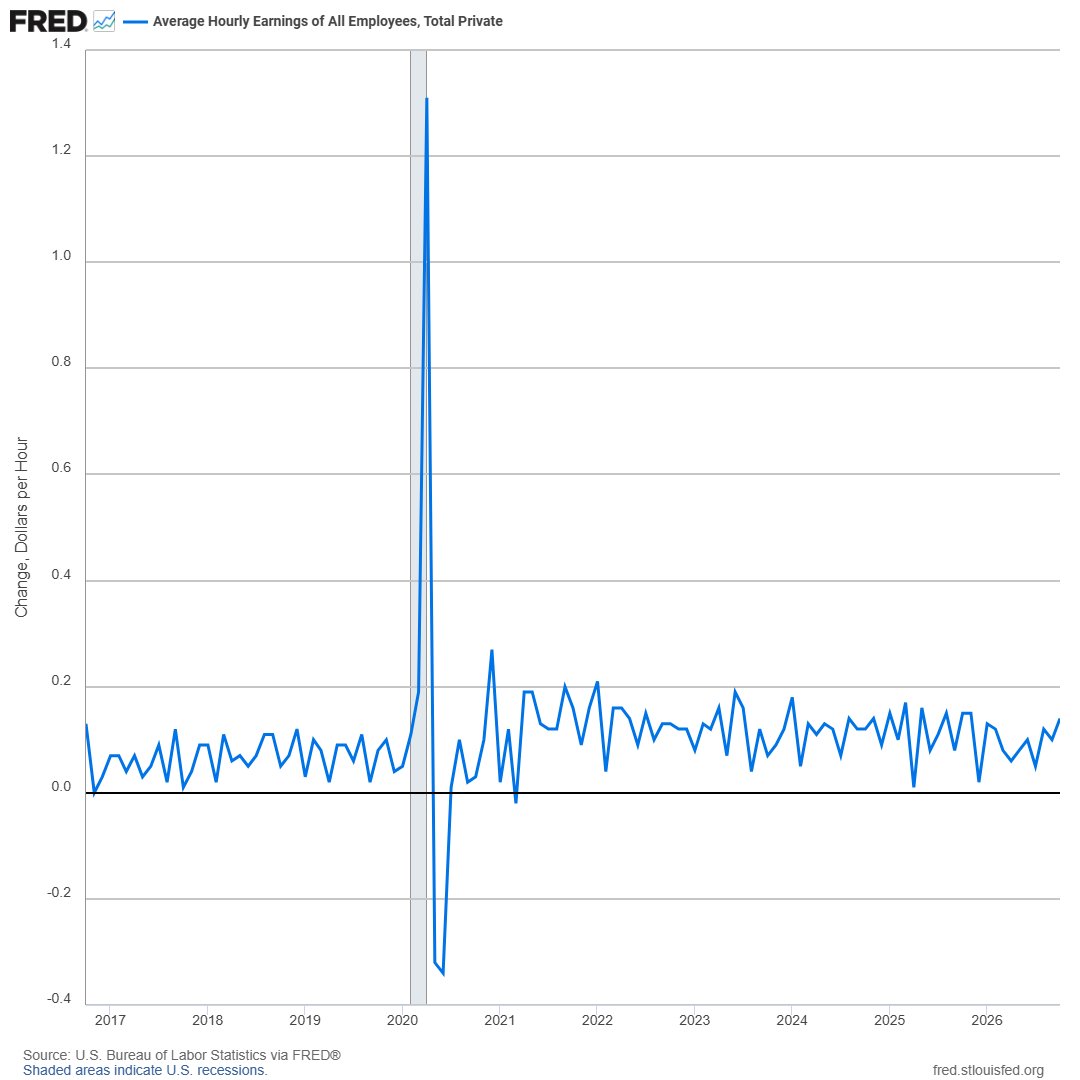
Monthly change in US private-sector average hourly earnings (dollars) | October rose about $0.14 to $38.00, up 3.1% year over year
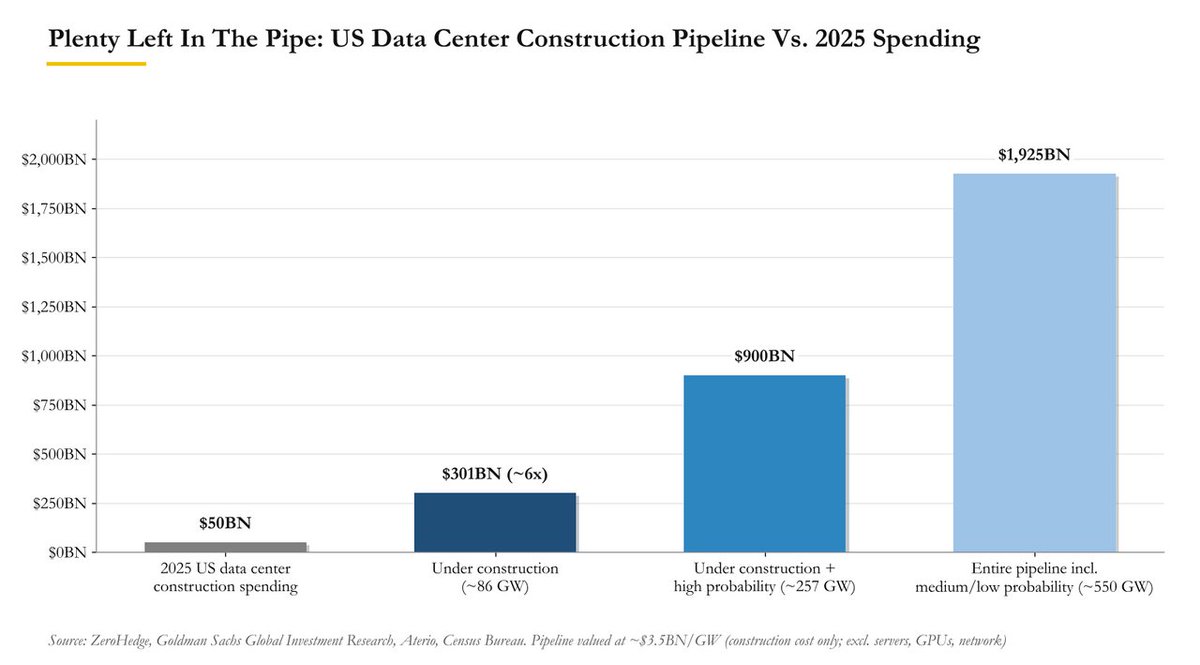
US data center construction pipeline vs 2025 spending ($bn) | Under construction ~$301bn (~6x 2025's $50bn); the entire pipeline reaches $1,925bn
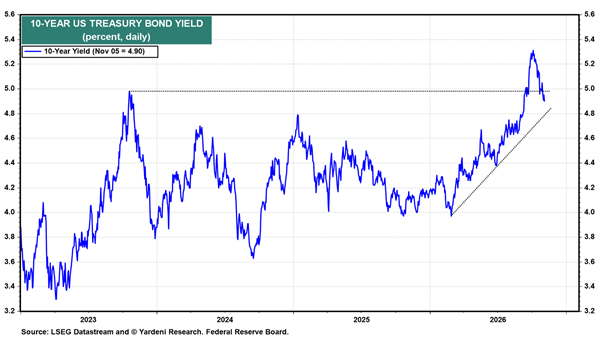
US 10-year Treasury yield, daily, 2023-2026 | 4.90% on Nov 5, pulling back slightly after rising along the uptrend line
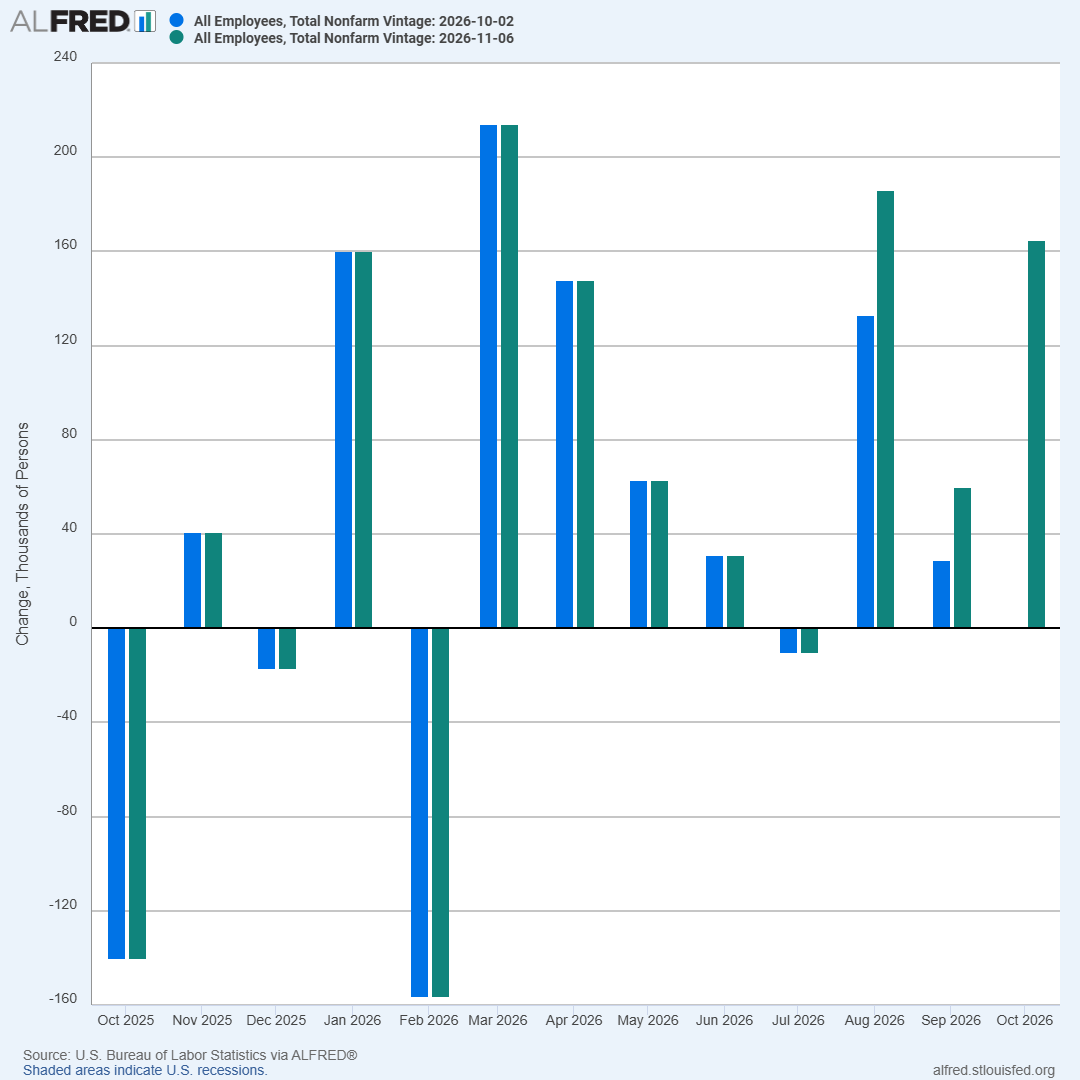
US monthly nonfarm payroll change, two data vintages | October added 165,000, a third straight monthly gain, with August and September revised up a combined 84,000
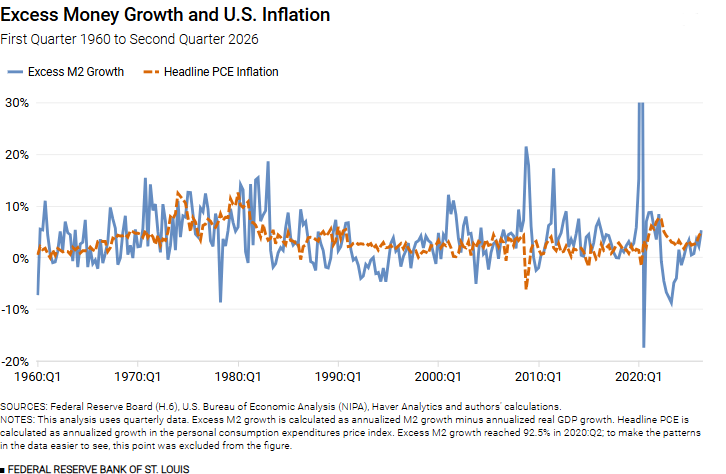
Excess M2 growth vs headline PCE inflation, quarterly, 1960-2026 | Excess M2 hit 92.5% in 2020 Q2, excluded from the chart to keep the pattern visible
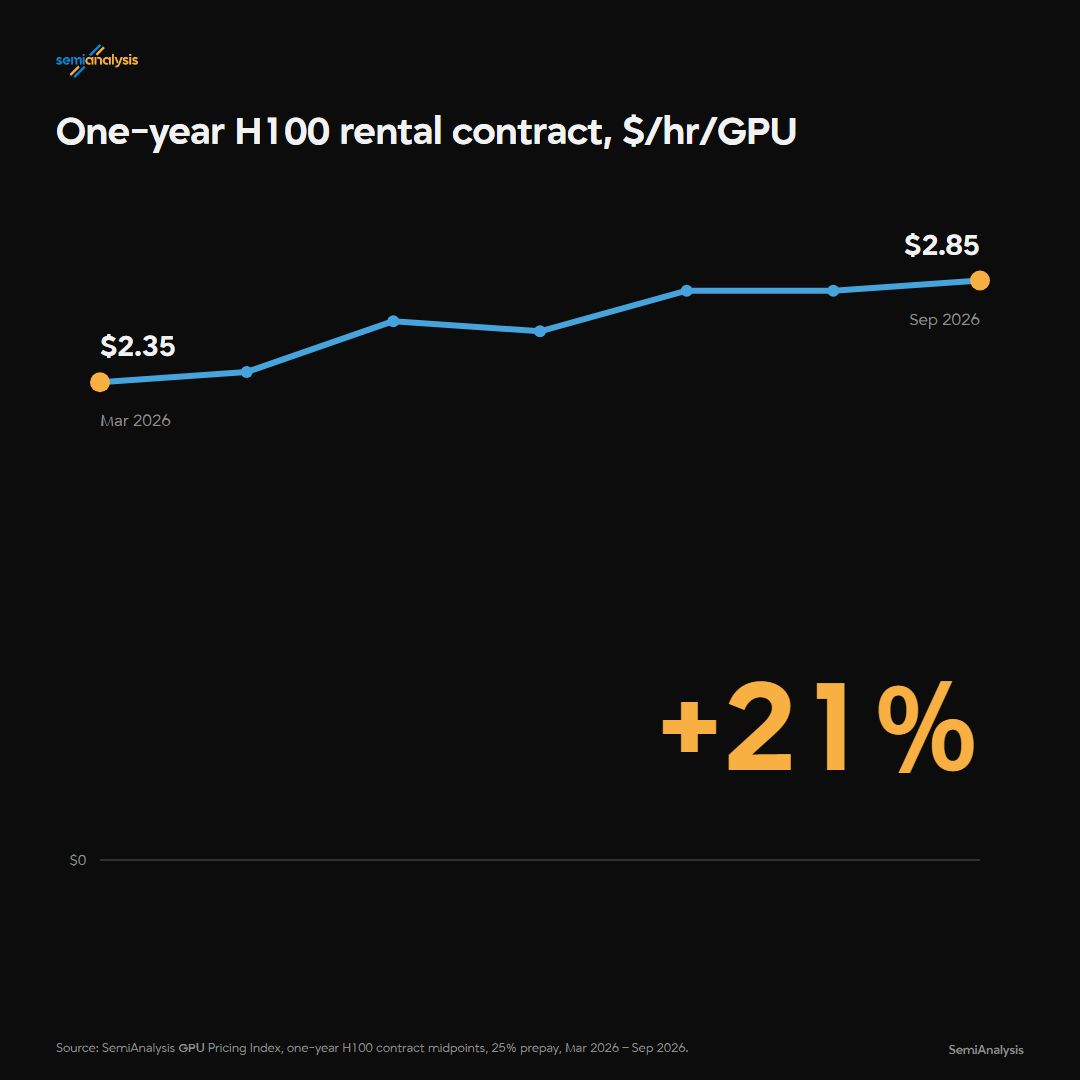
One-year H100 rental contract price, 2026 | Up from $2.35/hr in March to $2.85/hr in September, a 21% gain in six months
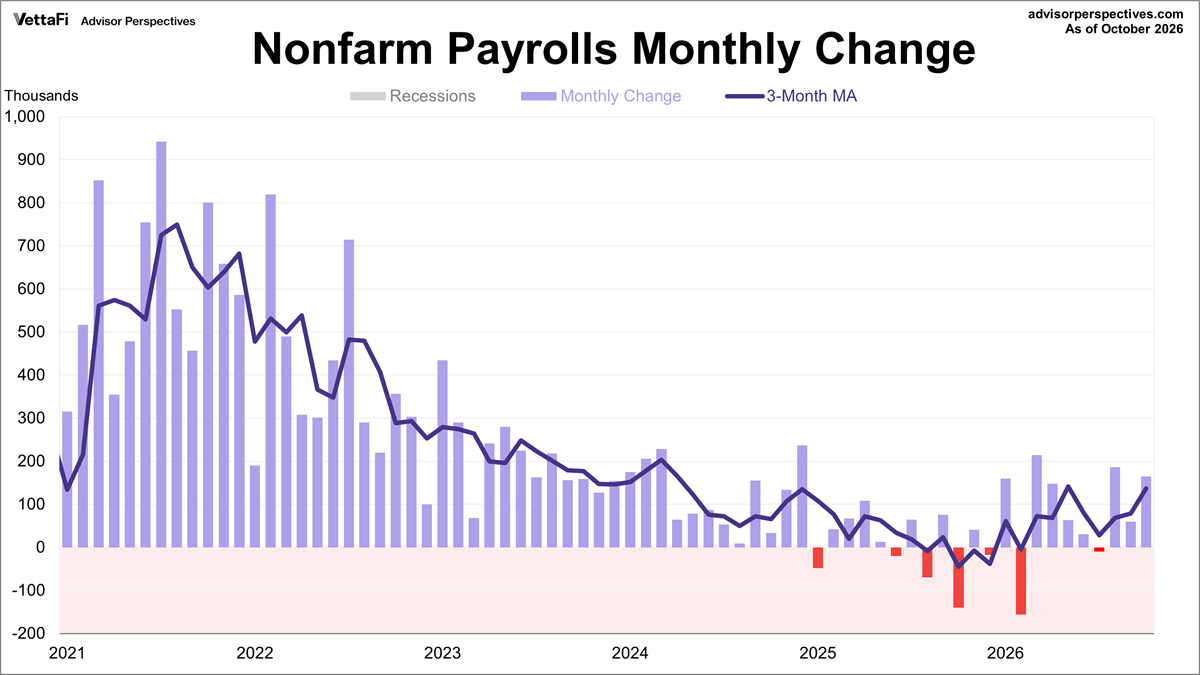
US nonfarm payrolls monthly change and 3-month moving average, 2021-2026 | October rebounded above 150k, lifting the 3-month average off its mid-year low
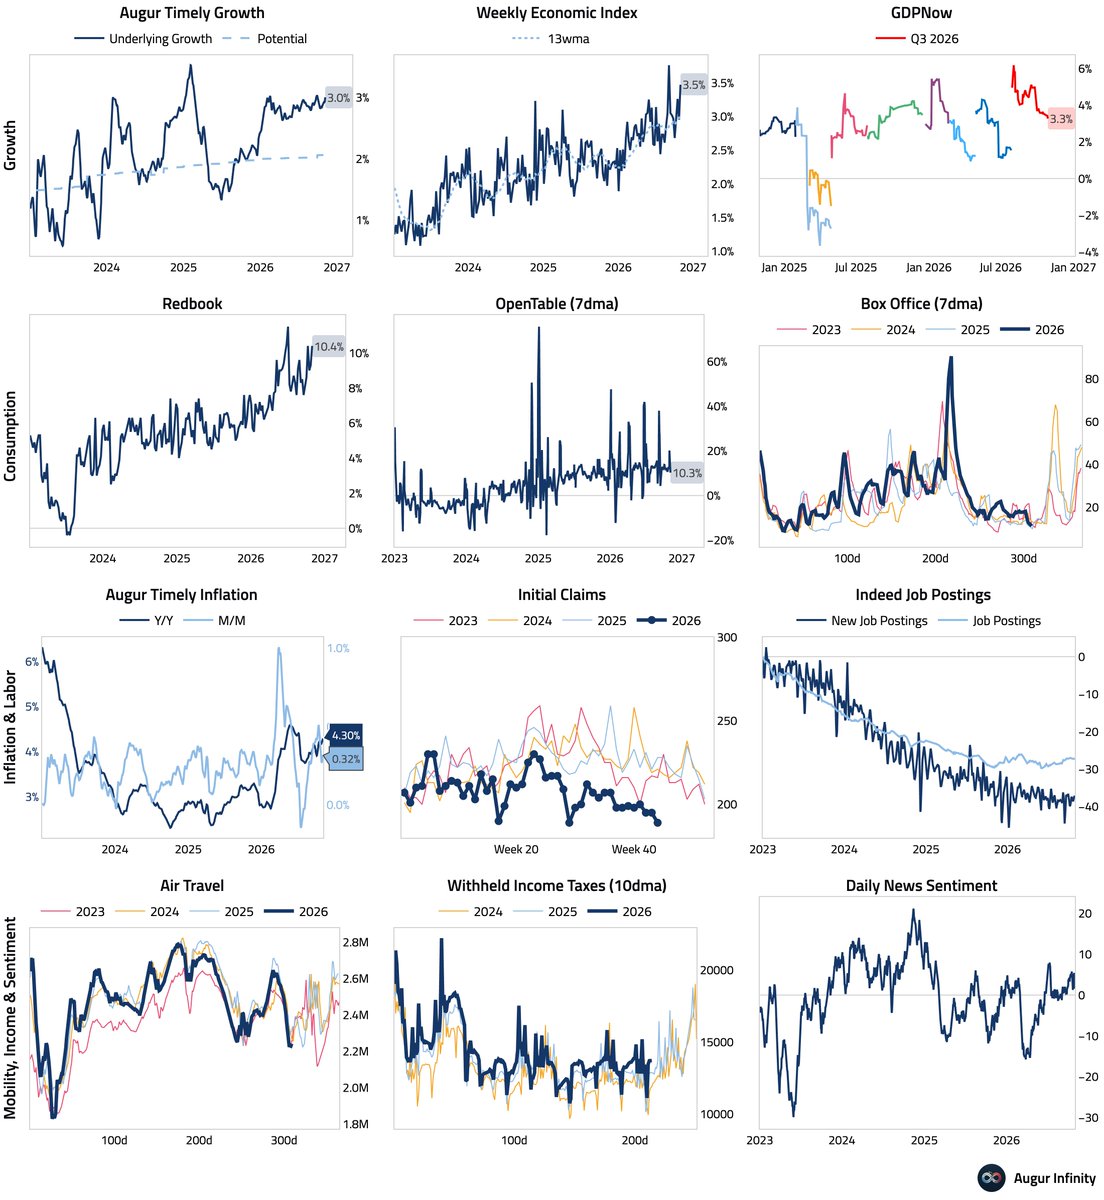
US daily and weekly high-frequency economic indicators | Real-time growth near 3%, inflation Y/Y at 4.3%, with initial claims and job postings both weakening
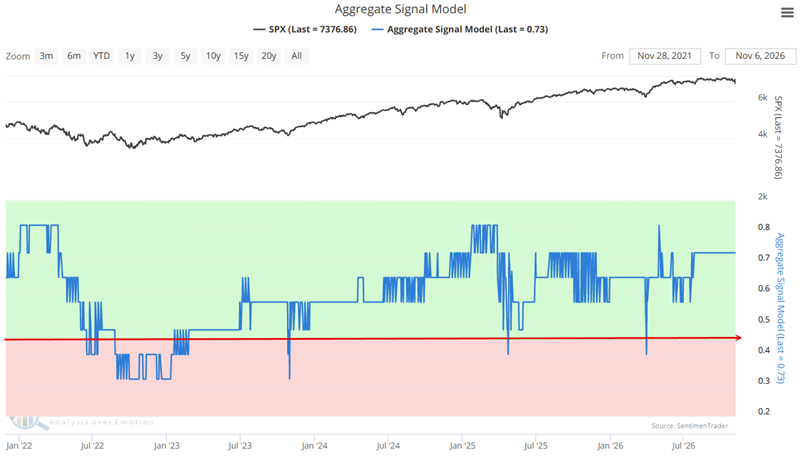
SPX vs the Aggregate Signal Model, 2022-2026 | The model's latest reading of 0.73 sits in the green favorable zone, with SPX at 7,376.86
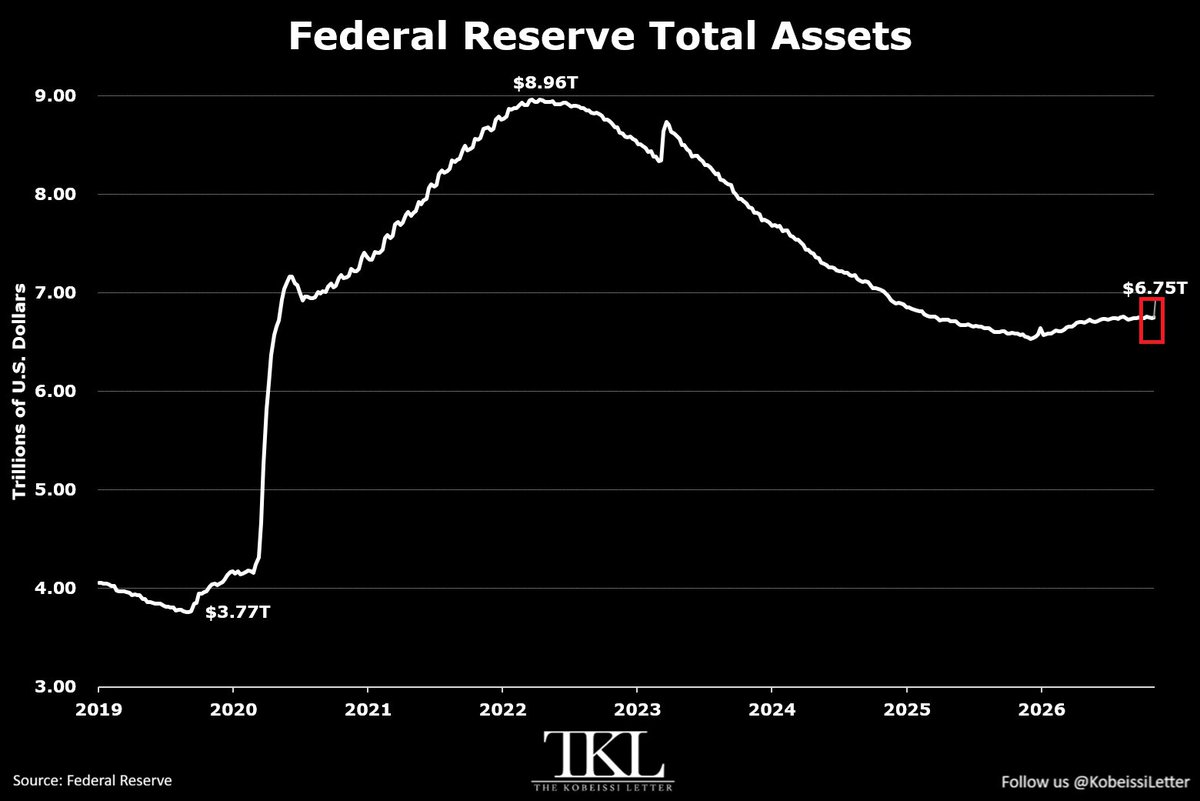
Federal Reserve total assets, 2019-2026 ($ trillions) | Now $6.75T, down from the 2022 peak of $8.96T but rising again since the late-2025 low
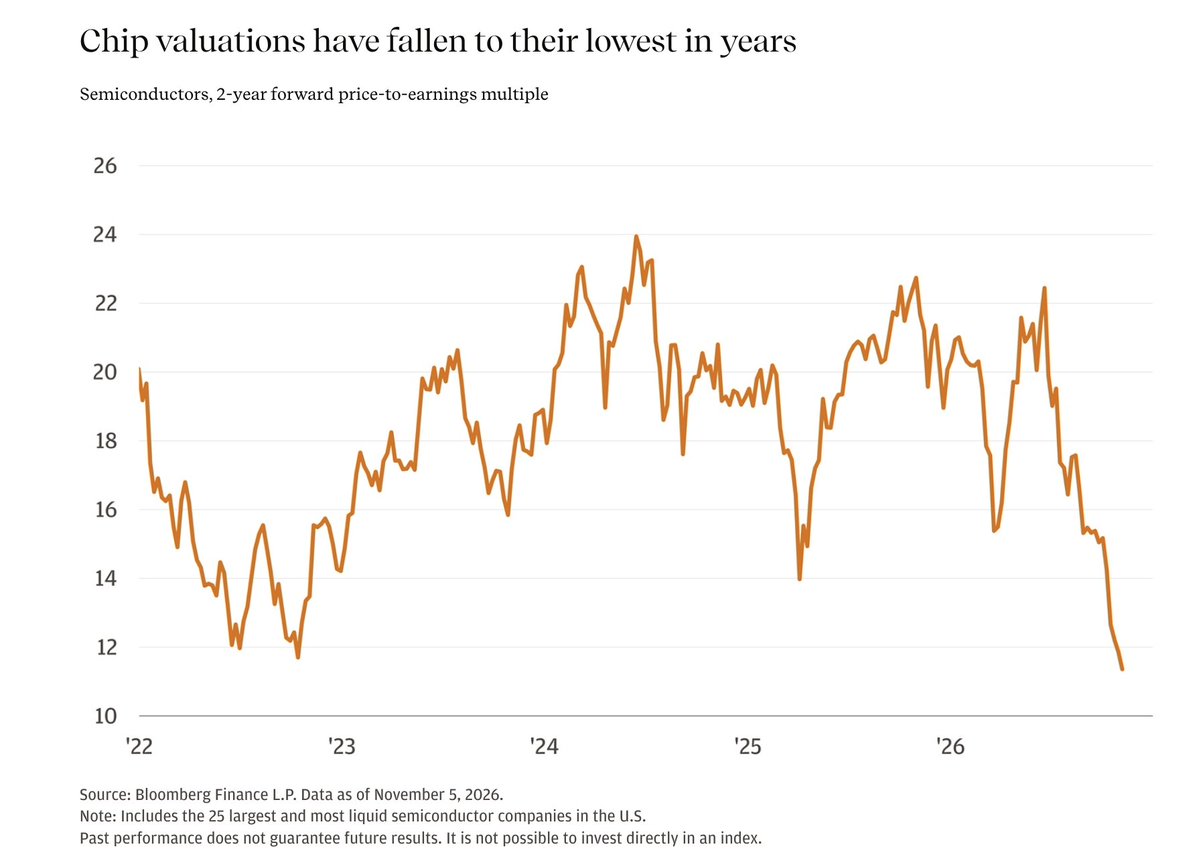
US semiconductor index 2-year forward P/E, 2022-2026 | Now about 11.4x, down from a June peak of 22.5x, the lowest in years
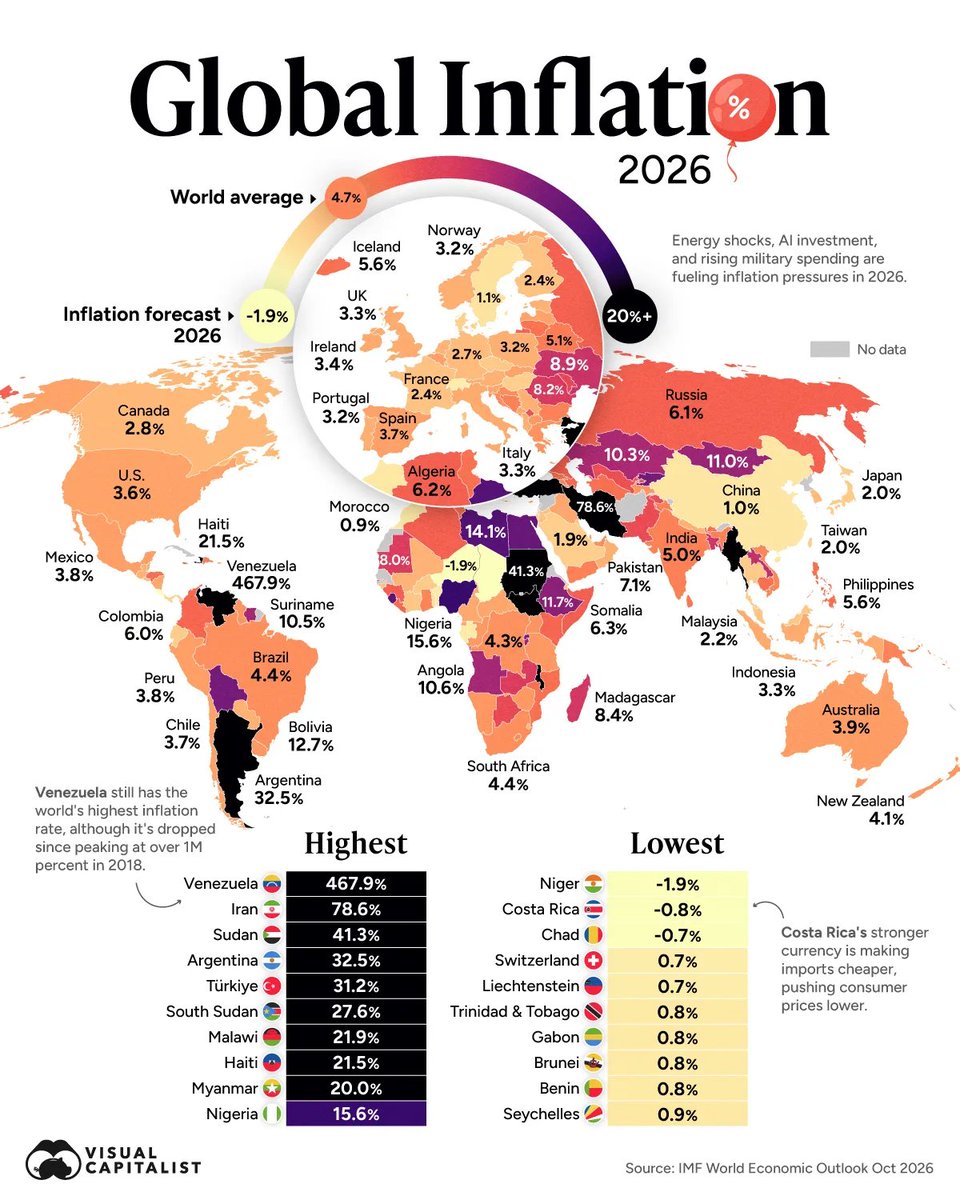
2026 inflation rates by country | World average 4.7%, US 3.6%, China 1.0%; Venezuela highest at 467.9%, Niger lowest at -1.9%
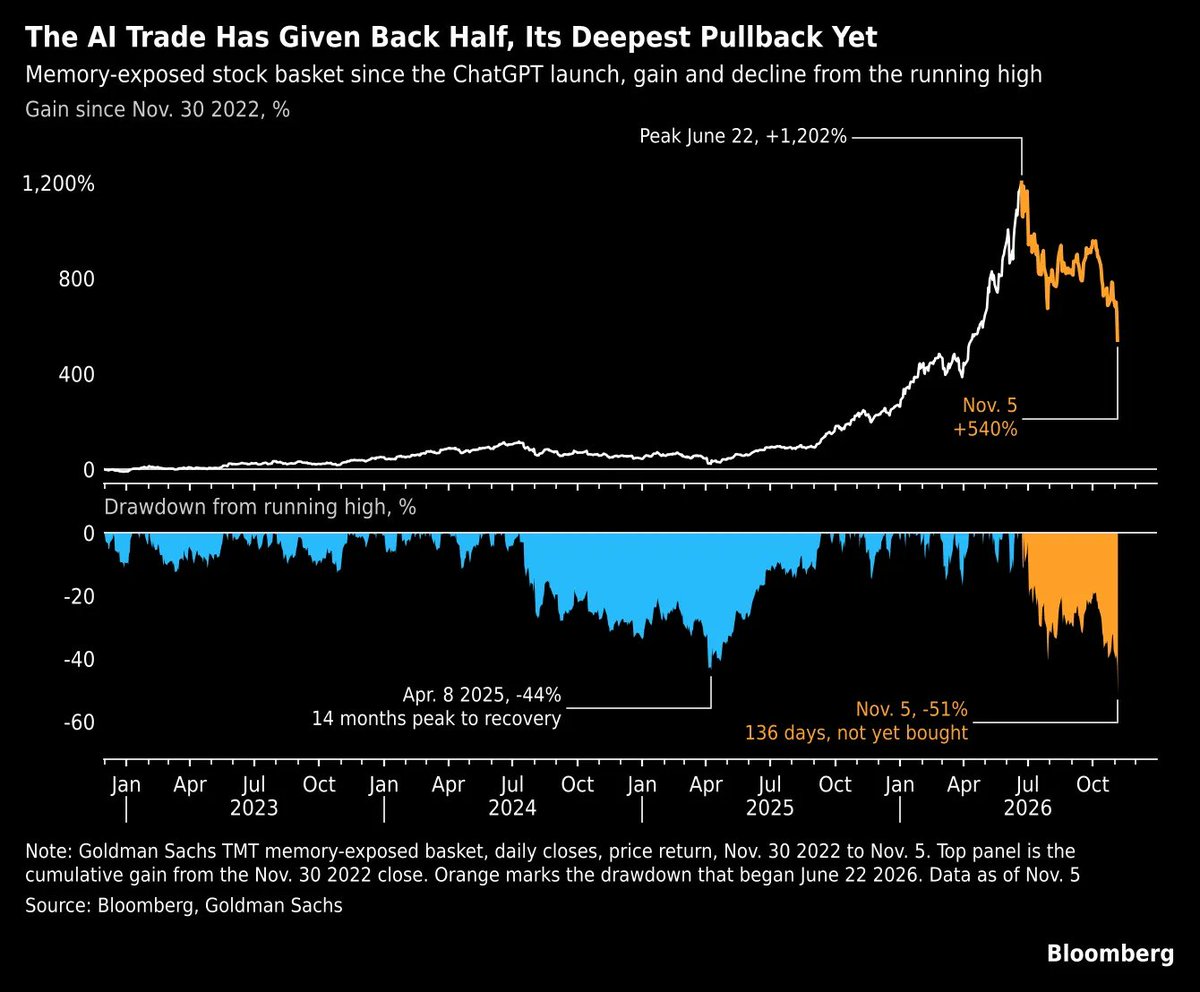
Goldman Sachs memory-exposed stock basket, 2022-2026 | Peaked at +1,202% on June 22, down to +540% by Nov 5, a 51% drawdown from the high
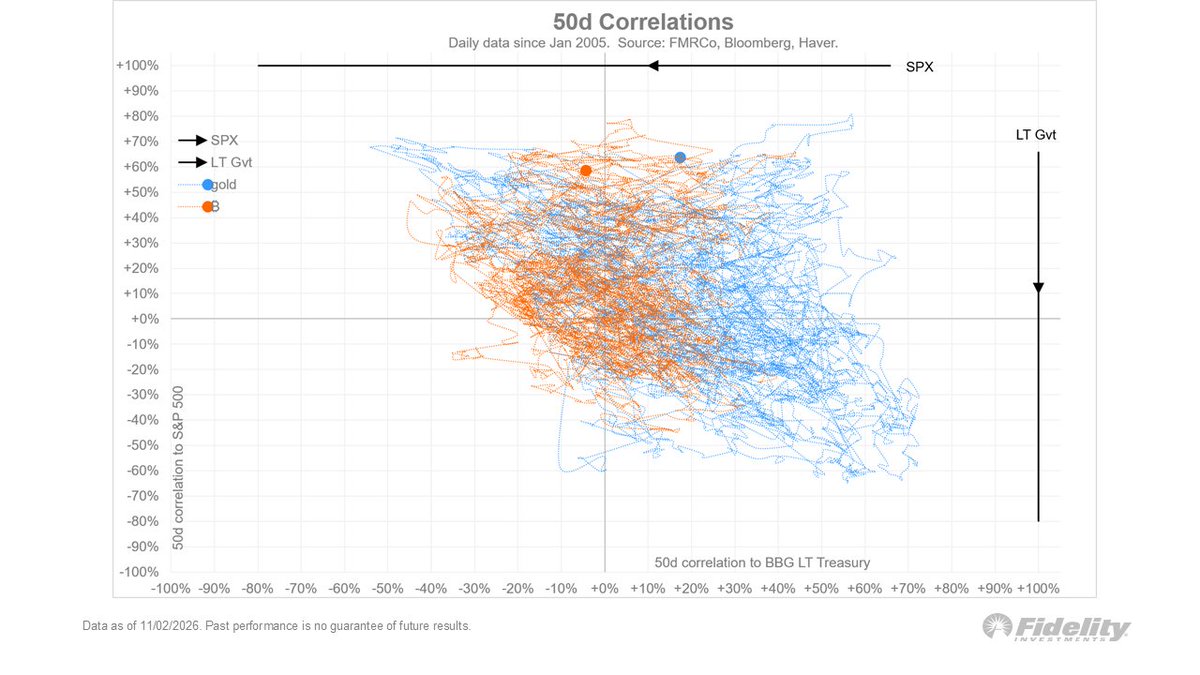
Gold and Bitcoin 50-day correlation to stocks and bonds, since 2005 | Both now correlate about +60% with the S&P 500, moving with risk assets lately
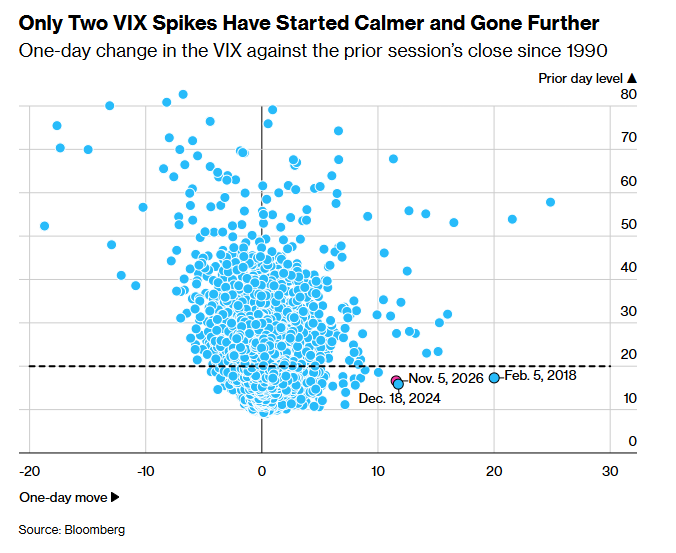
One-day change in the VIX vs the prior session's close, since 1990 | Only two spikes have started calmer and gone further than Nov 5, 2026
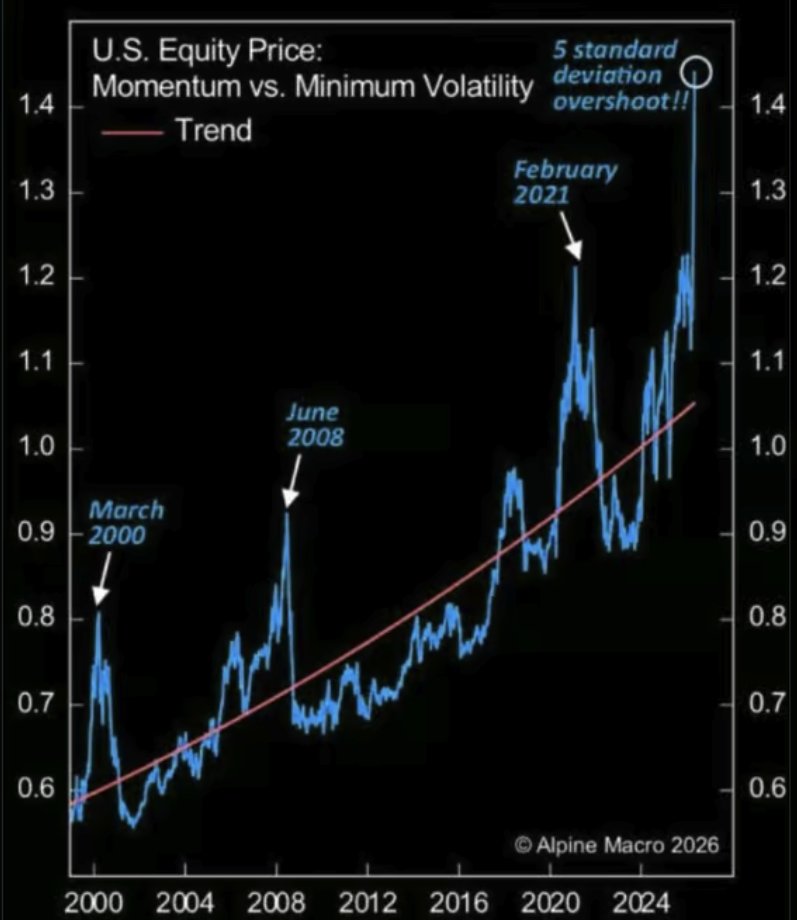
US equity momentum-versus-minimum-volatility price ratio and trend | Recent ratio near 1.44, a ~5 standard-deviation overshoot, above the 2000, 2008 and 2021 peaks
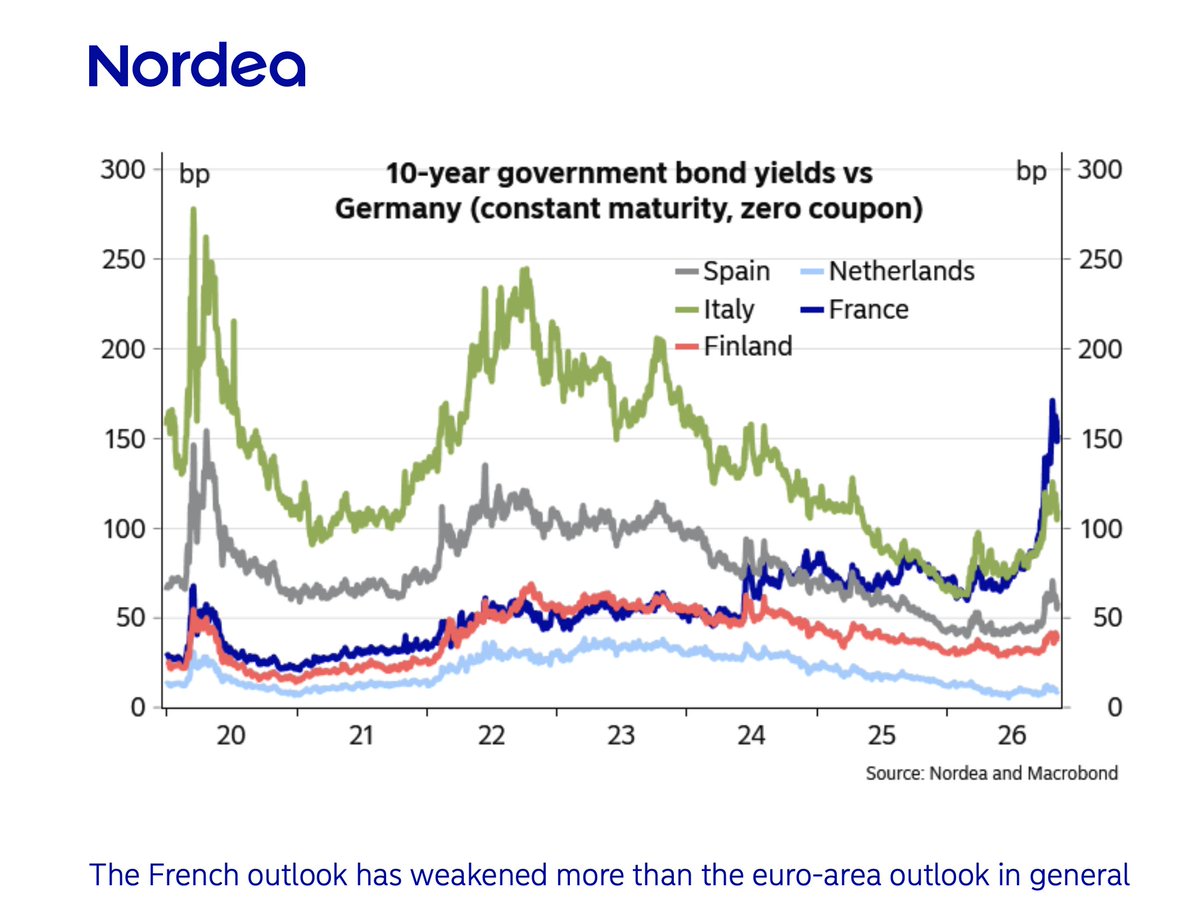
Euro-area 10-year government bond yield spreads over Germany (bp), 2020-2026 | France's spread recently surged to about 170 bps, topping Italy and Spain
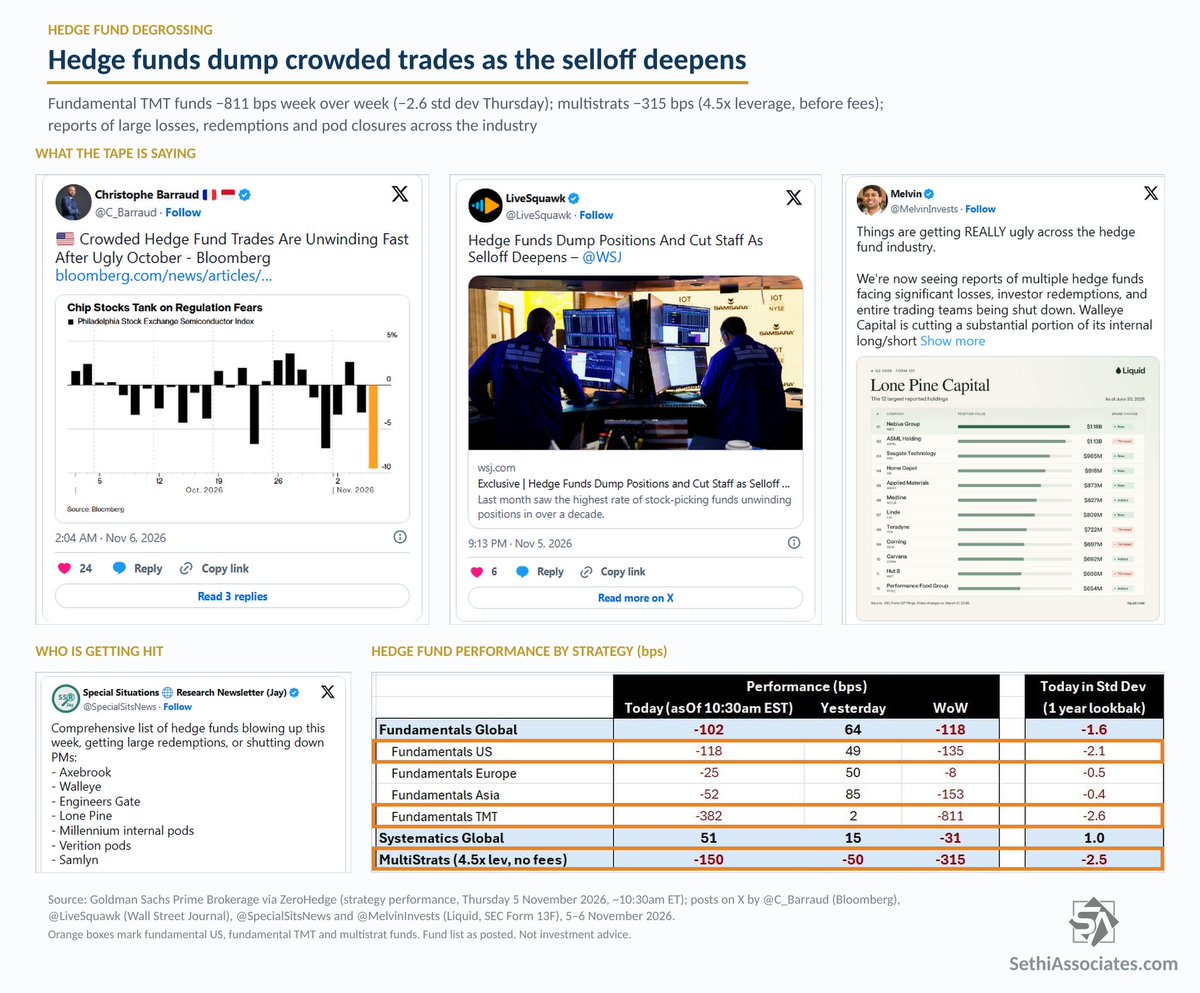
Hedge fund performance by strategy (bps), Nov 5 | Fundamental TMT -811 bps week-over-week leads the losses, multistrats -315 bps as the selloff deepens
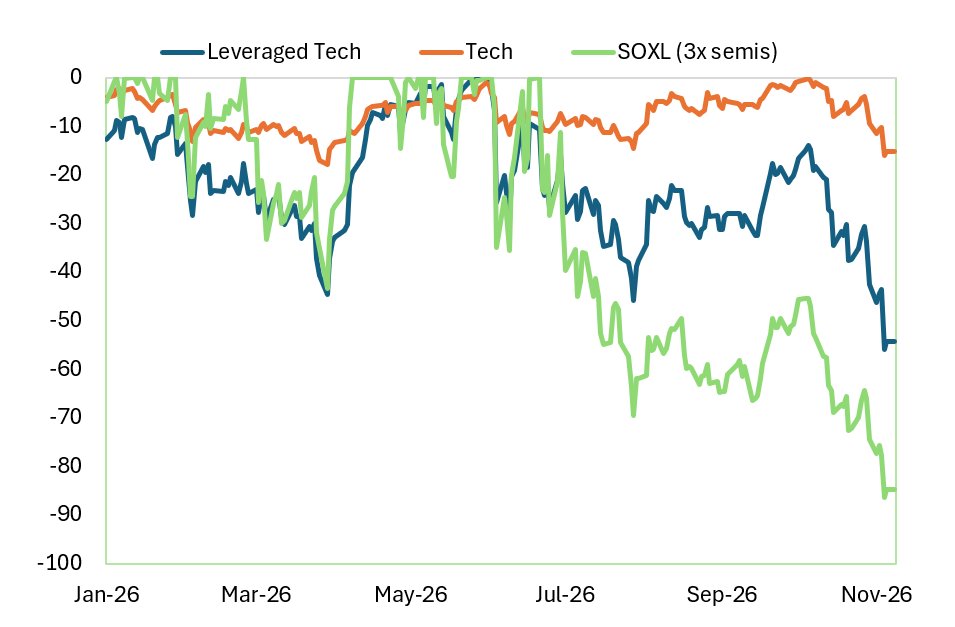
Drawdowns for leveraged tech, tech and SOXL in 2026 | SOXL is down about 85% from its high, leveraged tech about 55%, and plain tech about 15%
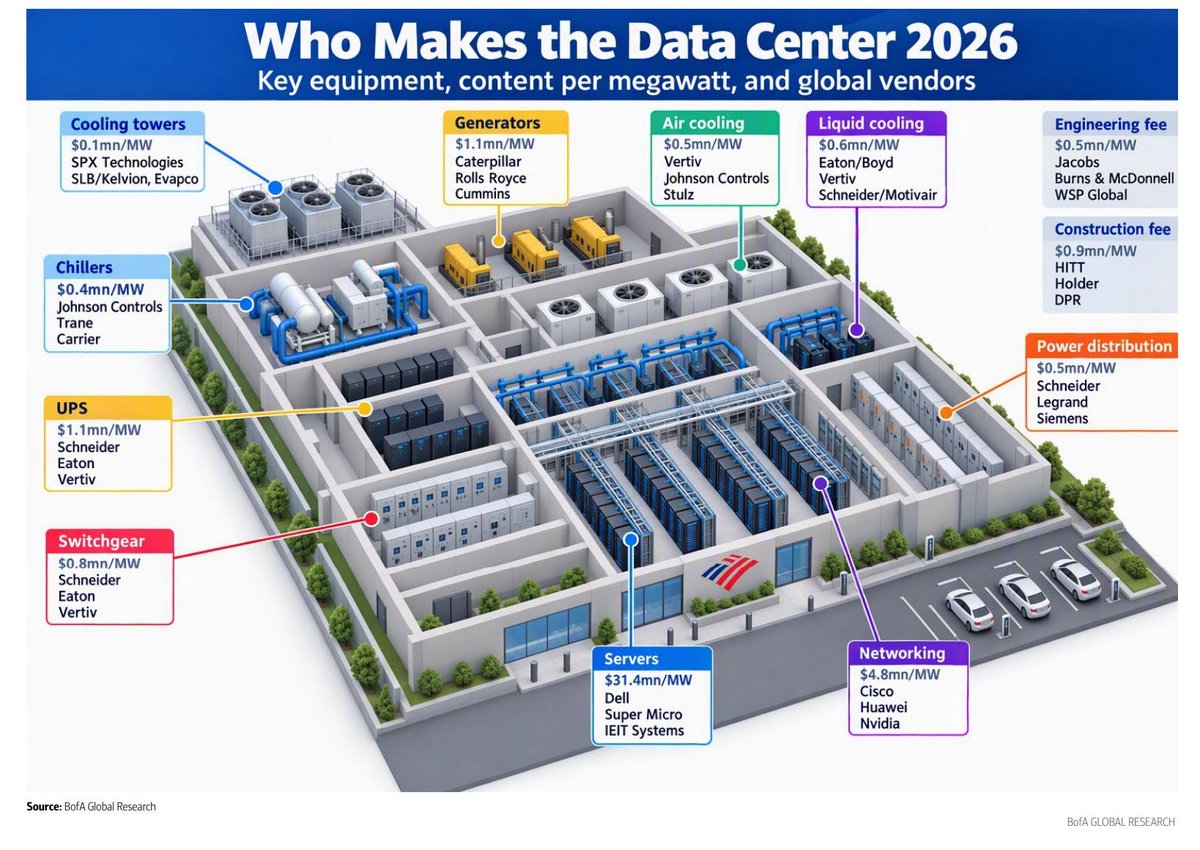
Key data-center equipment and vendors, content per megawatt | Servers top the bill at $31.4mn/MW, with networking at $4.8mn and UPS and generators at $1.1mn each
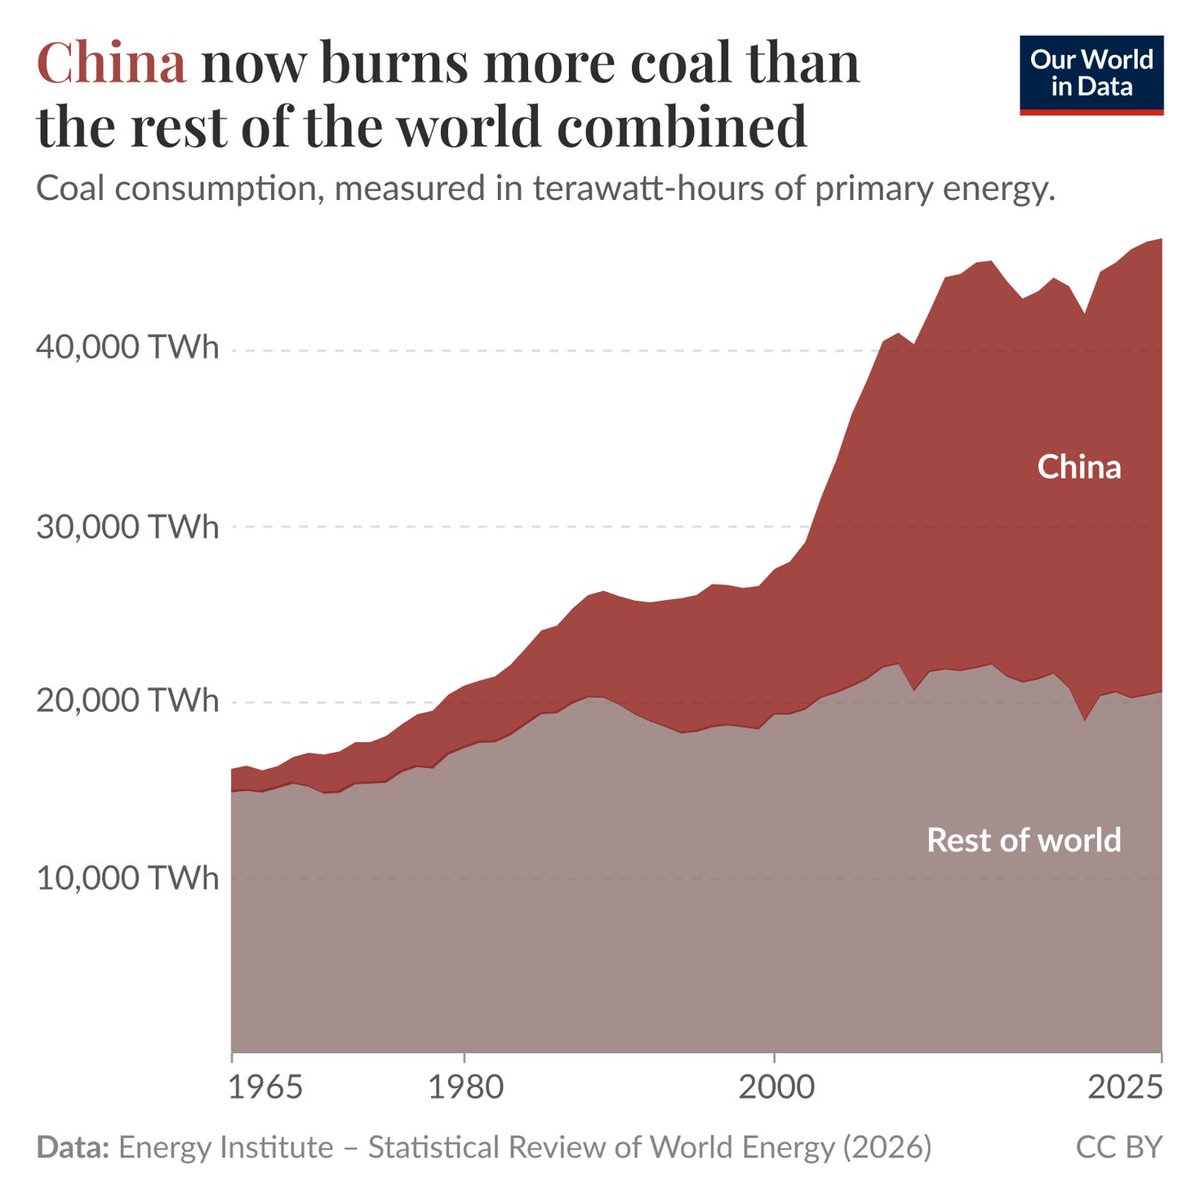
Coal consumption in TWh, China vs rest of world, 1965-2025 | China now exceeds the rest of the world combined, which has stayed near 20,000 TWh for four decades
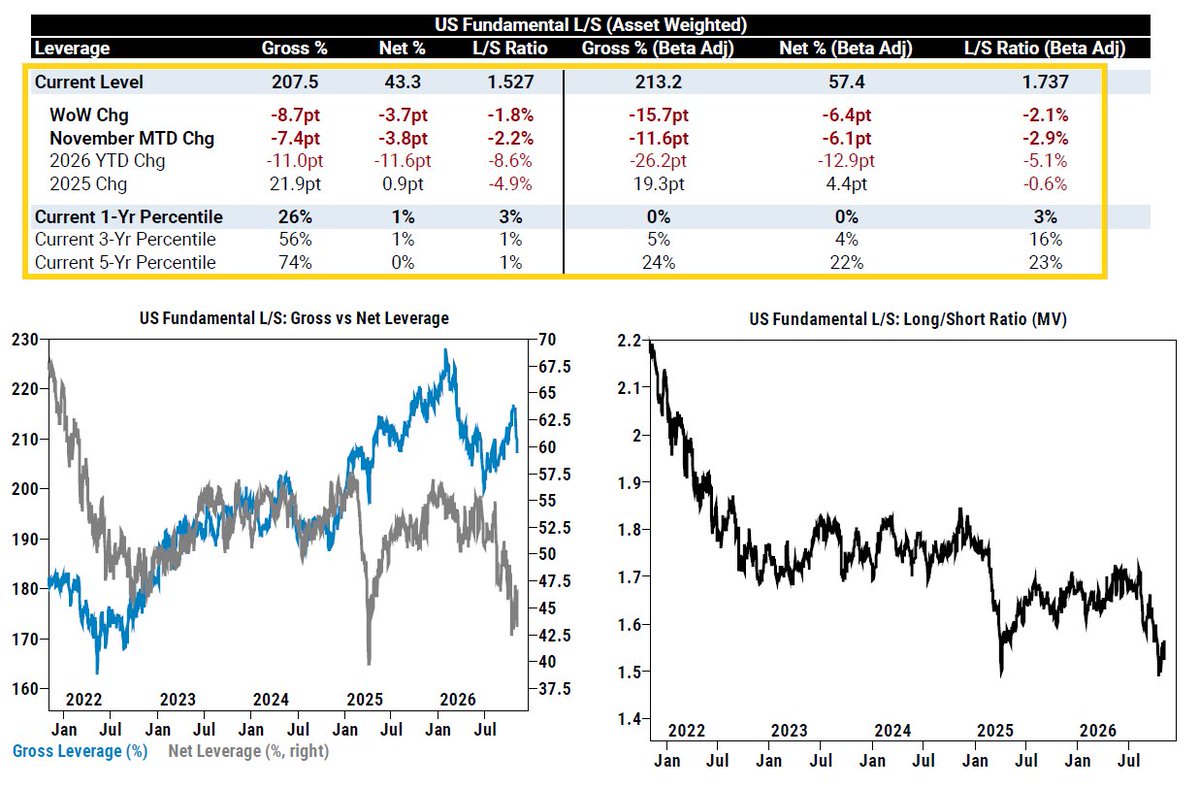
US fundamental long/short leverage, 2022-2026 | Gross leverage fell to 207.5, down 8.7pt on the week — the biggest drop since March 2020, now the 26th percentile over one year
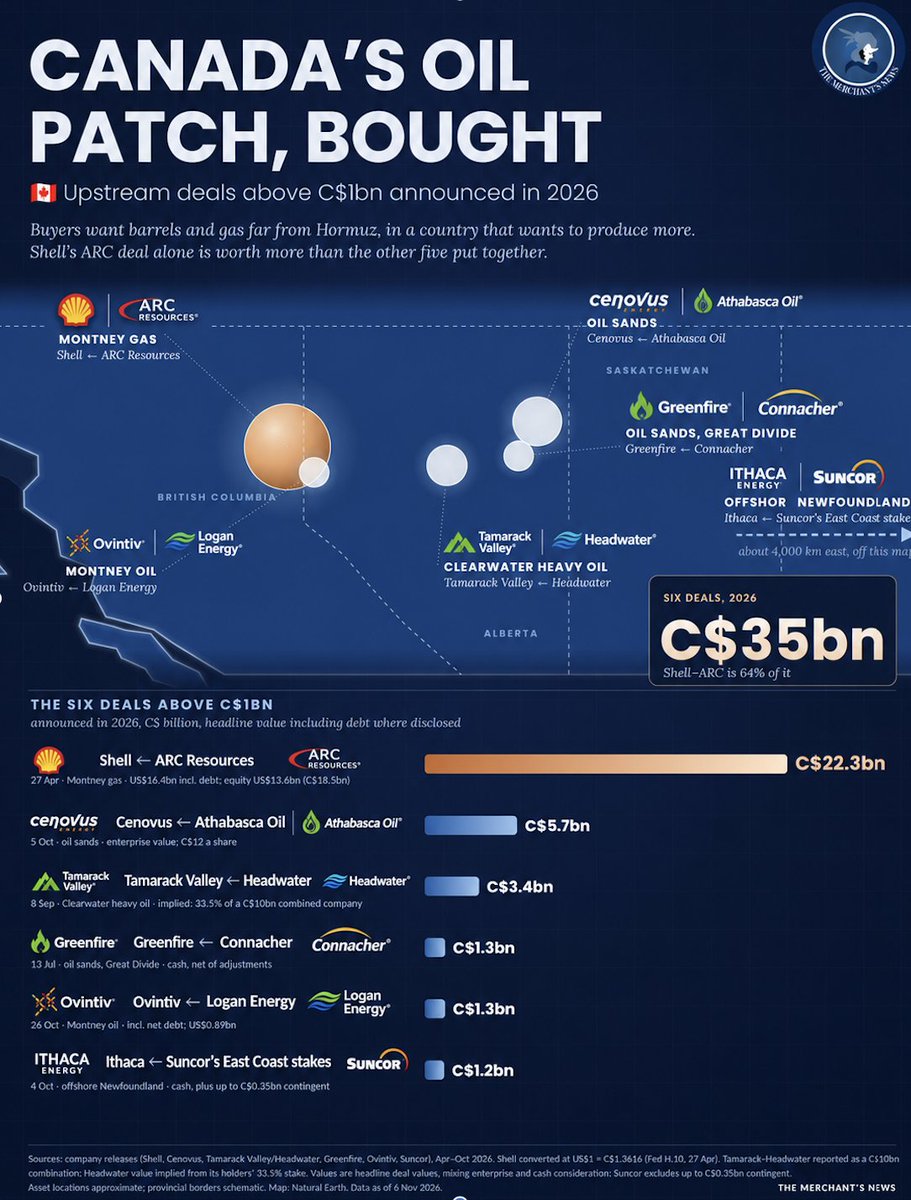
Canadian upstream oil deals above C$1bn, 2026, headline value | Six deals total C$35bn, with Shell's C$22.3bn purchase of ARC Resources making up 64%
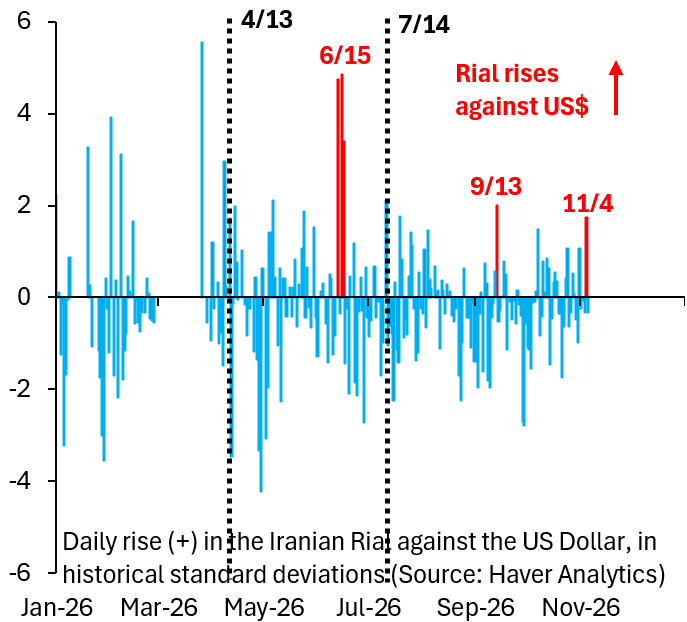
Daily rise in the Iranian rial versus the US dollar, in historical standard deviations | June 15 exceeded 4 SD, the largest; Sep 13 and Nov 4 show renewed rial strength
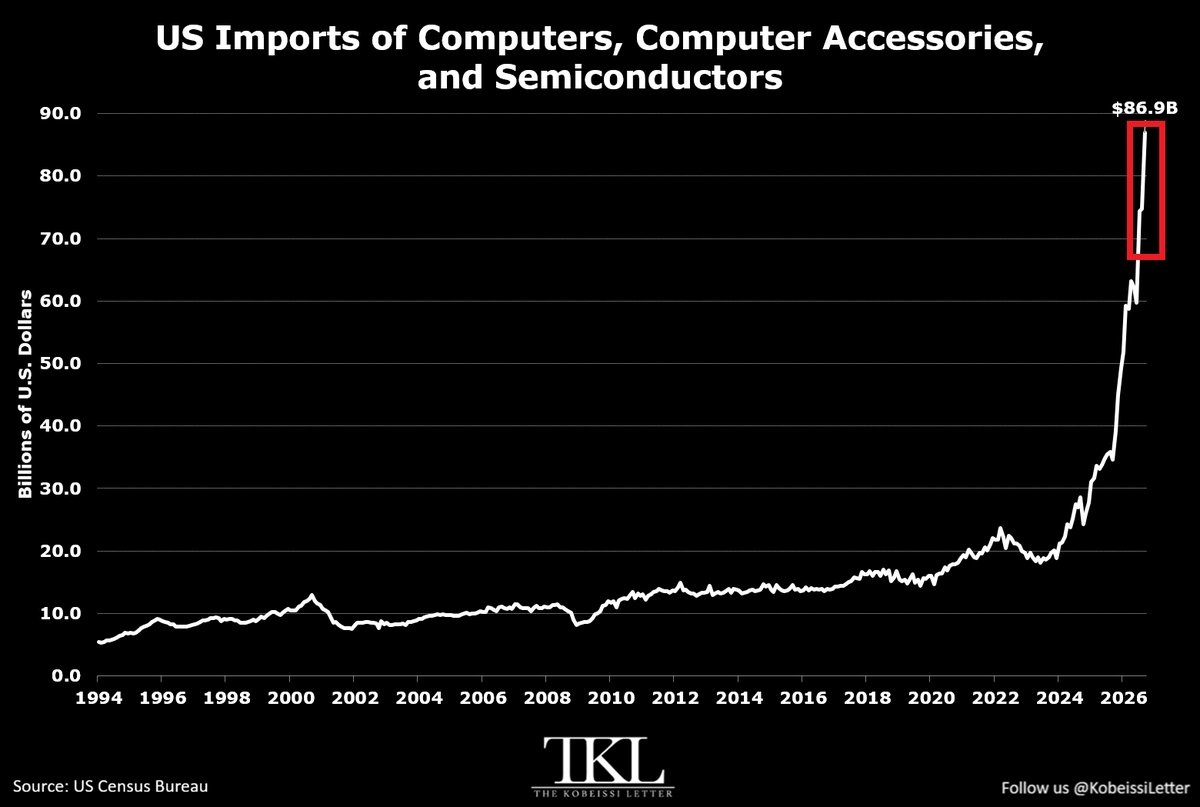
US imports of computers, accessories and semiconductors (US$ bn), 1994-2026 | September rose to a record $86.9B, up 151% Y/Y, an annualized pace above $1 trillion
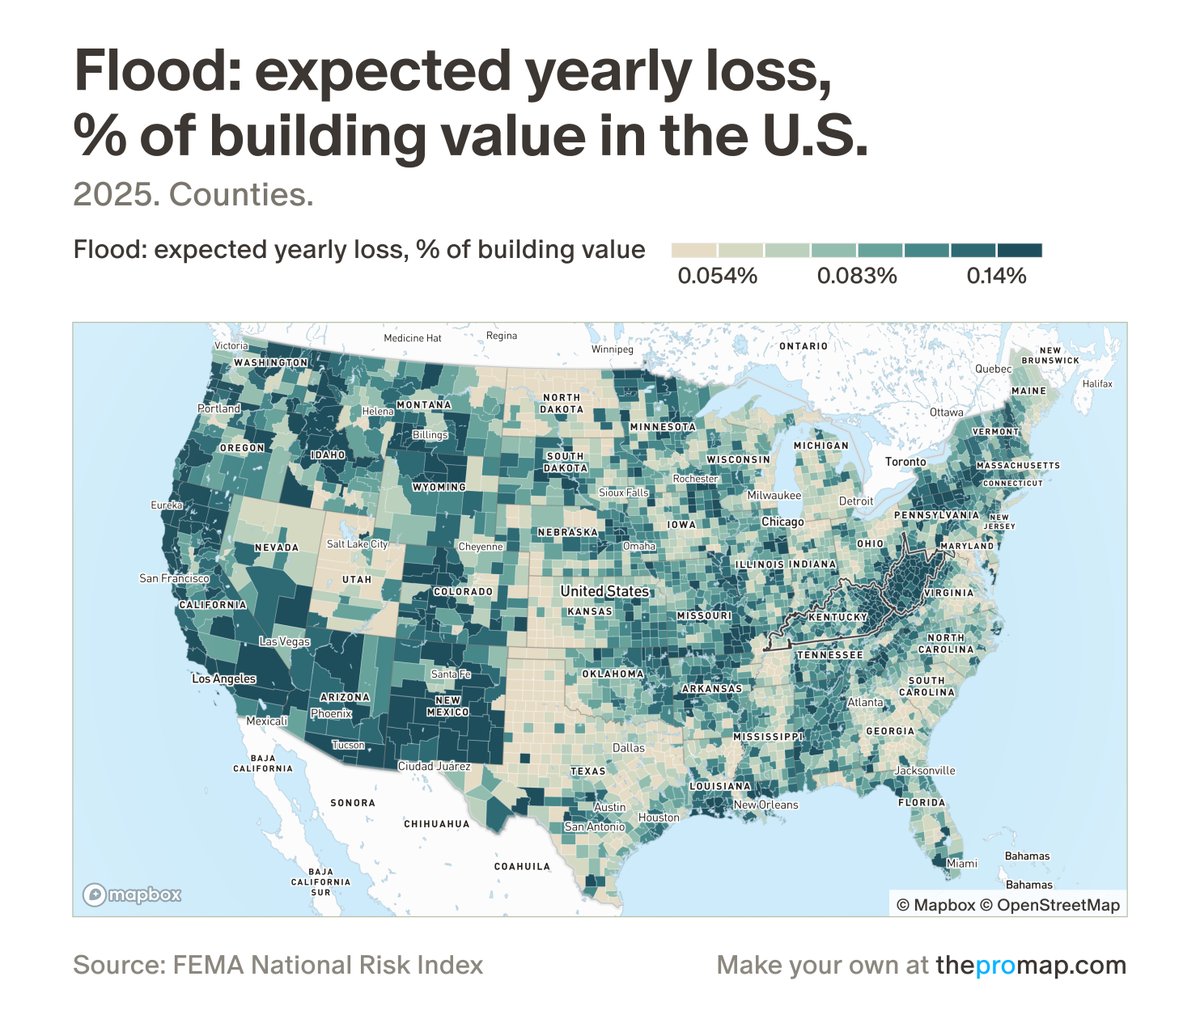
Flood expected annual loss as % of building value, US counties 2025 | High-risk bands span the West and Appalachia, with the top tier above 0.14% of building value
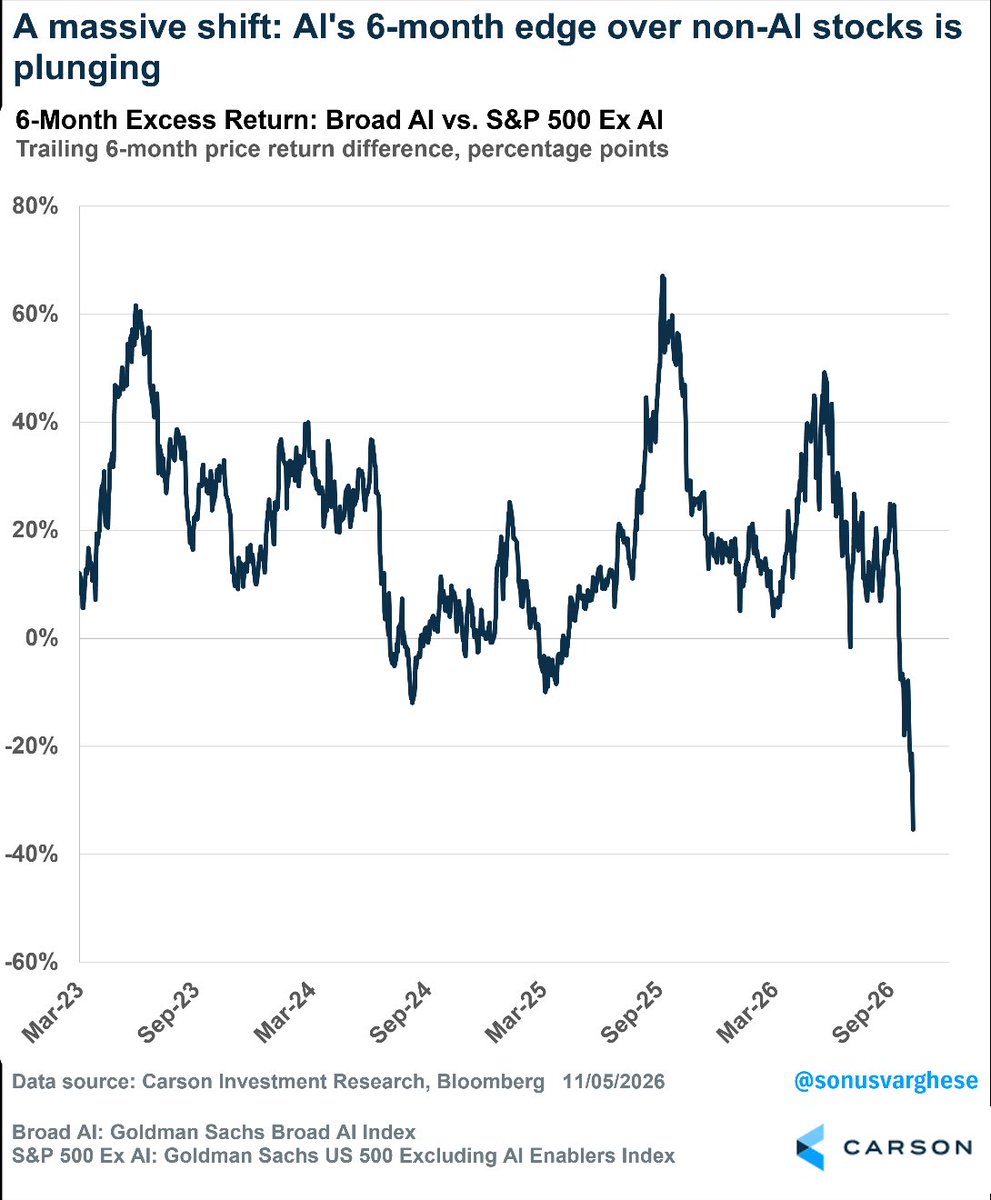
Trailing 6-month price-return difference, Broad AI vs S&P 500 ex-AI (percentage points) | Down from ~+67% in Sep 2025 to about -35% recently
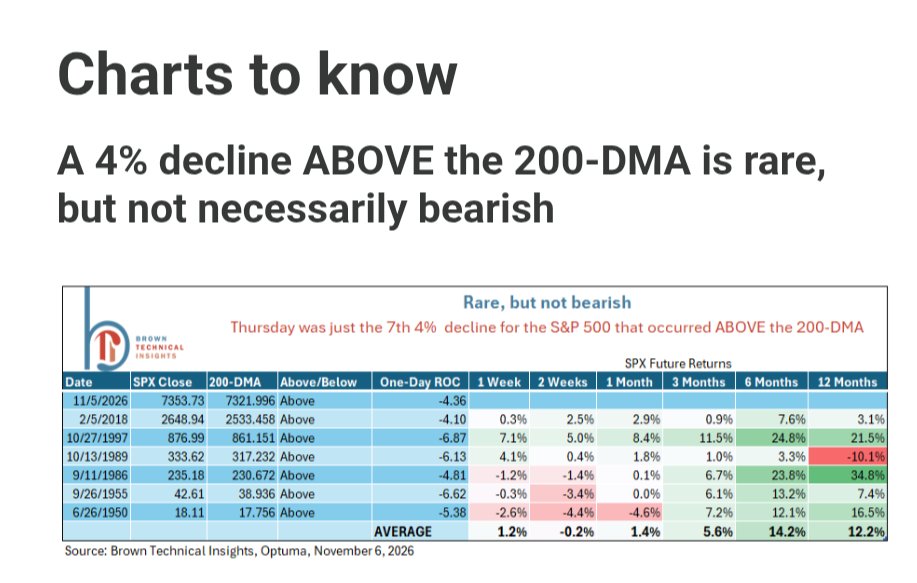
S&P 500 forward returns after a 4% one-day drop above the 200-DMA | Only the 7th occurrence; average +5.6% at 3 months and +12.2% at 12 months
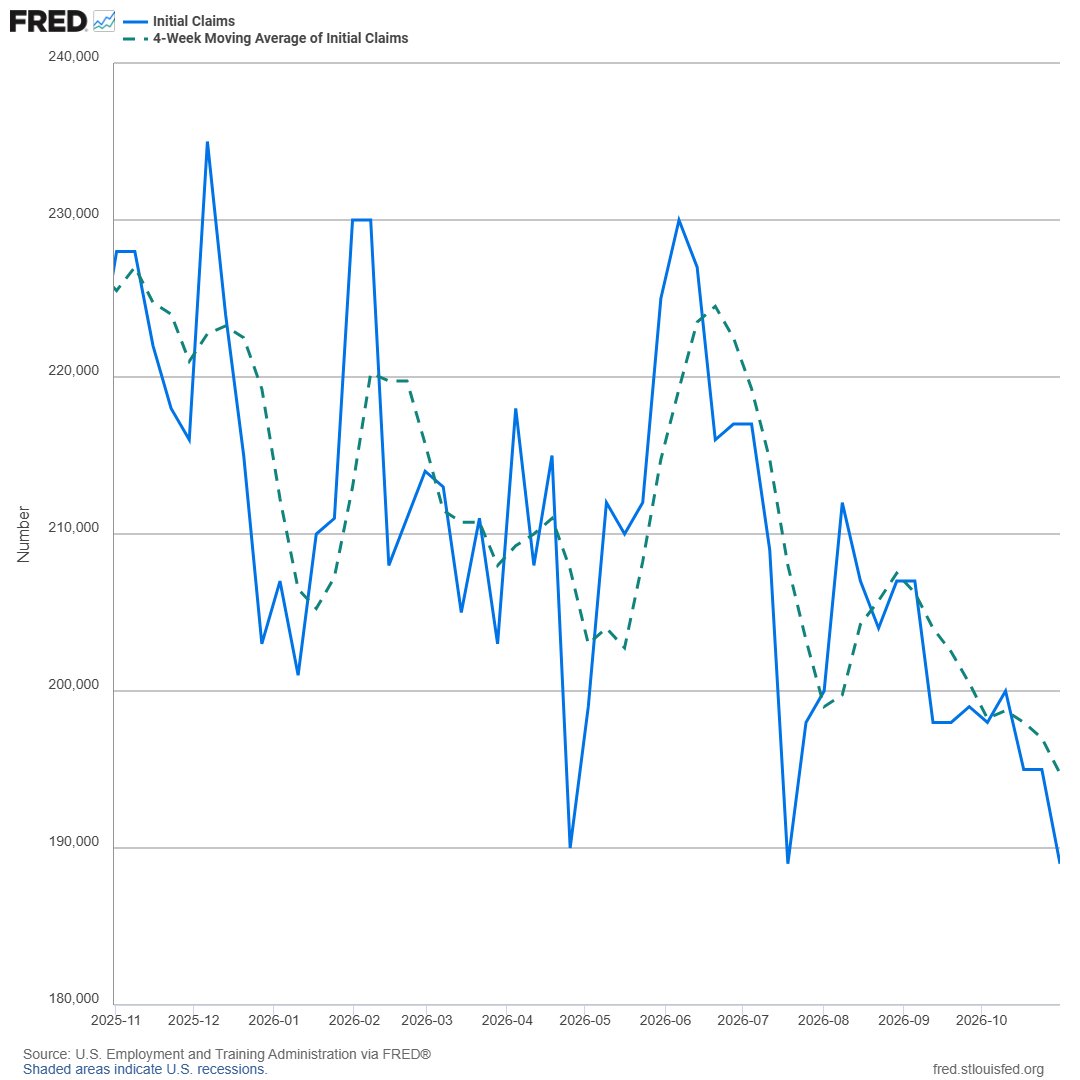
US weekly initial jobless claims, 2025-2026 | Fell 6,000 to 189,000 in the week ended Oct 31, four-week average down to 194,750
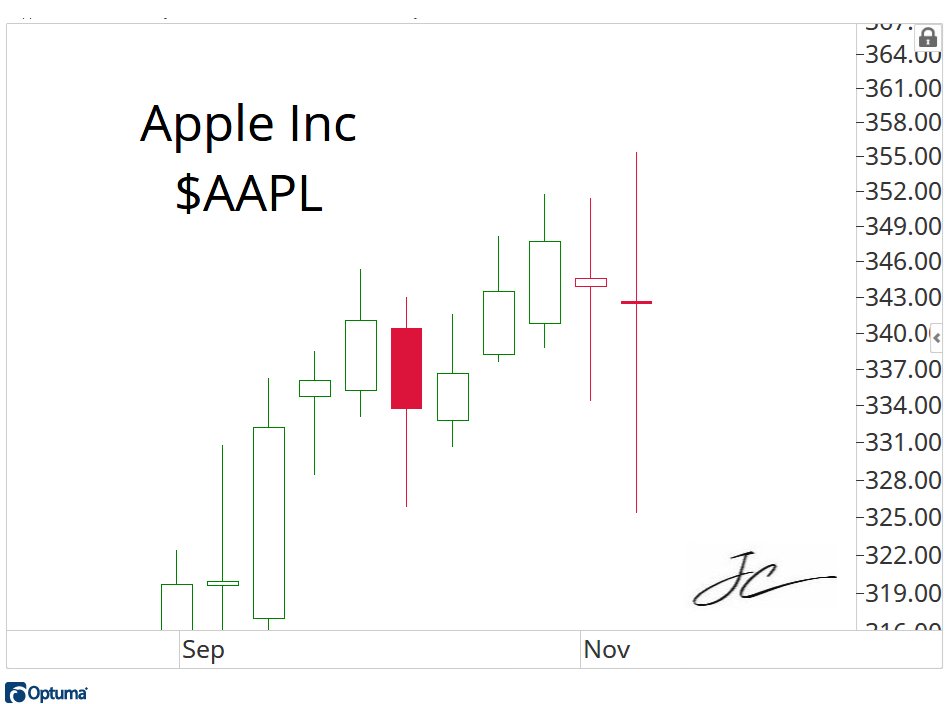
Apple $AAPL weekly candlestick chart, Sep-Nov | The latest week shows a wide-range candle with long upper and lower wicks, closing around $343
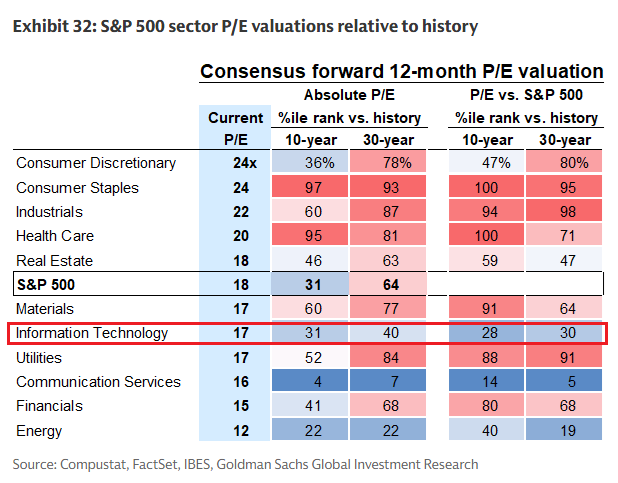
Consensus forward 12-month P/E by S&P 500 sector | Tech at 17x, below the index's 18x and in just the 31st percentile over 10 years
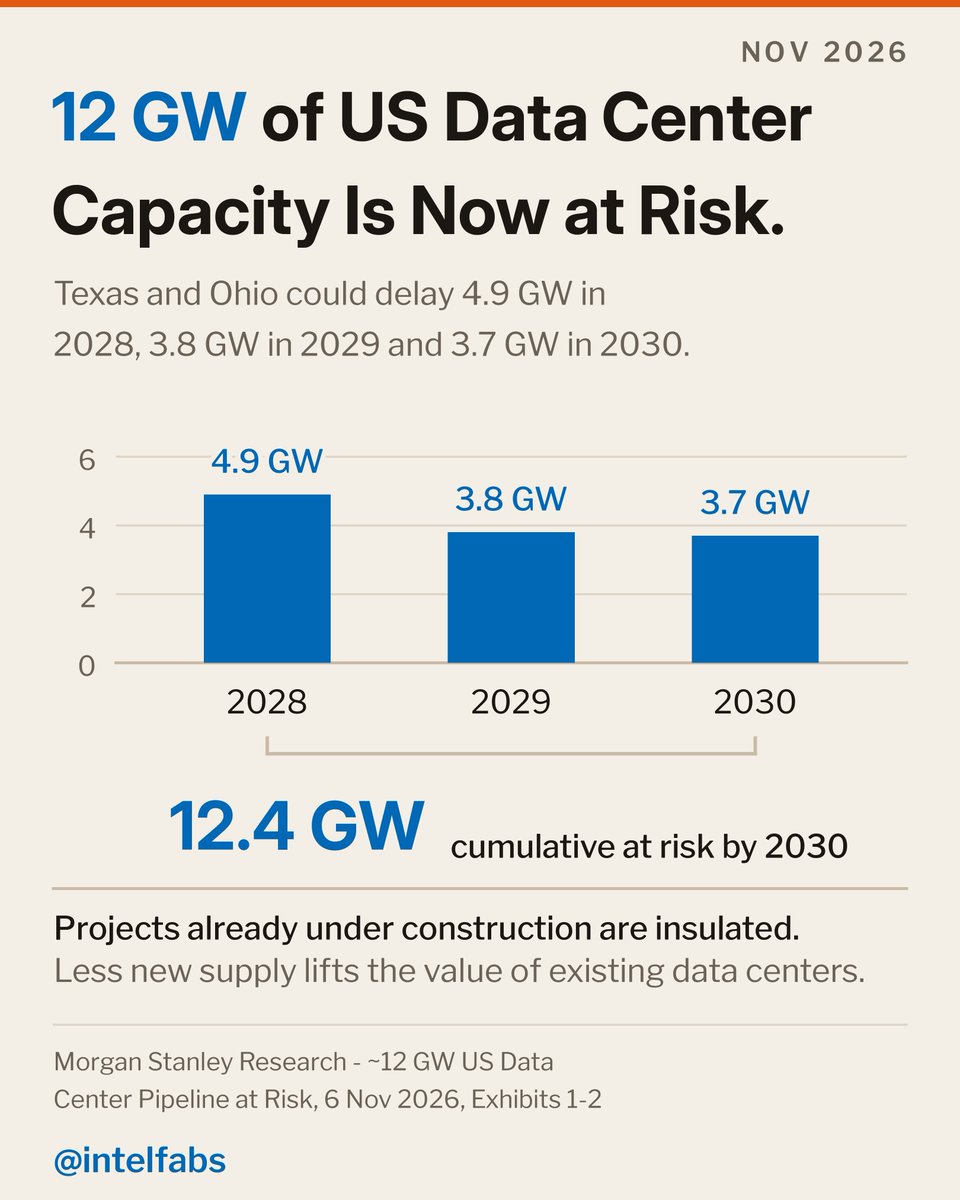
US data-center capacity at risk of delay, 2028-2030 | Texas and Ohio could push back 4.9 GW in 2028, with 12.4 GW cumulative at risk by 2030
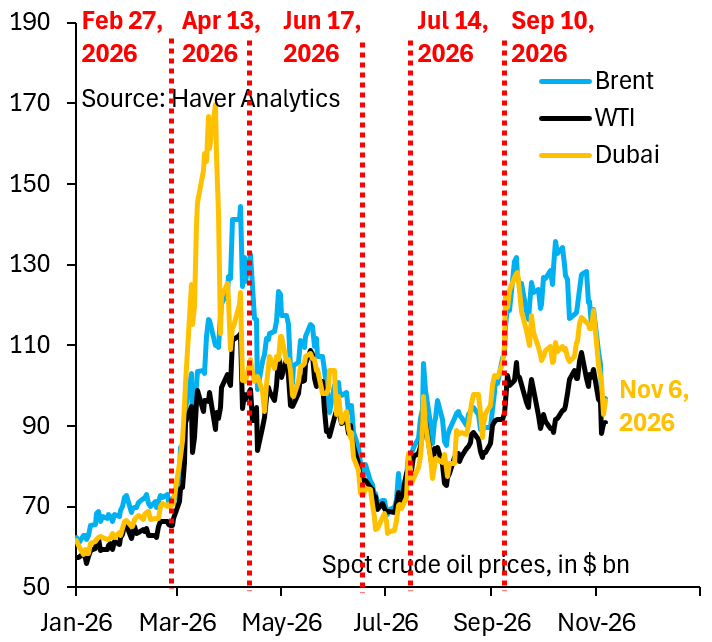
Brent, WTI and Dubai spot crude prices, 2026 | Oil spiked after the Sep 10 attack, with Brent briefly above $130, before rolling over recently
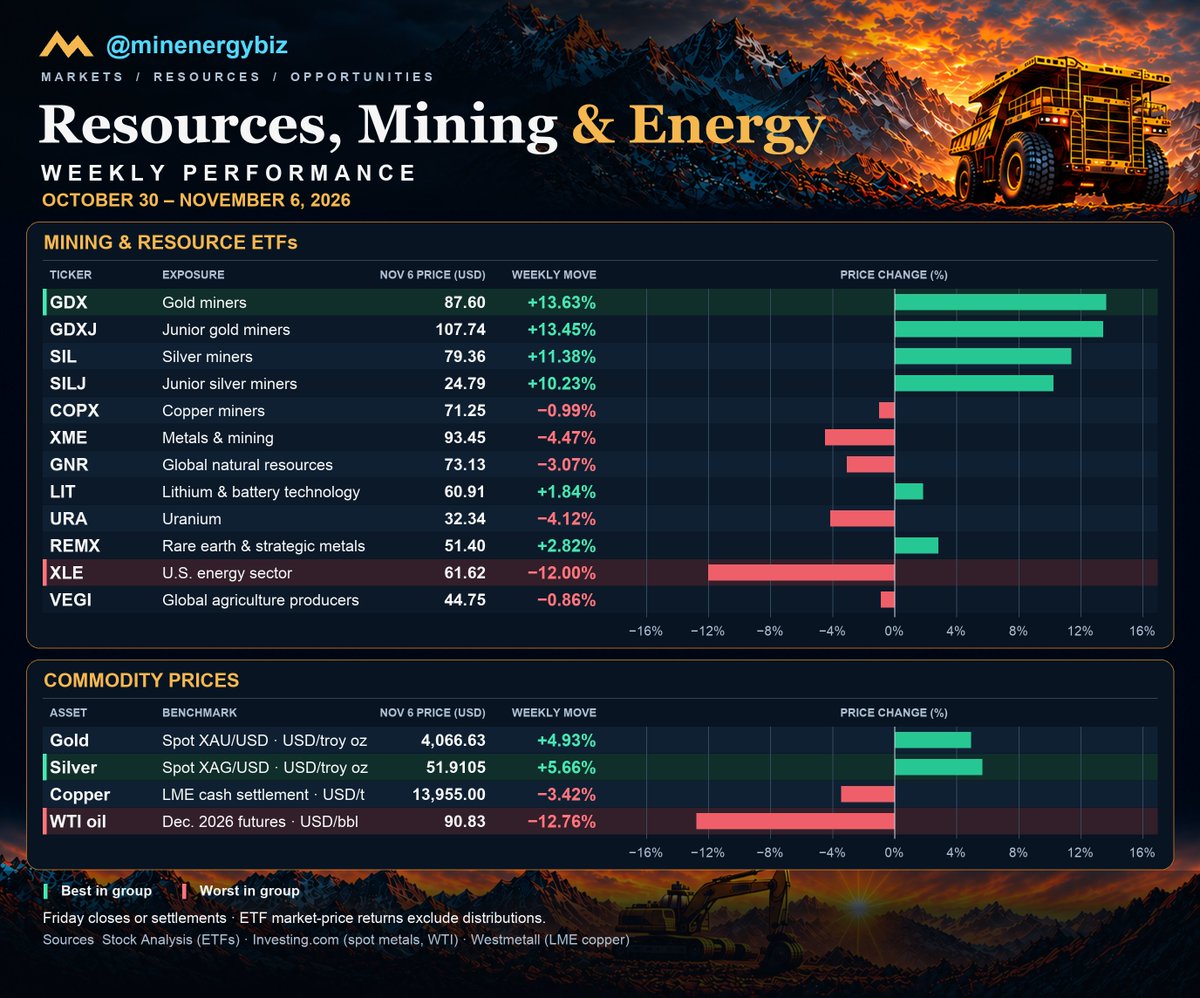
Weekly moves in resources, mining and energy ETFs and commodities | Gold miner GDX +13.6% and silver +5.7%, versus energy XLE -12% and WTI oil -12.8%
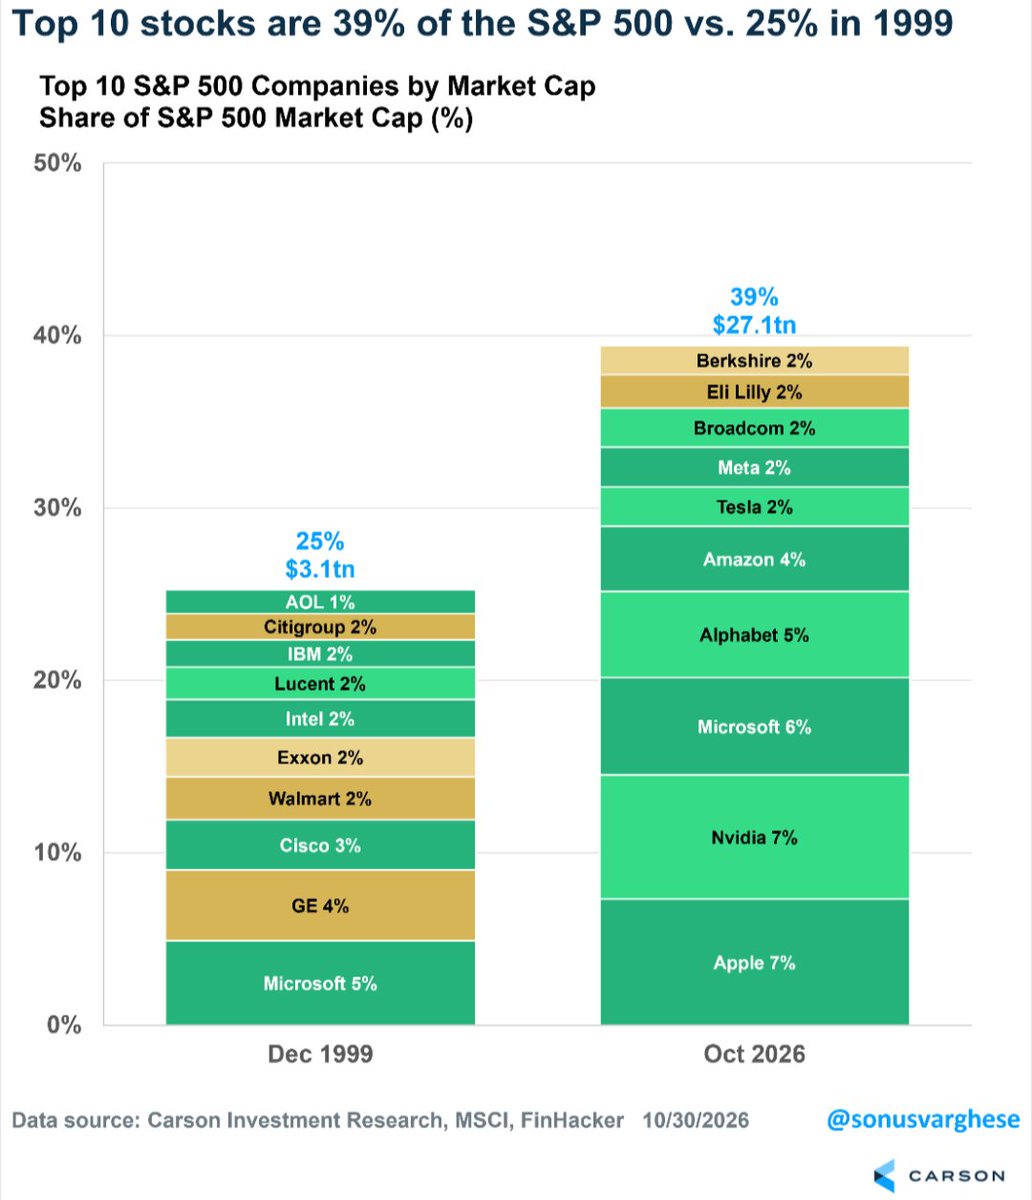
Share of S&P 500 market cap held by its 10 largest companies, 1999 vs 2026 | 39% ($27.1tn) in Oct 2026, up from 25% ($3.1tn) in 1999
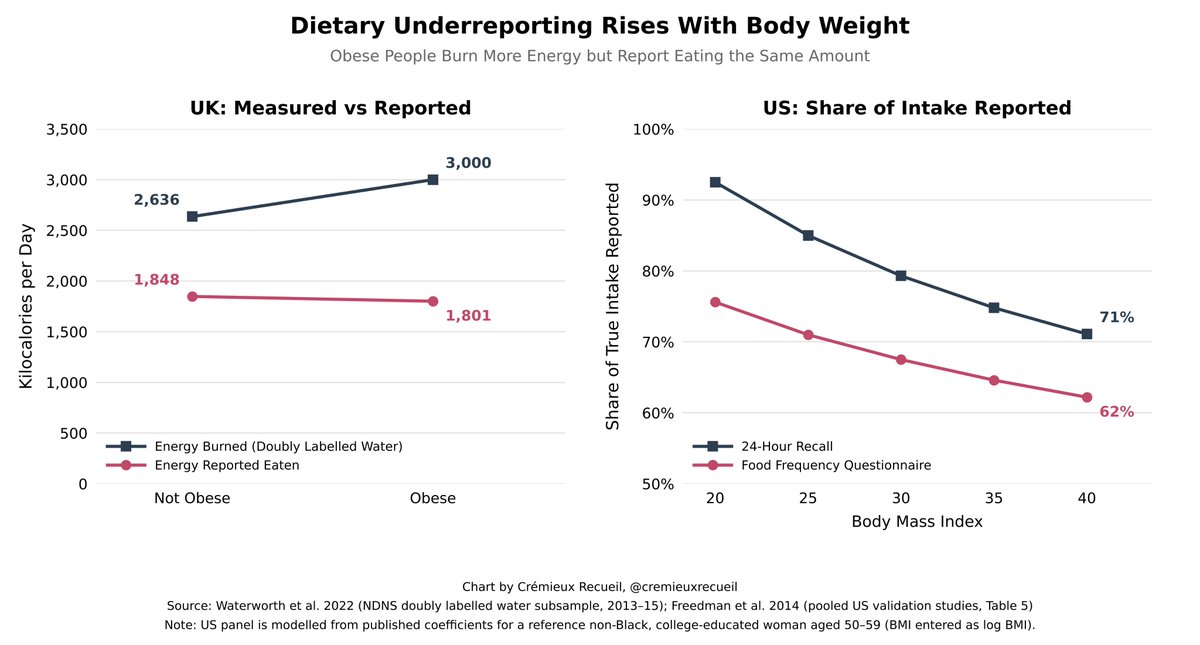
UK measured vs reported energy and US share of true intake reported by BMI | Obese adults burn ~3,000 kcal but report 1,801; at BMI 40 reporting falls to 62-71% of true intake
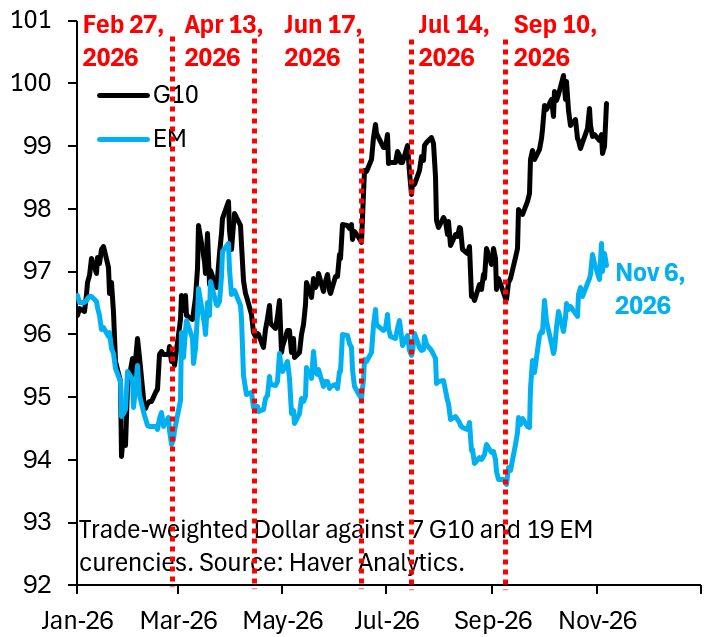
Trade-weighted dollar against G10 and EM currencies, 2026 | As of Nov 6 the G10 index is near 99 and EM near 97, both recovering from September lows
Renewable capacity additions, two five-year periods | 2026-2031 forecast at about 4,750 GW, 57% above the roughly 3,000 GW added in 2020-2025
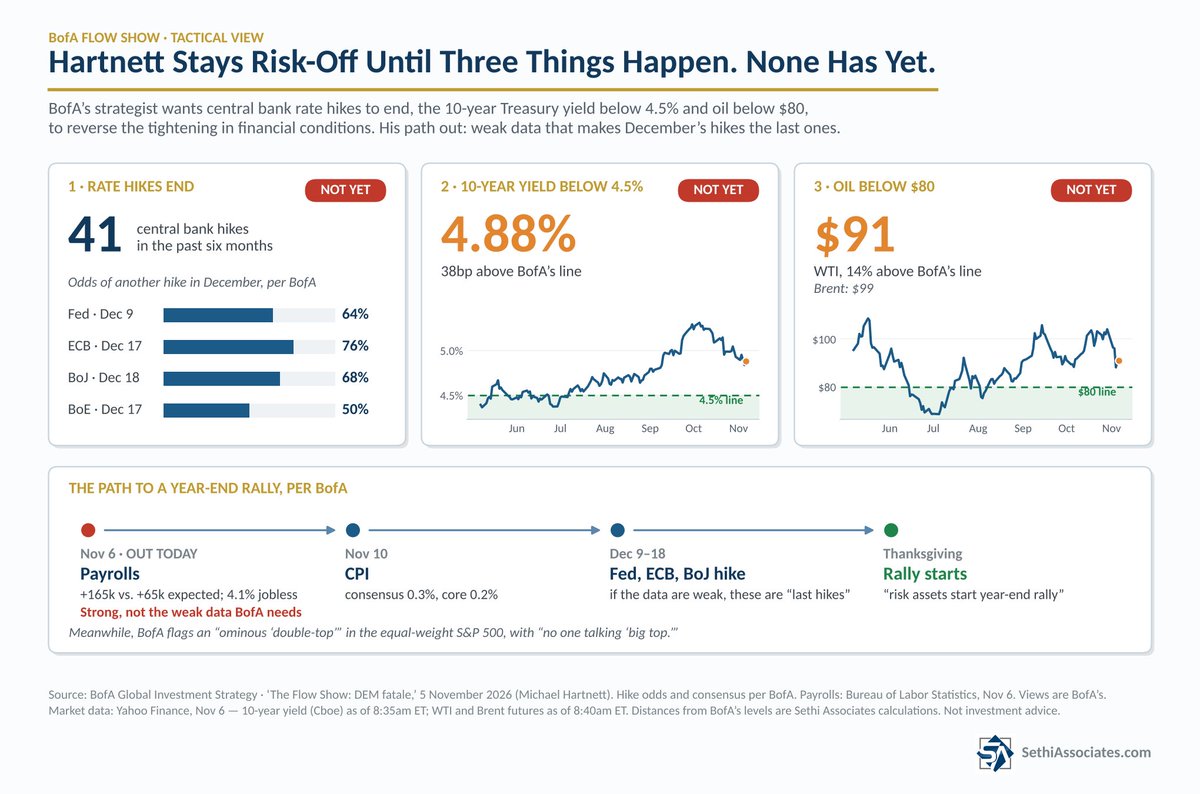
BofA Hartnett's three thresholds to turn risk-on and their status | 10Y yield 4.88% above 4.5%, WTI $91 above $80; none met yet
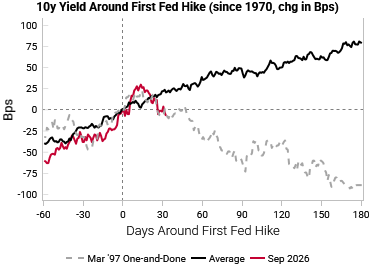
US 10-year yield change around the first Fed hike, since 1970 (bps) | The Sep 2026 path hugs the 1997 one-and-done hike, with yields peaking and rolling over
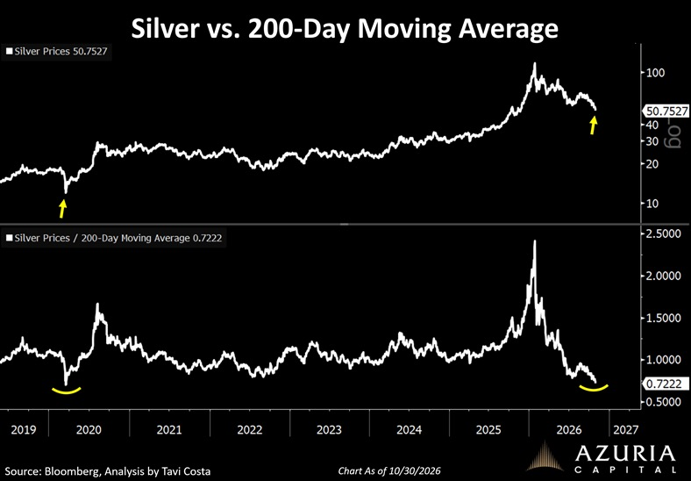
Silver price relative to its 200-day moving average, 2019-2026 | The ratio has fallen to 0.72, roughly 30% below trend, matching March 2020 levels
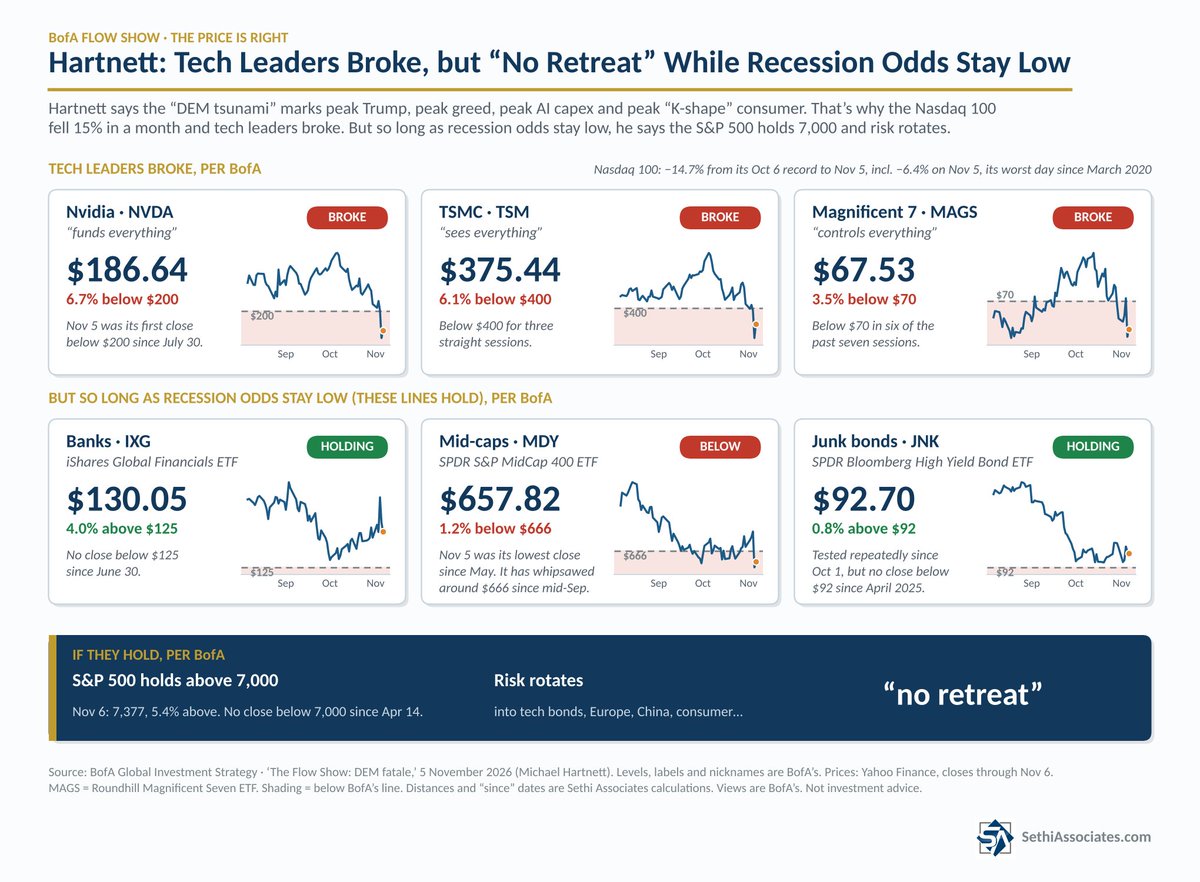
BofA Hartnett's key market lines | Nvidia $186.64, TSMC $375.44 and MAGS $67.53 all broke, but the S&P 500 still holds above 7,000
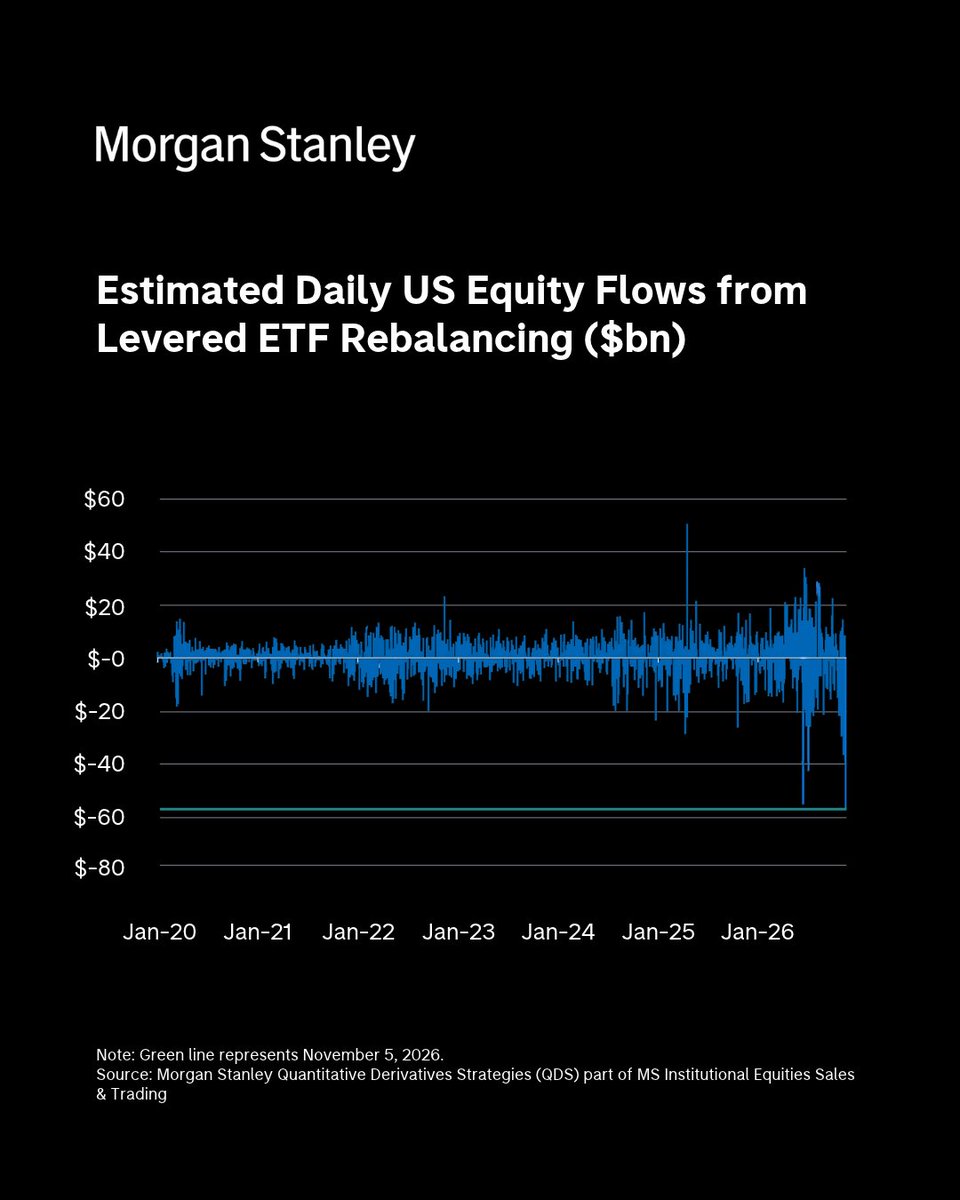
Estimated daily US equity flows from levered ETF rebalancing ($bn) | Nov 5, 2026 near -$57bn, the largest single-day outflow since 2020
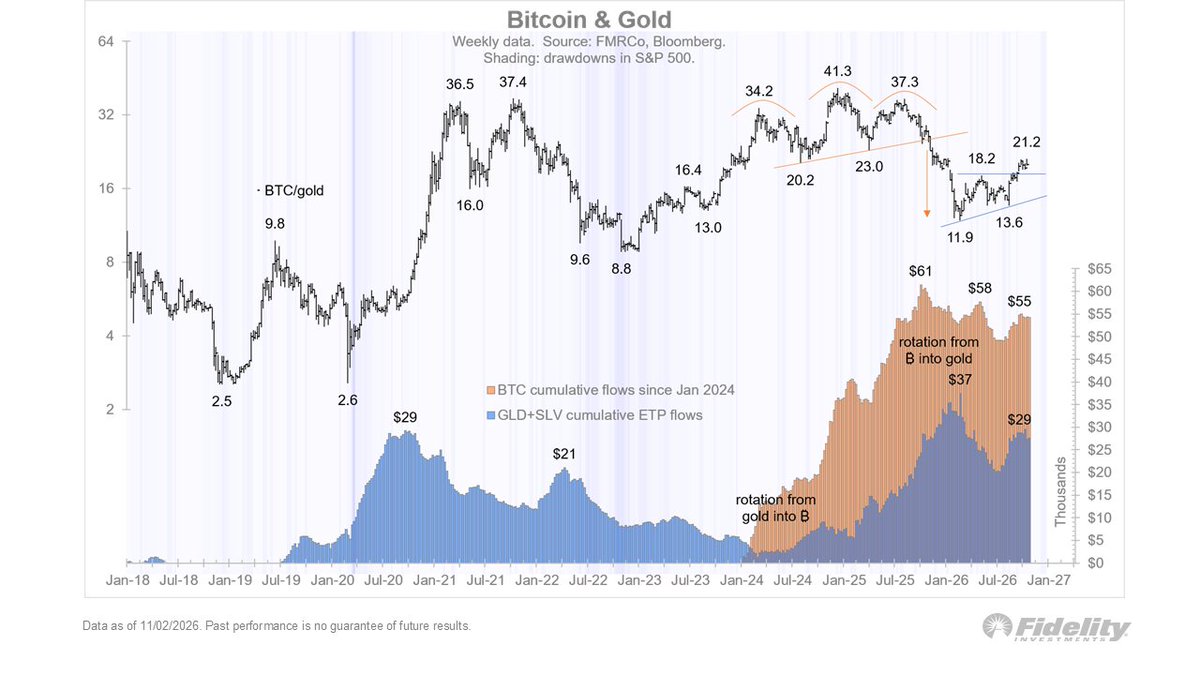
BTC/gold ratio and cumulative fund flows, 2018-2026 | The ratio has slipped from a 37.3 peak to 21.2 as money rotates out of bitcoin and into gold
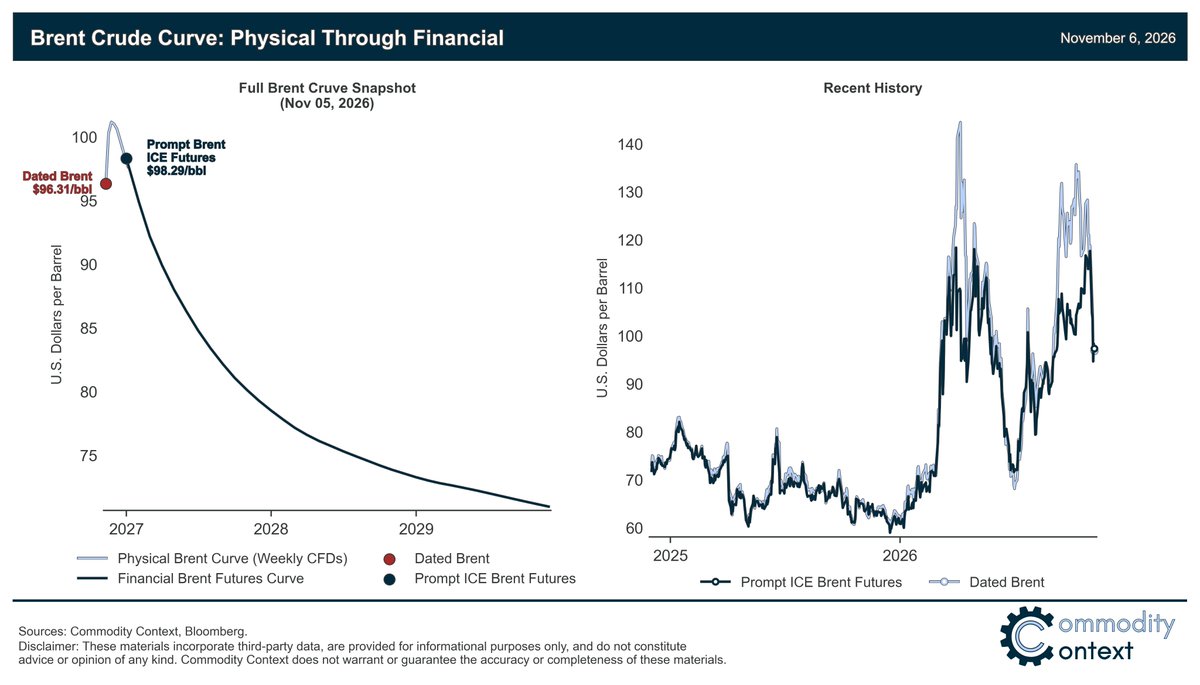
Brent forward curve and recent price history | Prompt ICE Brent $98.29, Dated Brent $96.31; the curve slopes down toward $72 by 2029
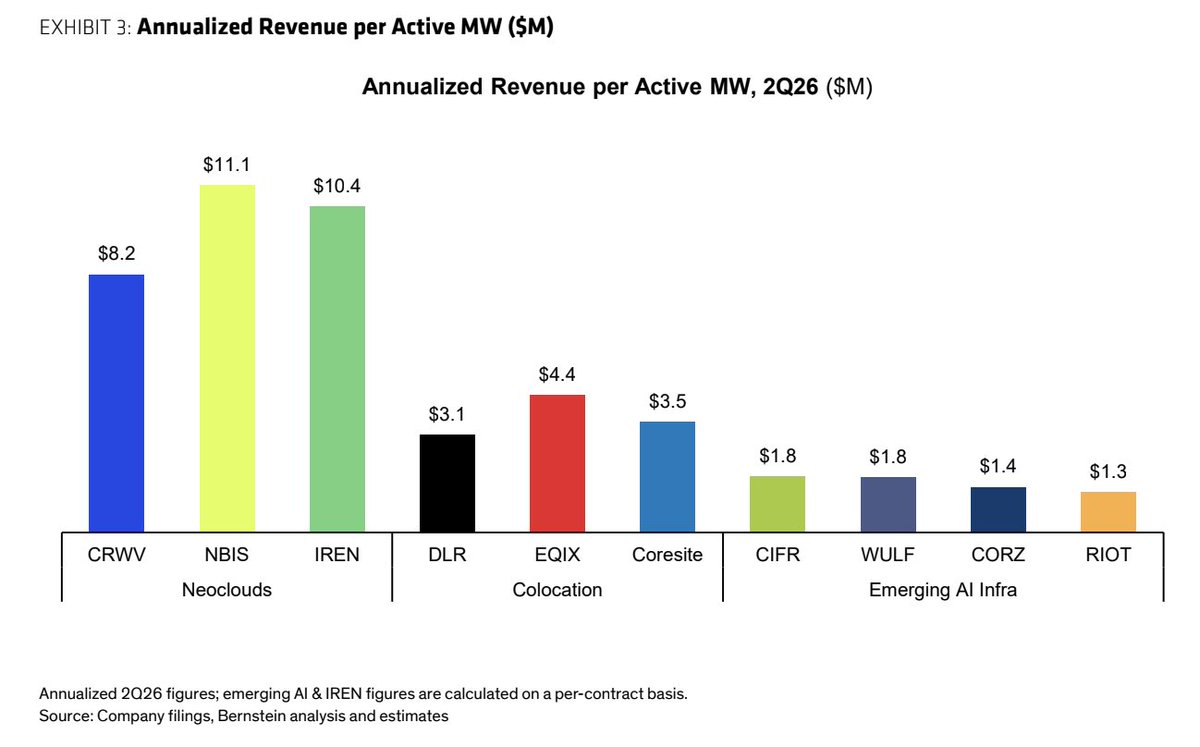
Annualized revenue per active MW by company (US$M), 2Q26 | Neoclouds NBIS at $11.1M and IREN at $10.4M far exceed colocation and emerging AI infra names