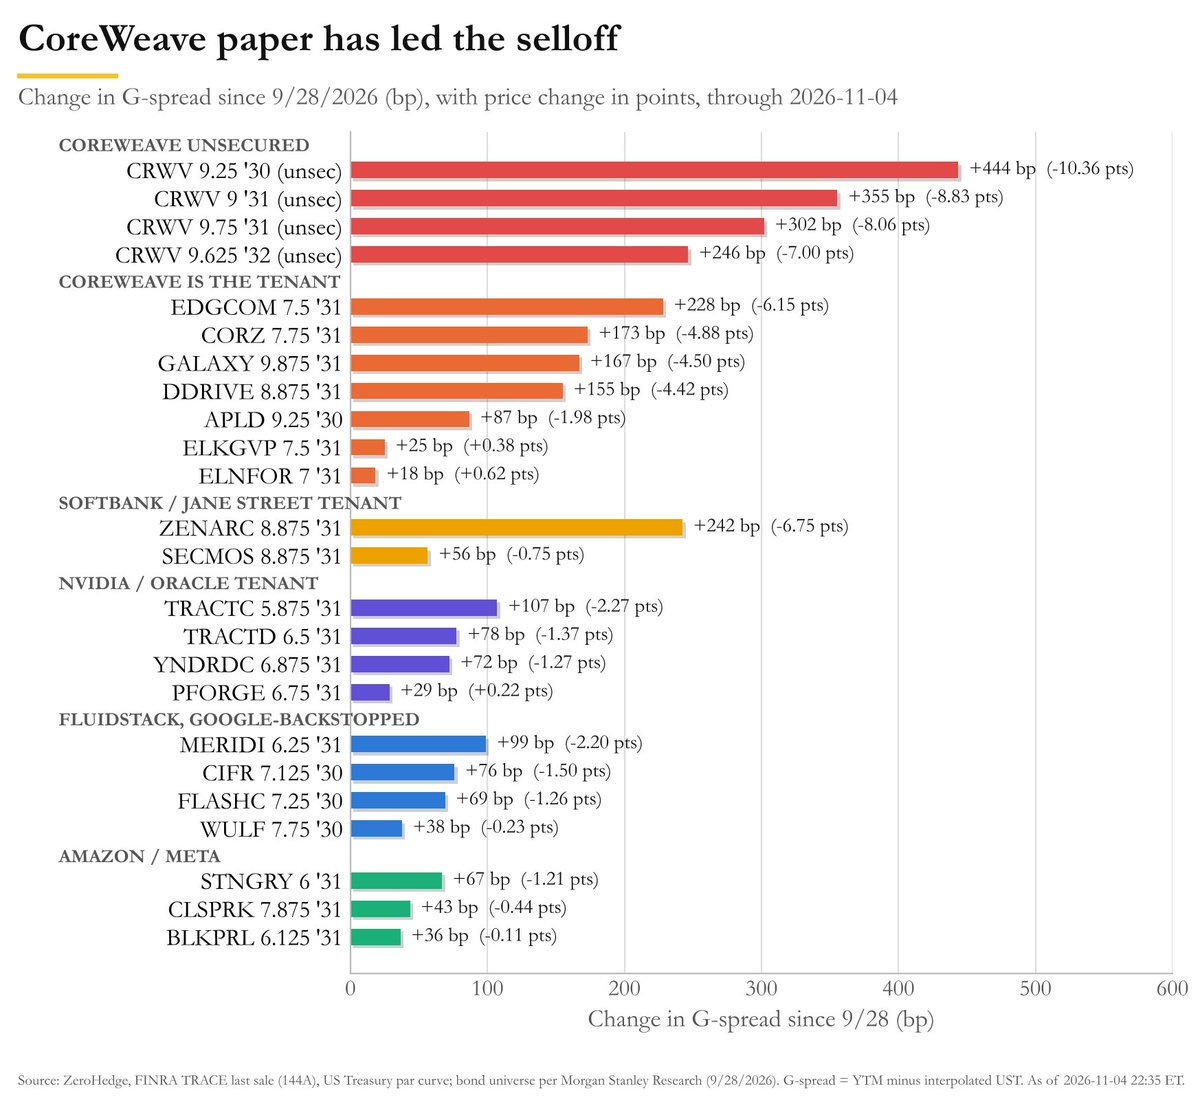
CoreWeave Paper Leads the Selloff, Spreads Wider by Over 440 bp Since 9/28
Change in G-spread on data-center HY bonds since 9/28, by tenant | CoreWeave 9.25 '30 wider by 444 bp, price down 10.36 pts
English financial charts and market context published in 2026-11, page 10.
Change in G-spread on data-center HY bonds since 9/28, by tenant | CoreWeave 9.25 '30 wider by 444 bp, price down 10.36 pts
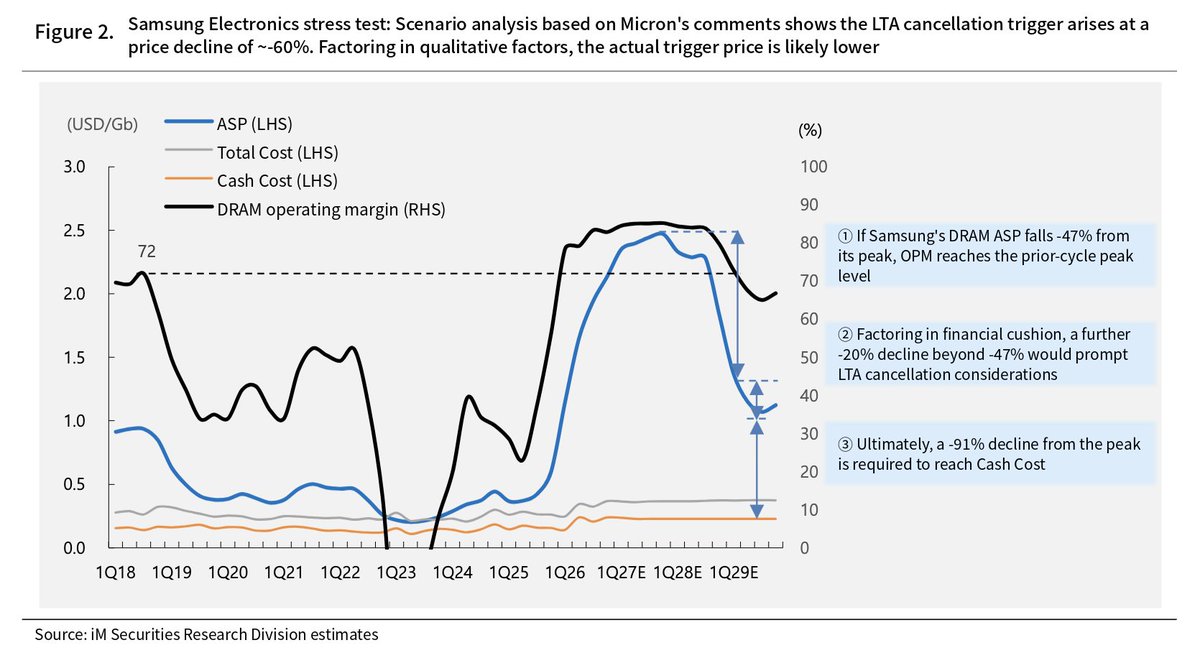
Samsung DRAM ASP, cost and operating margin, 1Q18-1Q29E | A -47% ASP drop restores prior-cycle peak margin; -91% from peak needed to reach cash cost
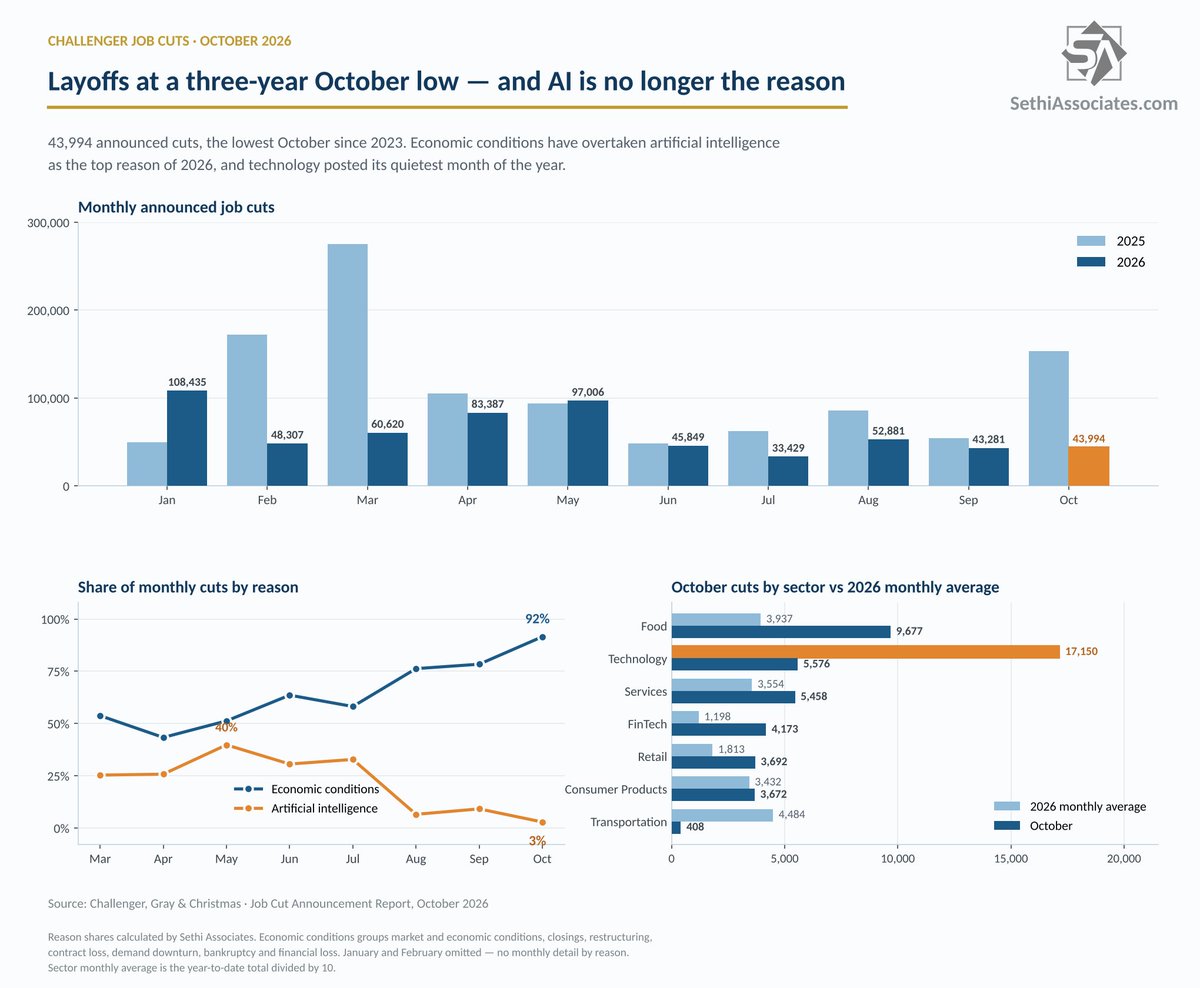
Challenger monthly US job cuts and reasons | October's 43,994 is the lowest October since 2023; economic conditions rise to 92% of cuts as AI falls to 3%
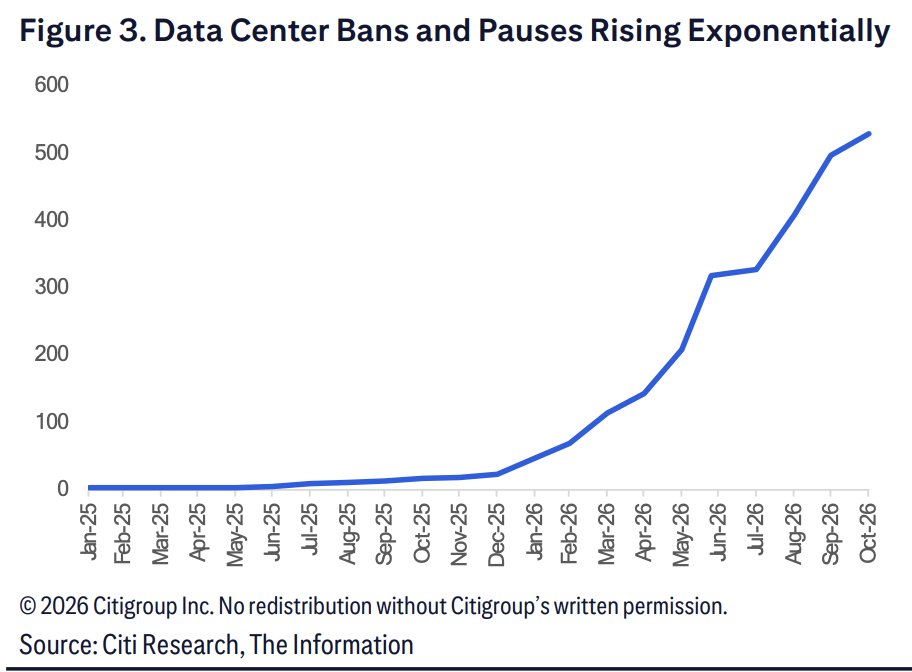
Cumulative data-center bans and pauses, 2025–2026 | About 525 cases, rising sharply since late 2025
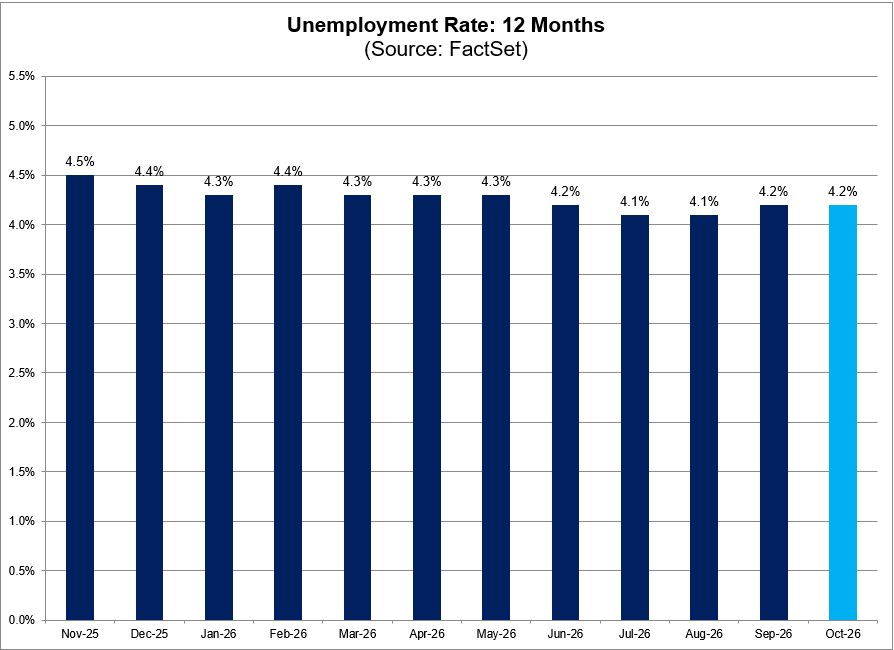
US unemployment rate, trailing 12 months | October projected 4.2%, within a 4.1%–4.5% range over the past year
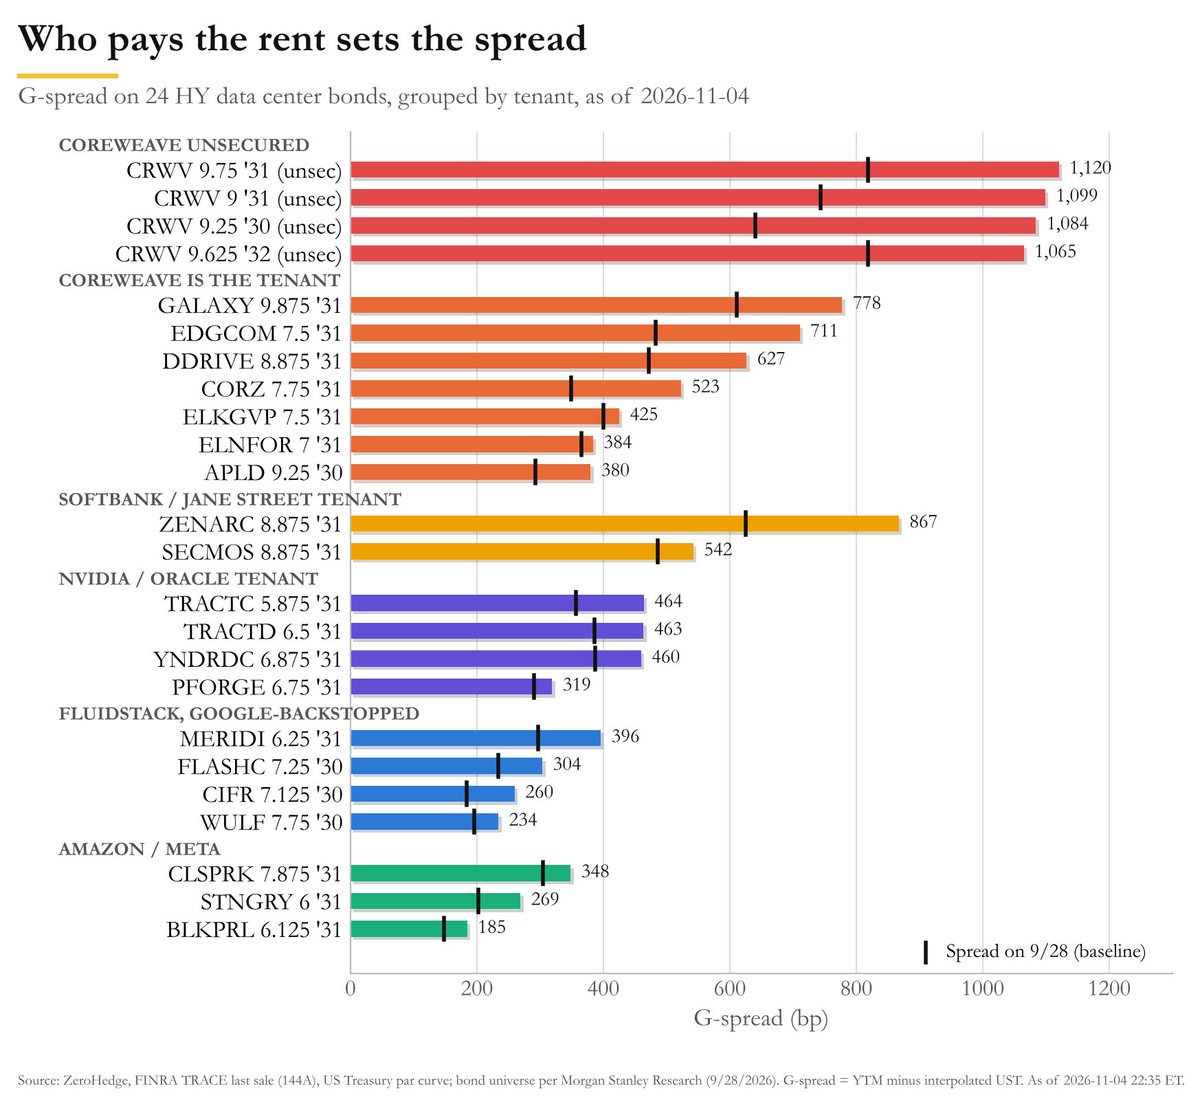
G-spread on 24 HY data-center bonds, grouped by tenant | CoreWeave unsecured at 1,120 bp, far above Amazon/Meta-tenant bonds
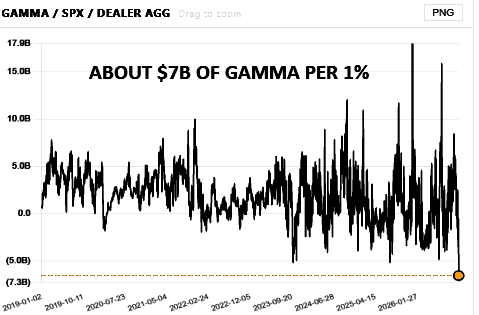
S&P 500 dealer aggregate gamma per 1% move, 2019–2026 | Now about −$7.3B, near the low of the range
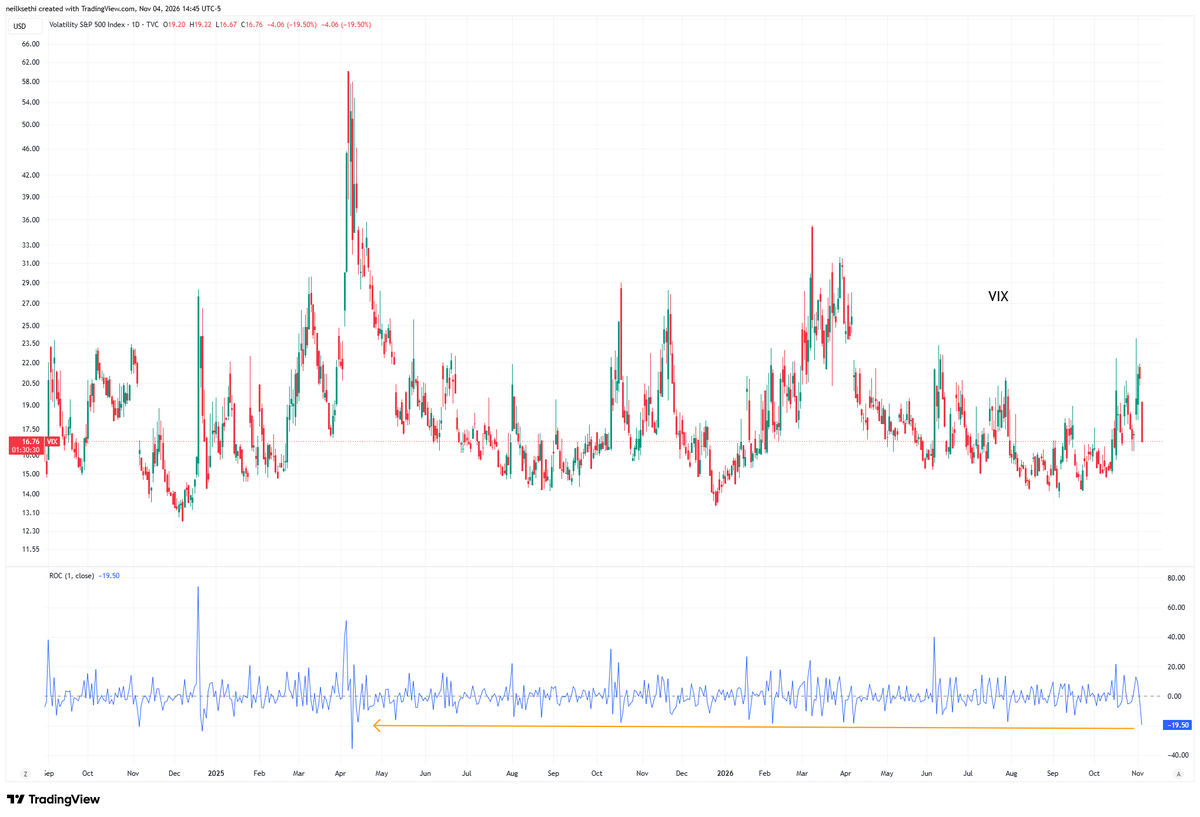
Cboe VIX daily with 1-day rate of change | Latest 1-day move −19.5%, index at 16.76 amid sharp swings
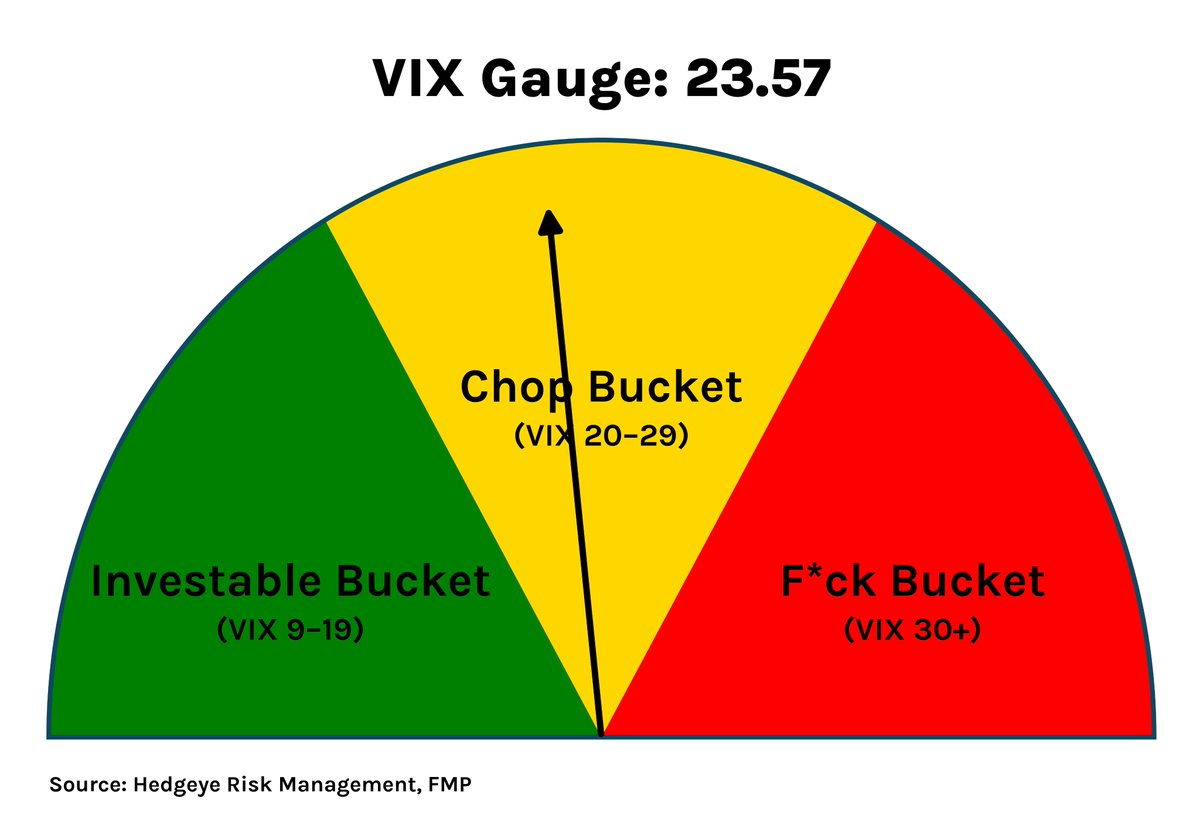
VIX regime gauge | Now 23.57, in the 20–29 chop band, above the 9–19 low-volatility zone
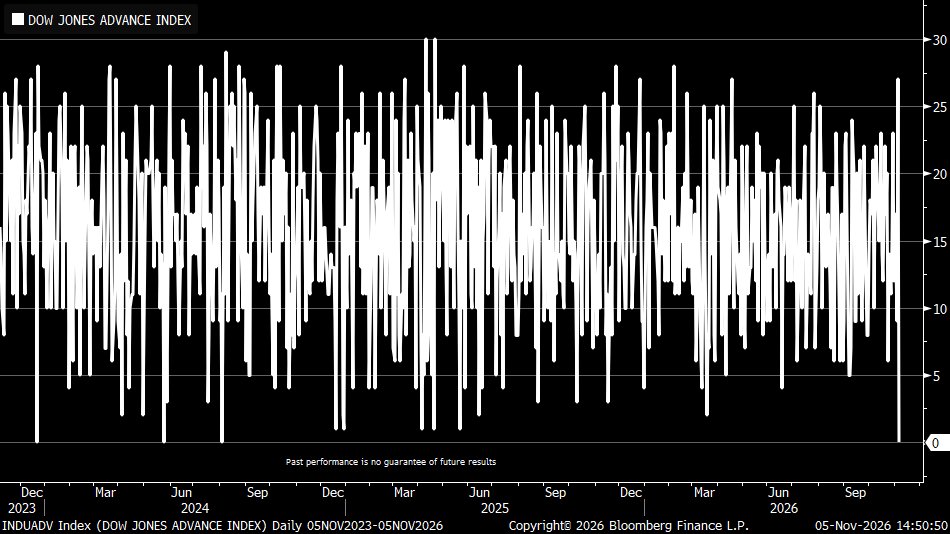
Daily count of advancing Dow Industrials members, 2023-2026 | Latest reading falls to 0, with all 30 components lower
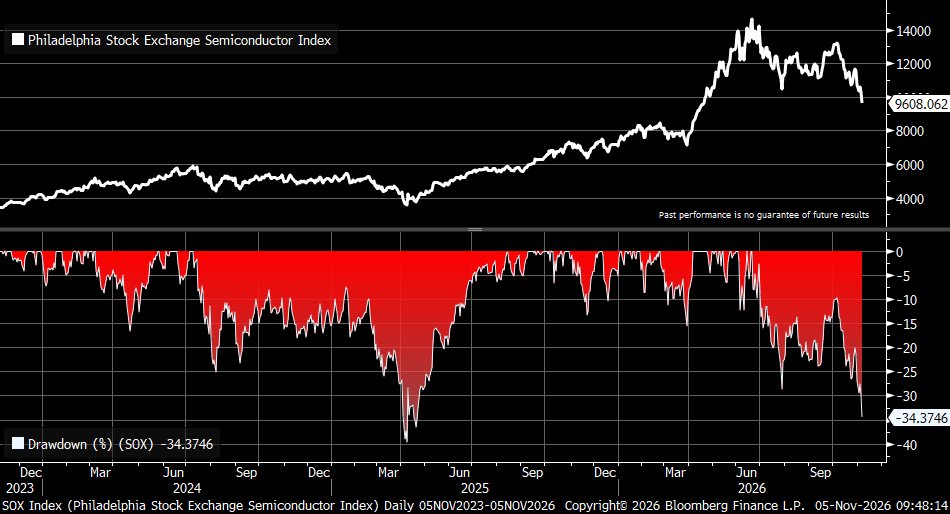
Philadelphia Semiconductor Index (SOX) daily with drawdown, 2023–2026 | Latest 9,608, down 34.4% from its high
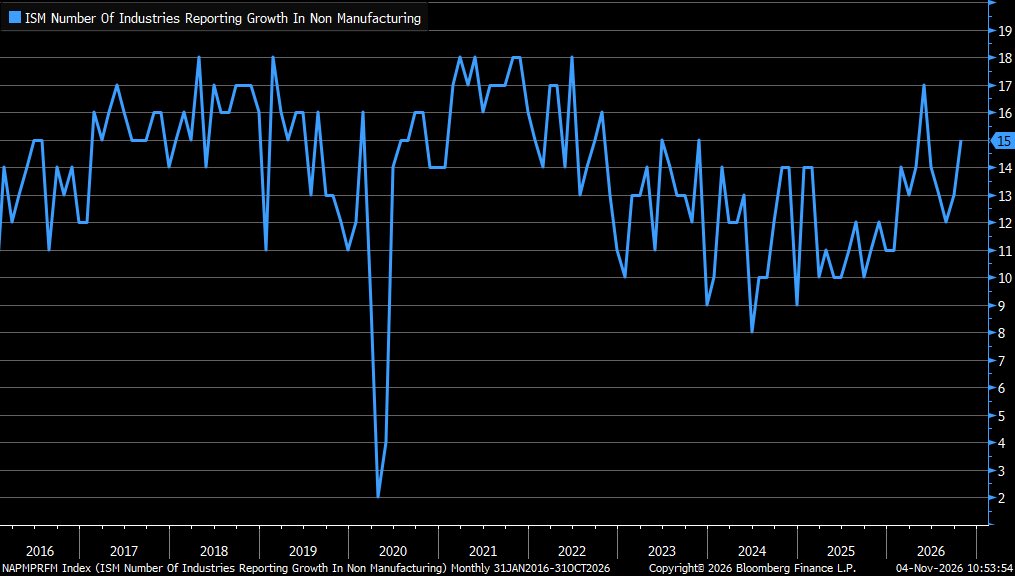
Number of ISM non-manufacturing industries reporting growth, 2016-2026 | Rose to 15 in October from 13, well above the 2020 low of 2
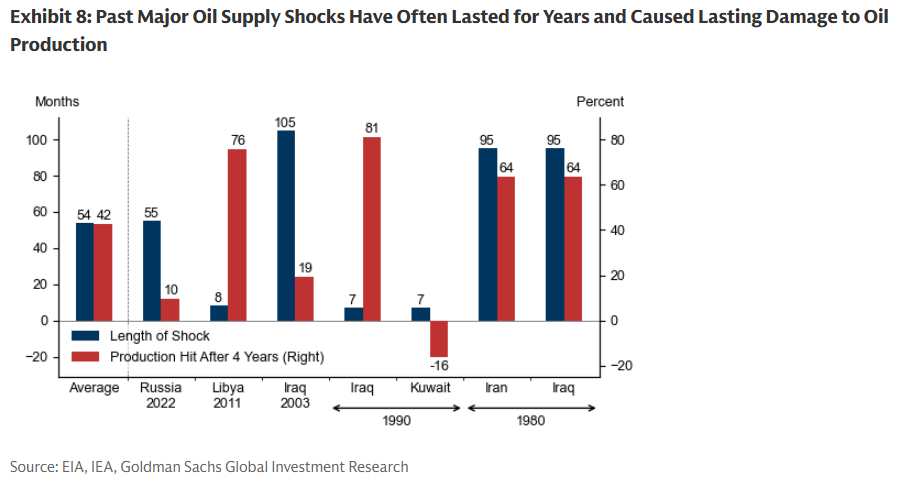
Length of past oil supply shocks and production hit after four years | Average 54 months, production down about 42%
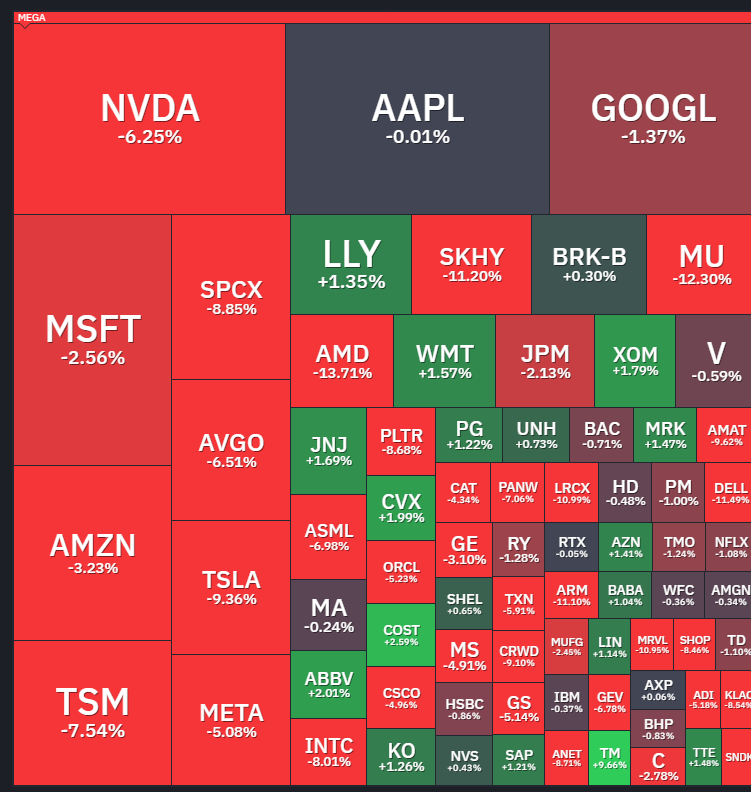
US large-cap single-day performance heatmap | Nvidia −6.25%, Micron −12.3%, AMD −13.71% lead tech lower
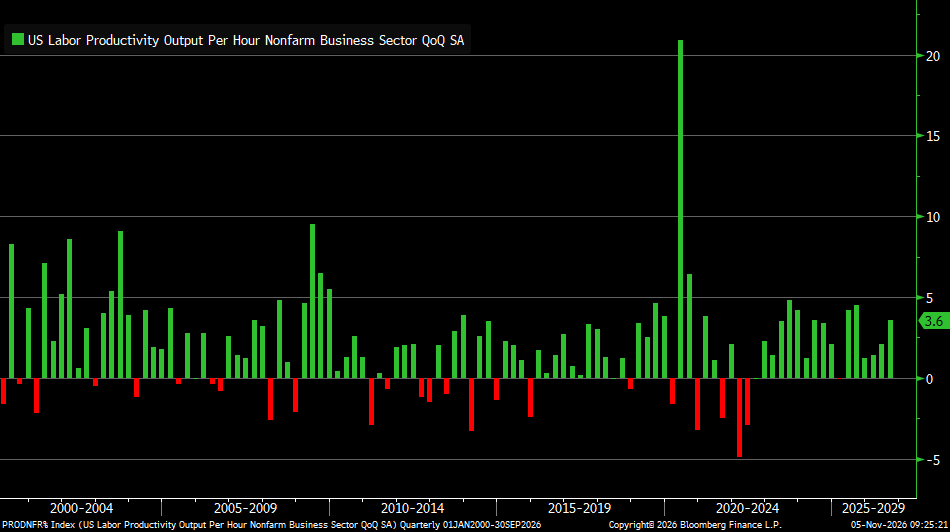
US nonfarm labor productivity, QoQ annualized, 2000–2026 | Q3 +3.6%, above the ~2.1% average since 2000
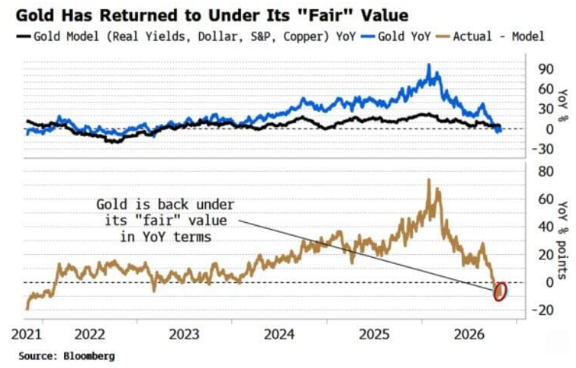
Gold YoY vs a model of real yields, dollar, S&P and copper, 2021–2026 | Actual-minus-model back to about −10 ppts
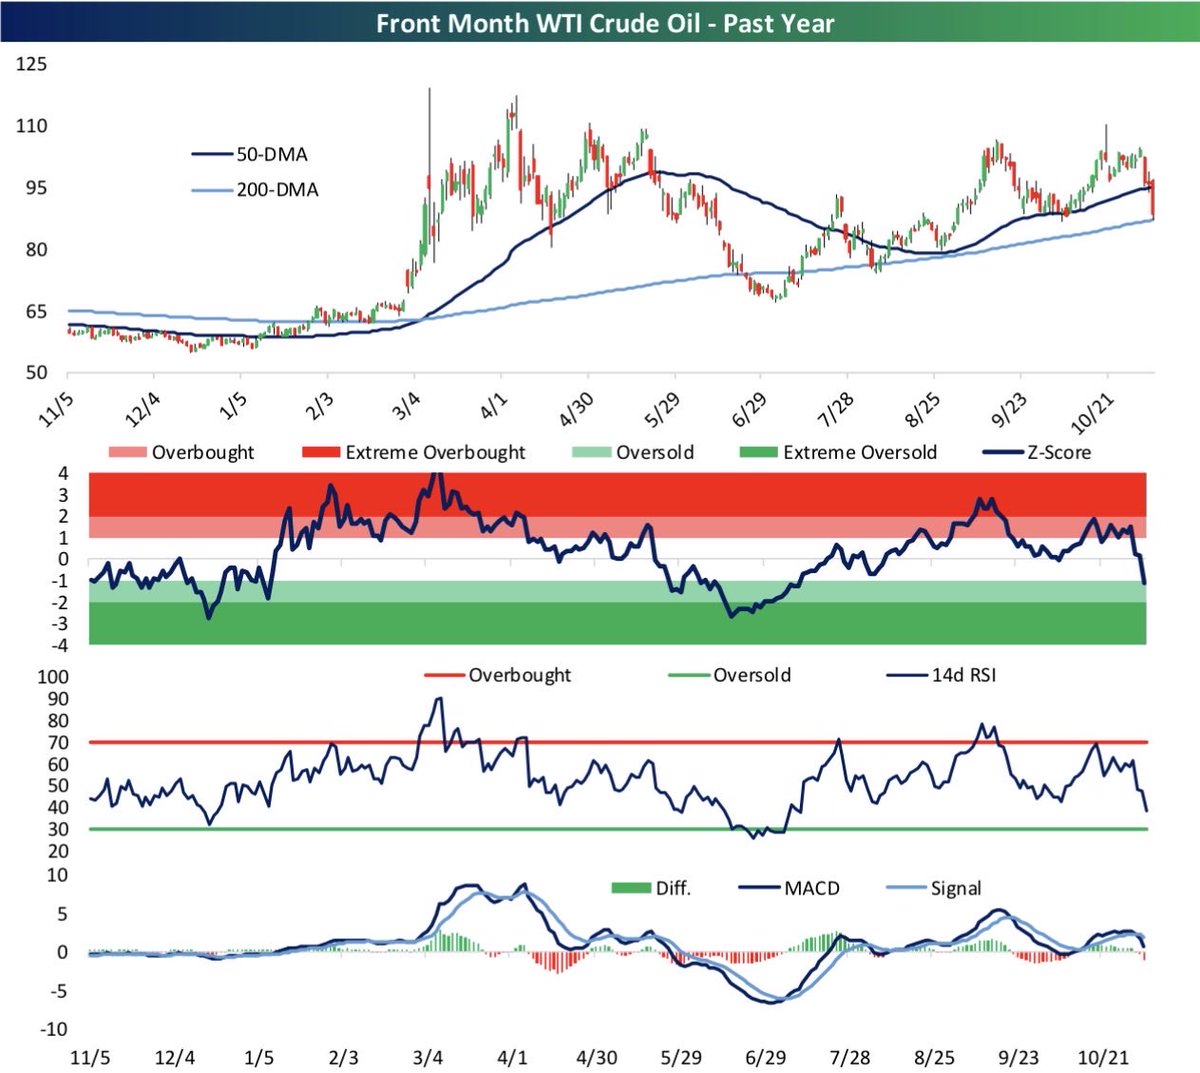
Front-month WTI crude, past year with technicals | Near $83, just above the 200-day average as Z-Score and 14-day RSI roll over
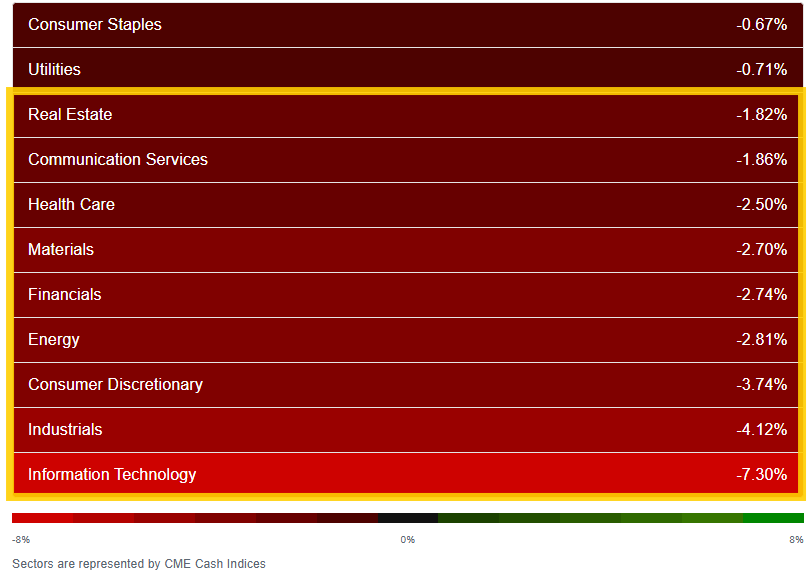
S&P 500 sector single-day performance | Information Technology −7.3%, Industrials −4.12%, every sector red
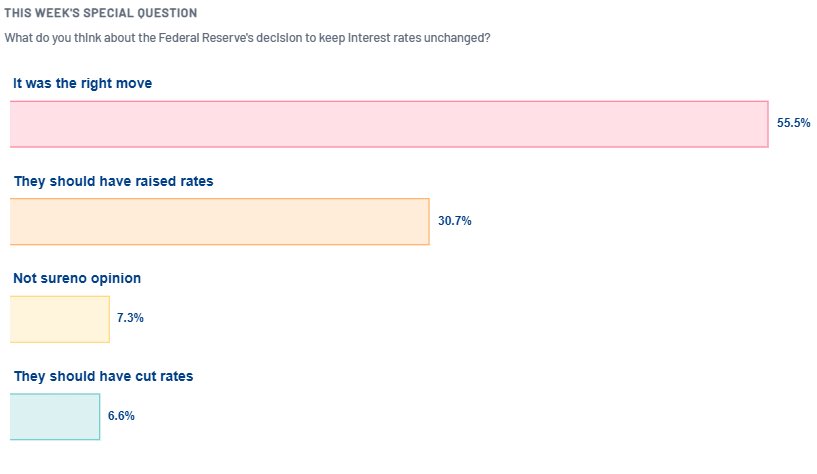
AAII members on the Fed's decision to hold rates | 55.5% call it the right move, 30.7% leaned toward a hike, just 6.6% toward a cut
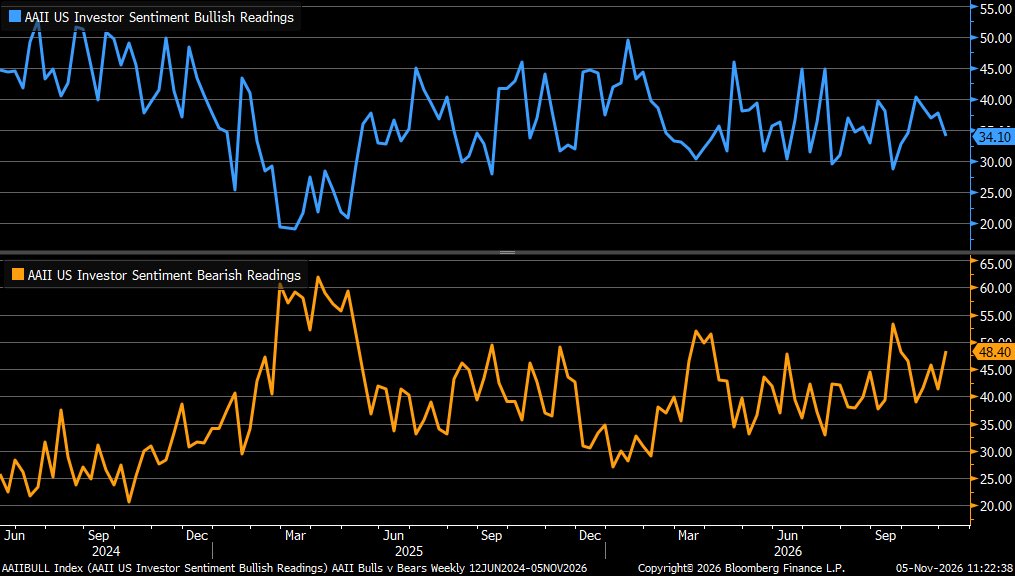
AAII investor bullish and bearish readings, weekly, 2024–2026 | Bulls 34.1%, bears 48.4%, pessimism at a seven-week high
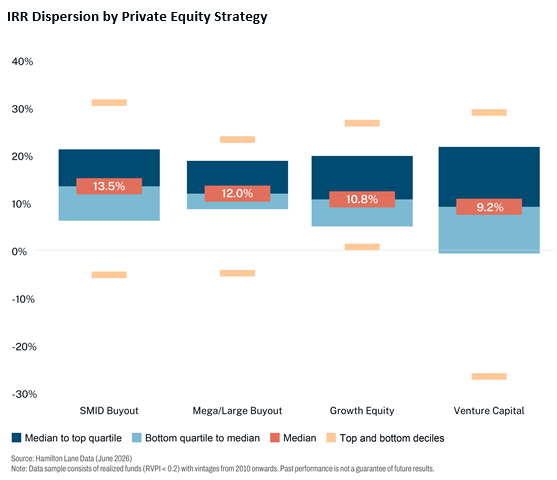
Median IRR and dispersion across four PE strategies | SMID buyout median 13.5% tops the group; venture capital 9.2% with the widest spread
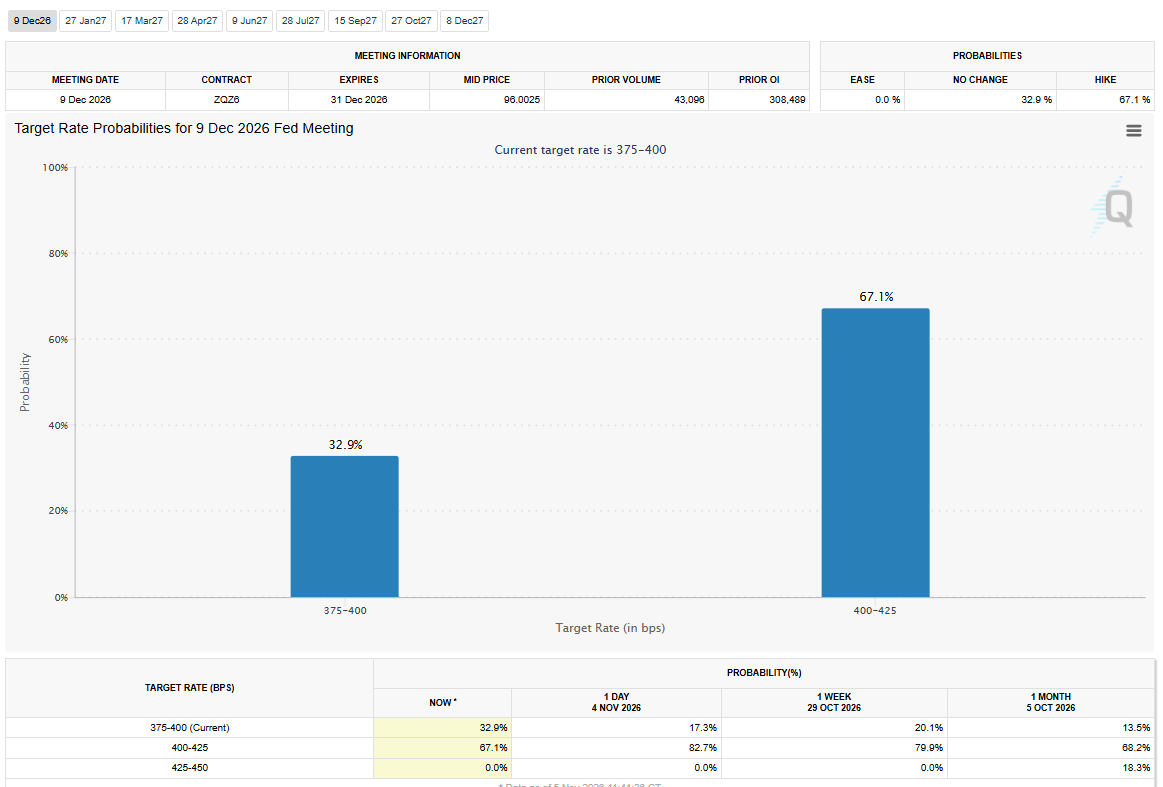
Target-rate probabilities for the Dec 9 FOMC (current 375–400 bp) | 400–425 bp at 67.1%, down from 82.7% a day earlier
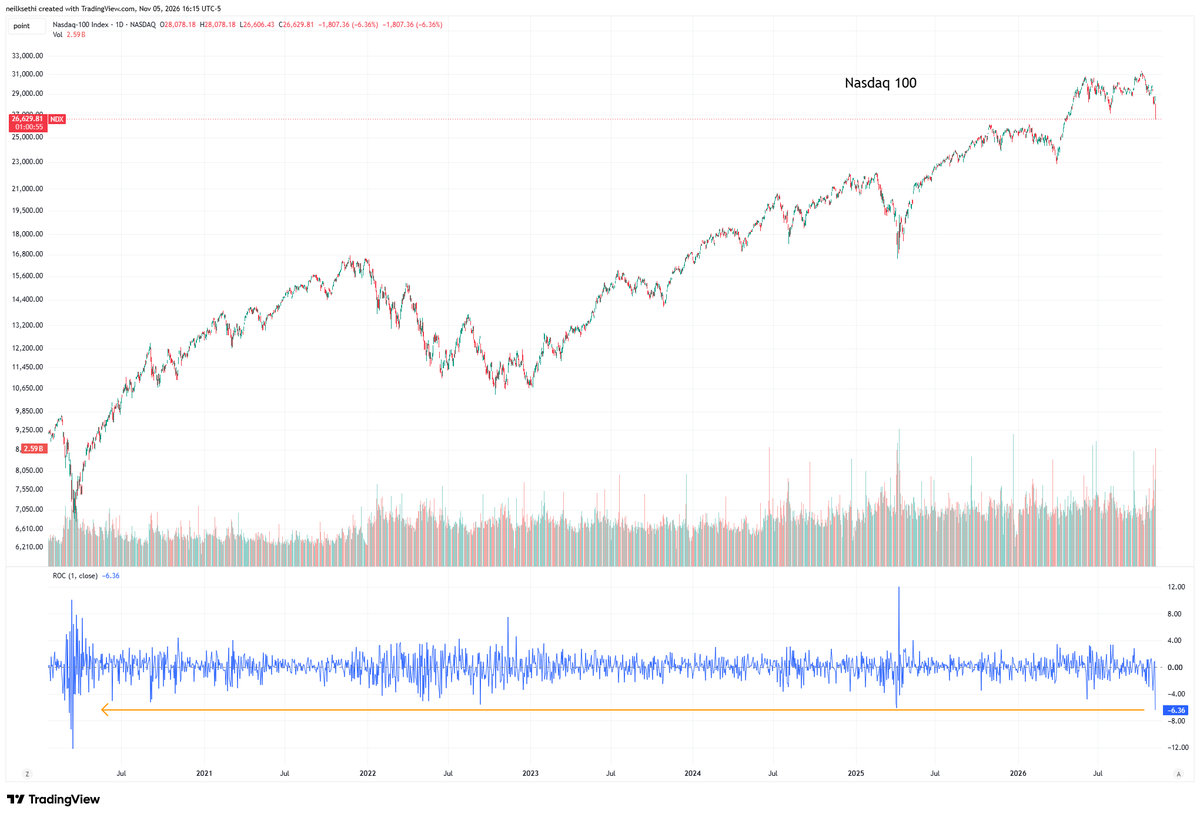
Nasdaq 100 daily with 1-day rate of change | −6.36% (about 1,807 points), among the largest single-day drops in years
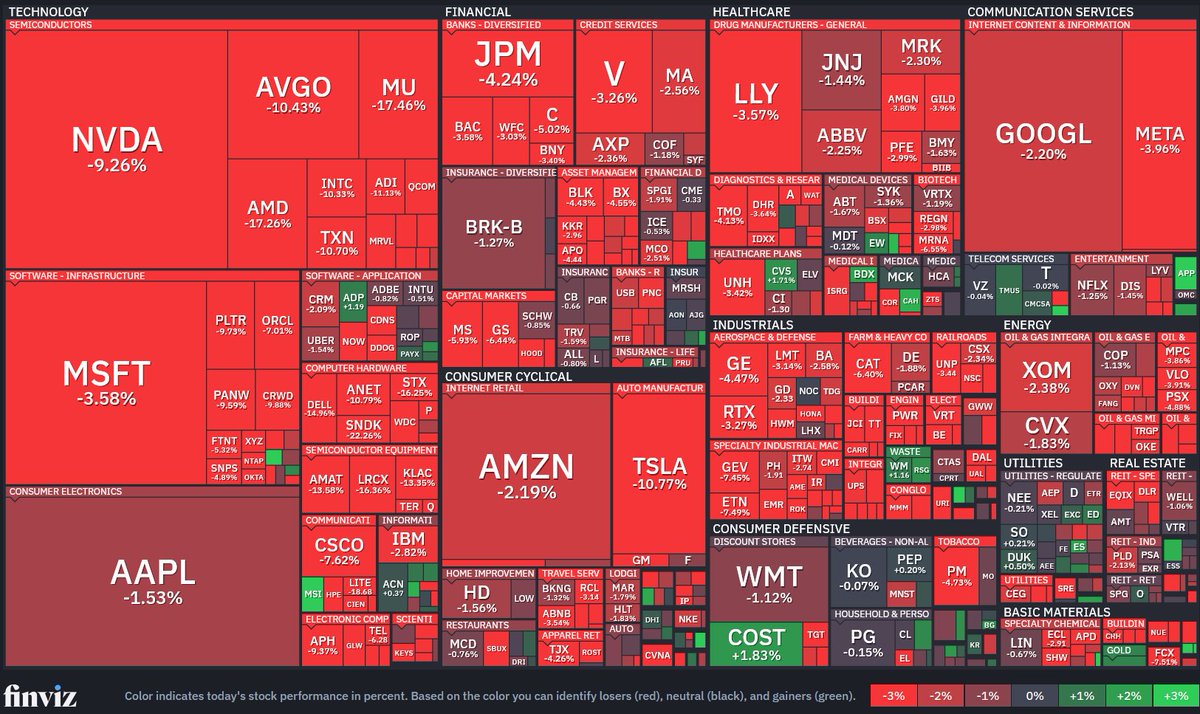
S&P 500 full-market single-day performance heatmap | Nvidia −9.26%, Micron −17.46%, AMD −17.26%, most sectors red
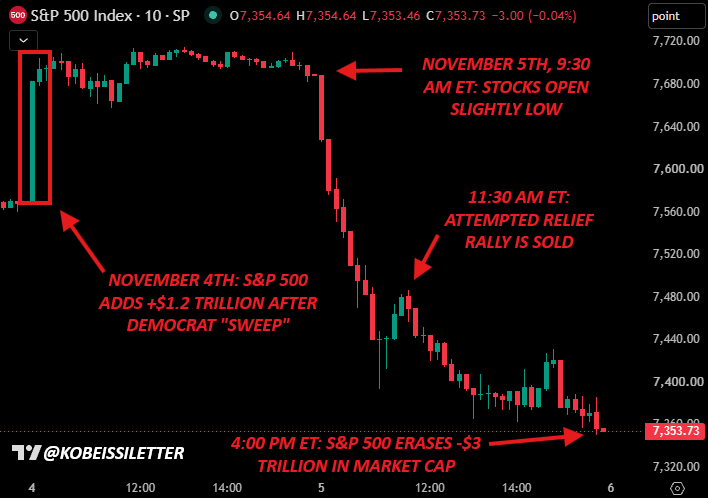
S&P 500 10-minute chart, Nov 4–5 | +$1.2T after the election, then about −$3T on Nov 5
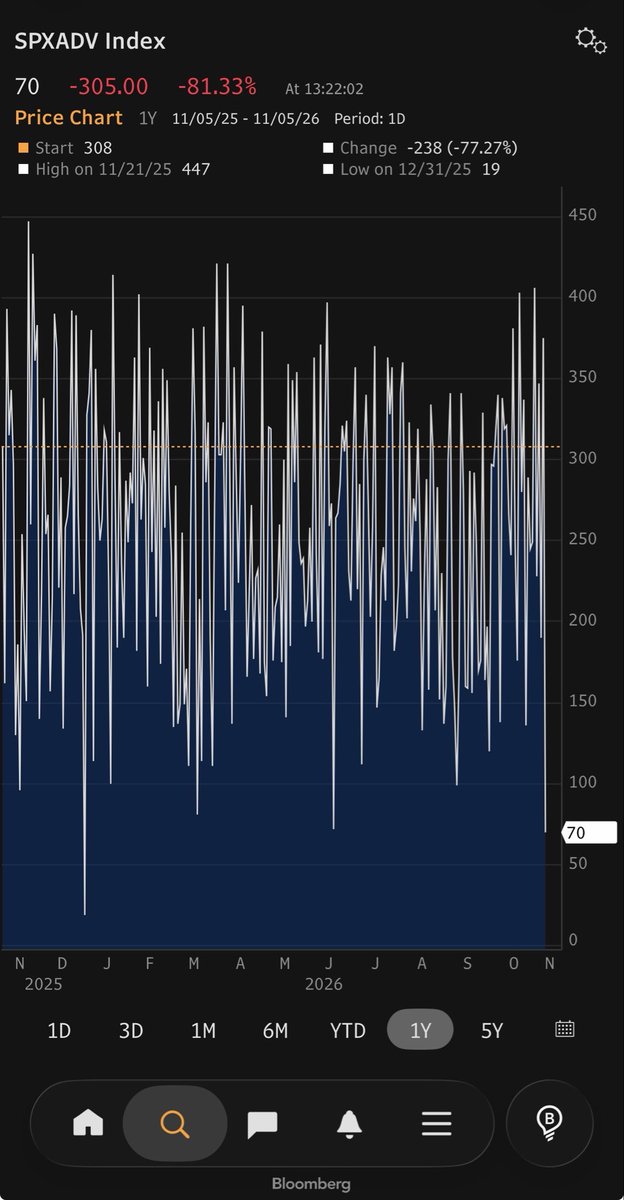
Daily count of advancing S&P 500 members, past year | Just 70 today, the fewest in 2026, down from a high of 447 last November
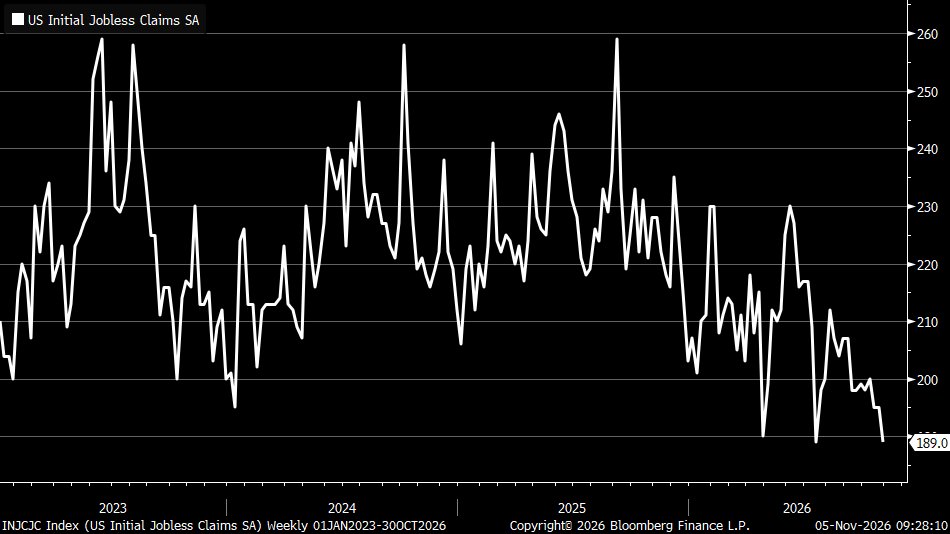
US initial jobless claims, weekly, 2023–2026 | Latest 189k, near the low end of the recent range
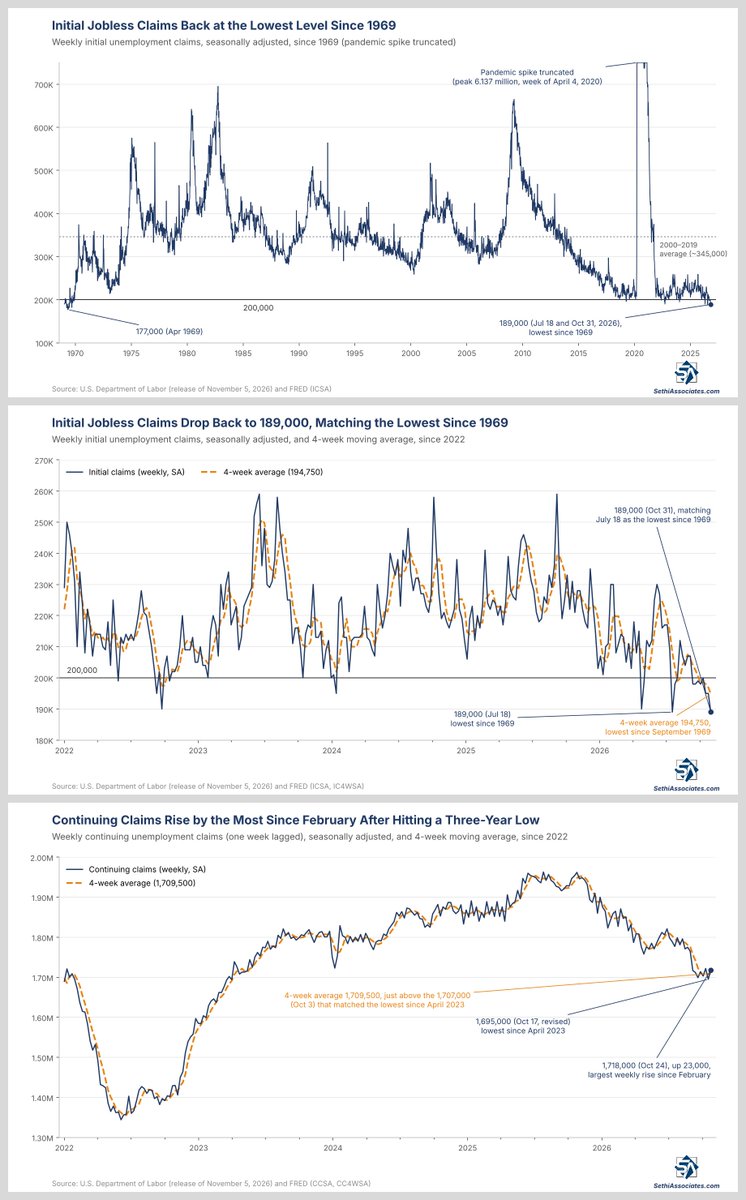
Weekly US initial jobless claims since 1969 | 189,000 for the week of Oct 31 ties July 18 as the lowest since 1969; four-week average 194,750
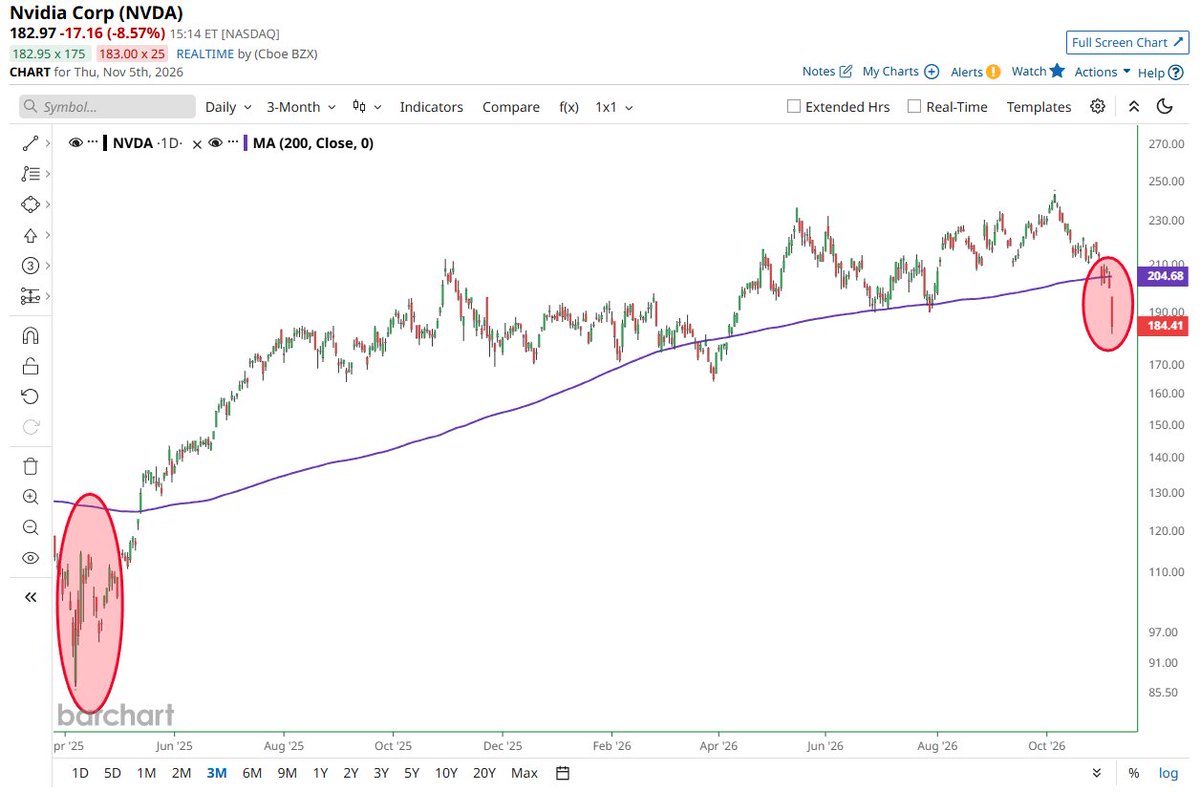
Nvidia daily with 200-day moving average | Closed 182.97, below the 200-DMA at 204.68, −8.57% on the day
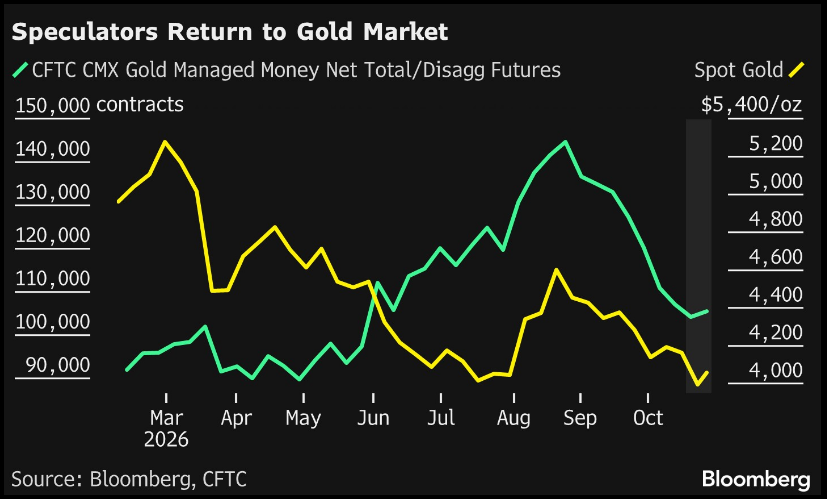
CFTC COMEX gold managed-money net futures vs spot gold | Net longs peaked near 142k in Sept, pulled back, now ticking up
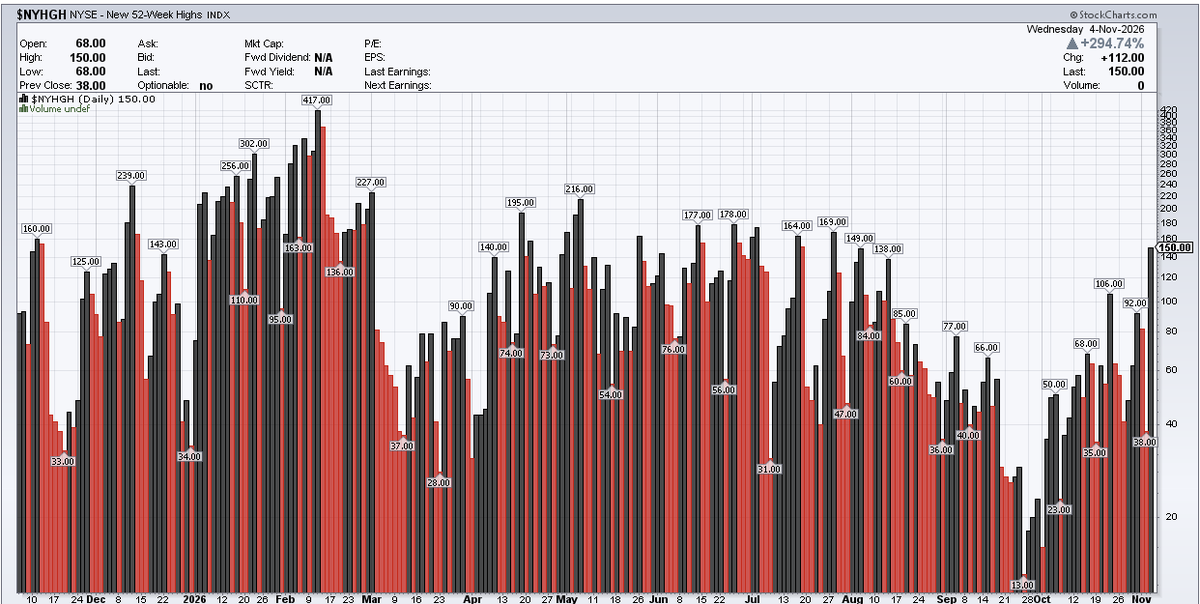
NYSE new 52-week highs, daily | Latest 150, up from 38 the prior day
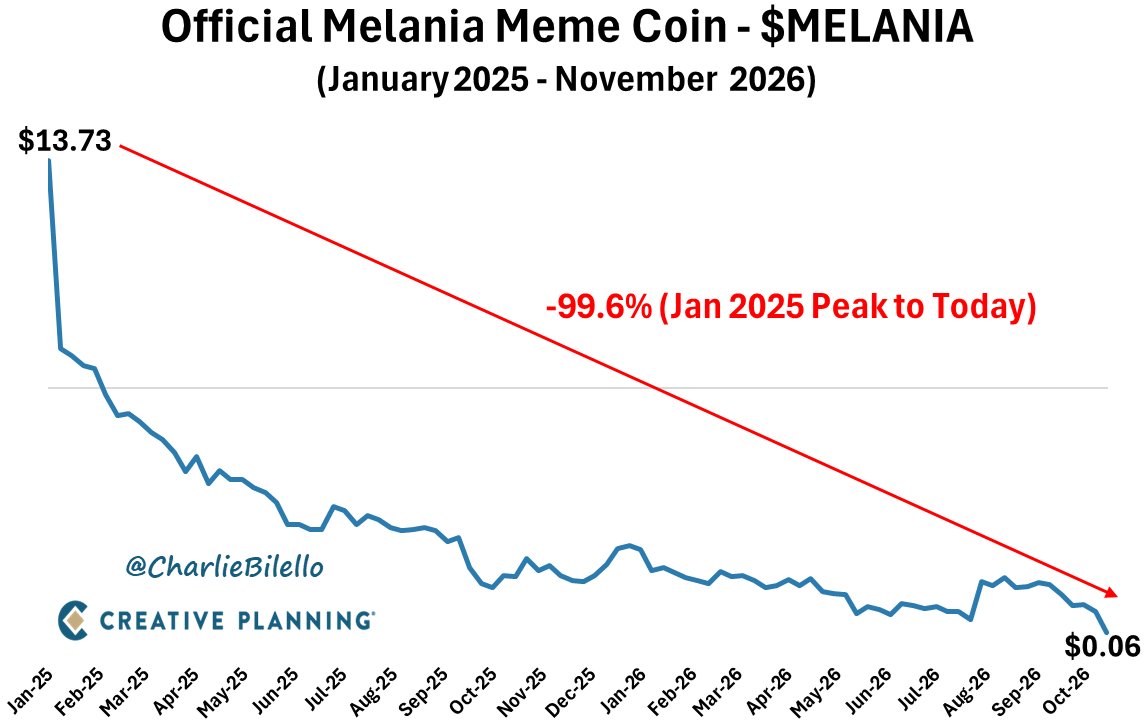
$MELANIA price, Jan 2025–Nov 2026 | Down 99.6% from the $13.73 peak to $0.06
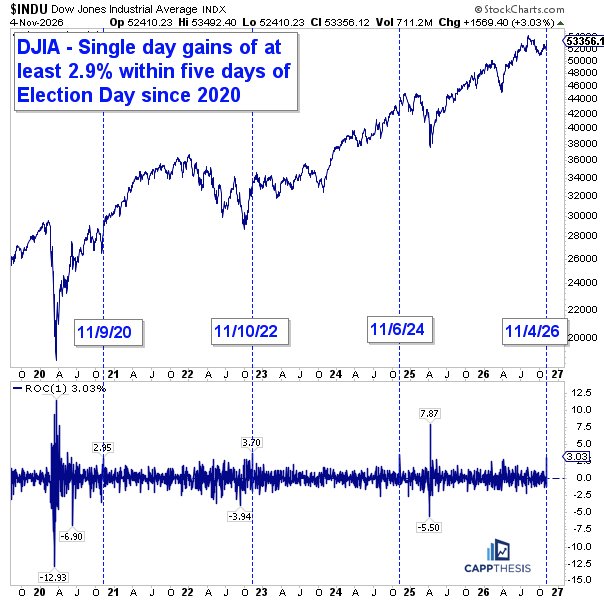
Dow Jones with 1-day rate of change, 2020–2026 | +3.03% on 2026-11-04, echoing surges near past Election Days
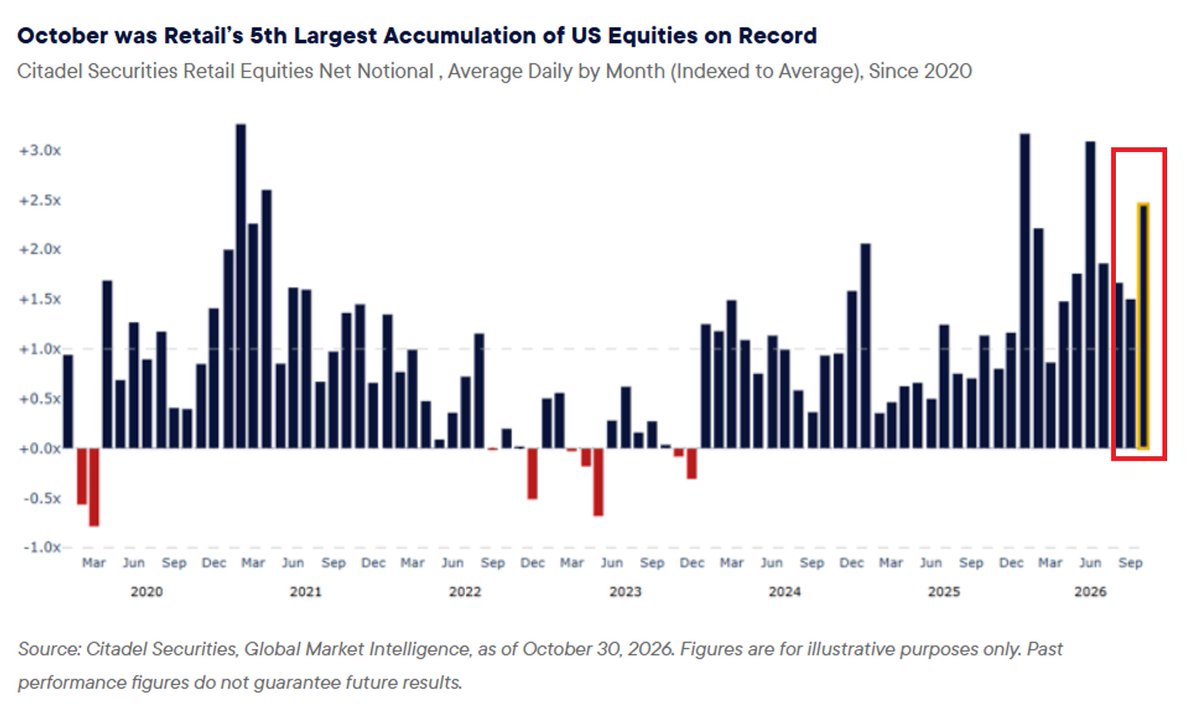
Citadel retail equities net notional, average daily by month (indexed to average), since 2020 | October near 2.4x average
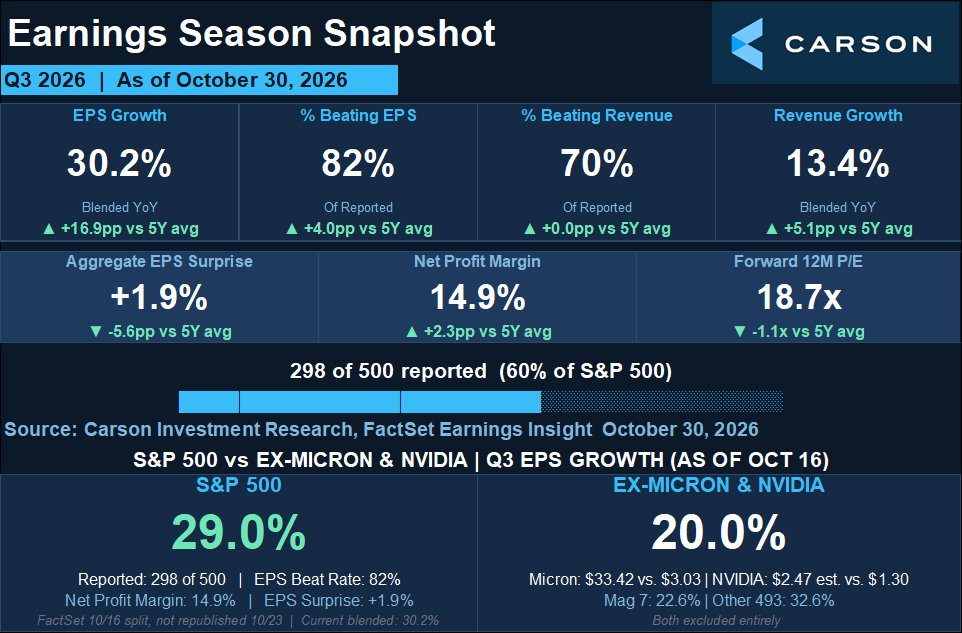
Carson Q3 earnings-season snapshot (298 of 500 reported as of 10/30) | EPS +30.2% YoY, 82% beating EPS, revenue +13.4%
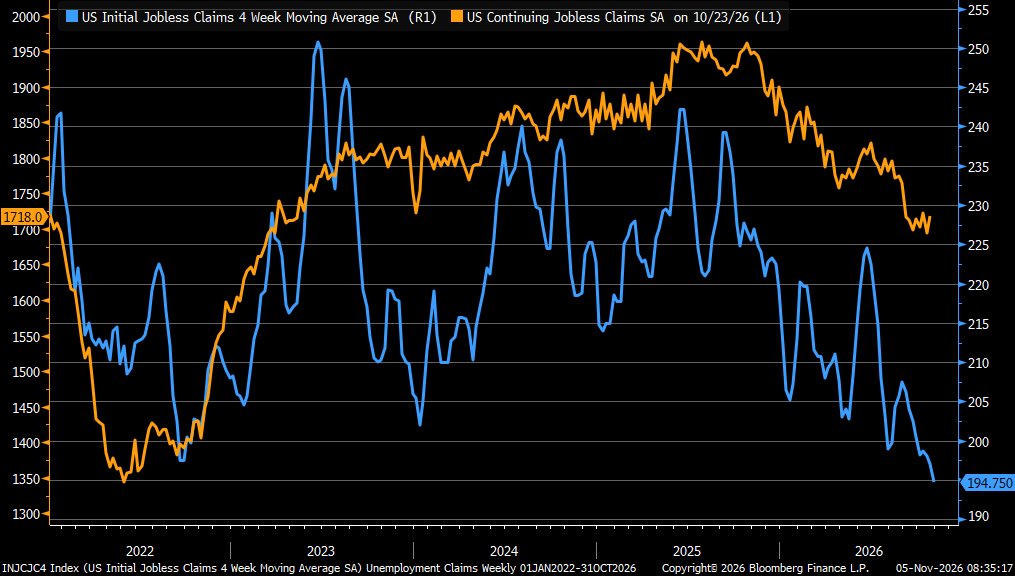
US initial claims 4-week average (R) and continuing claims (L), weekly | 4-wk avg 194.75k, continuing 1.718M
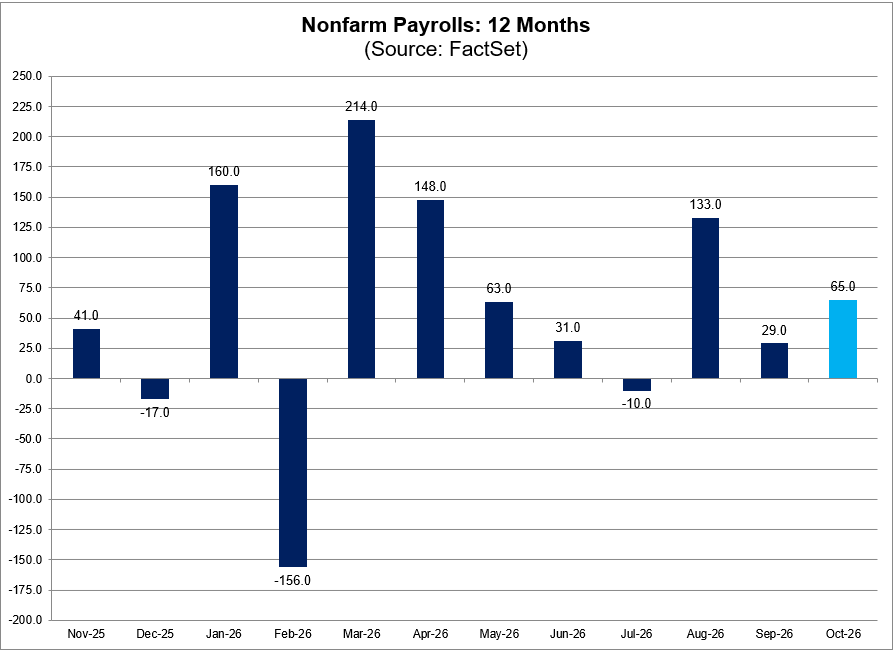
US nonfarm payrolls, monthly change, trailing 12 months (projected) | October projected +65k, above September's +29k
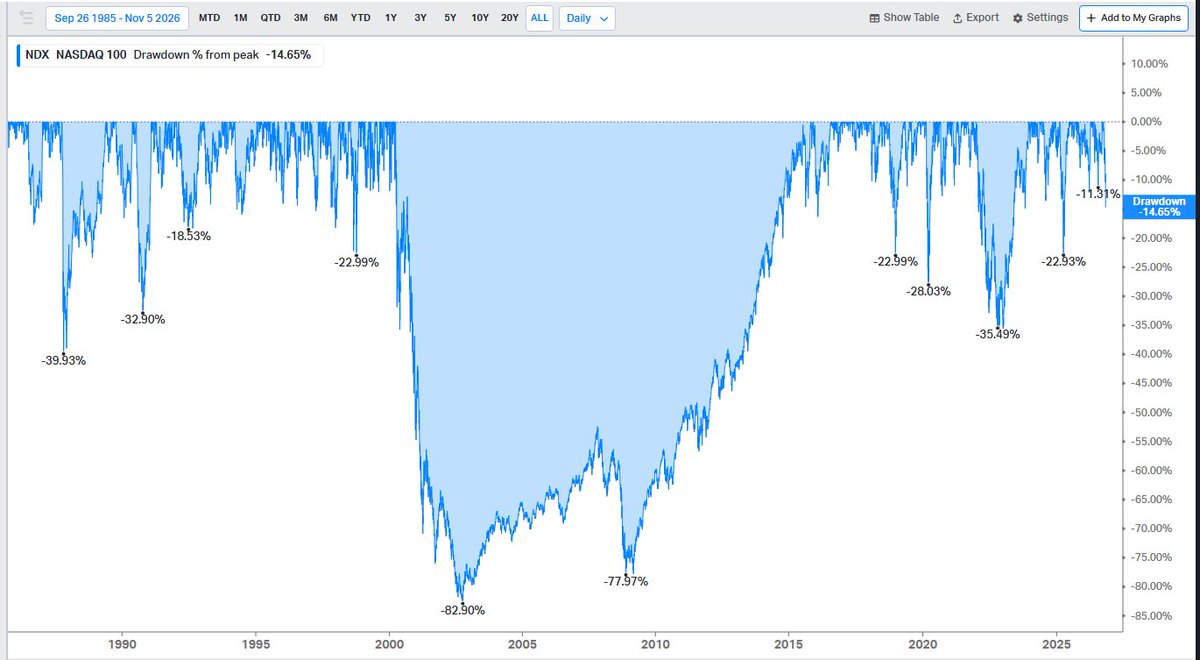
Nasdaq 100 drawdown from all-time high, 1985–2026 | Now −14.65%, among the deeper pullbacks of 2026
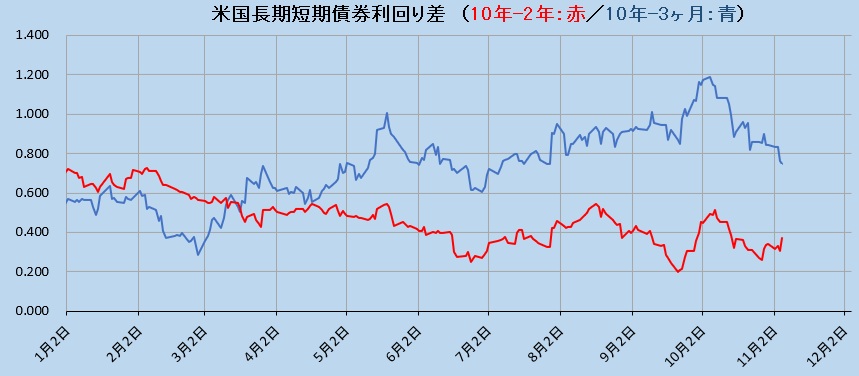
US 10Y–2Y (red) and 10Y–3M (blue) spreads, year to date | 10Y–3M about 0.75, 10Y–2Y about 0.35, an upward-sloping curve
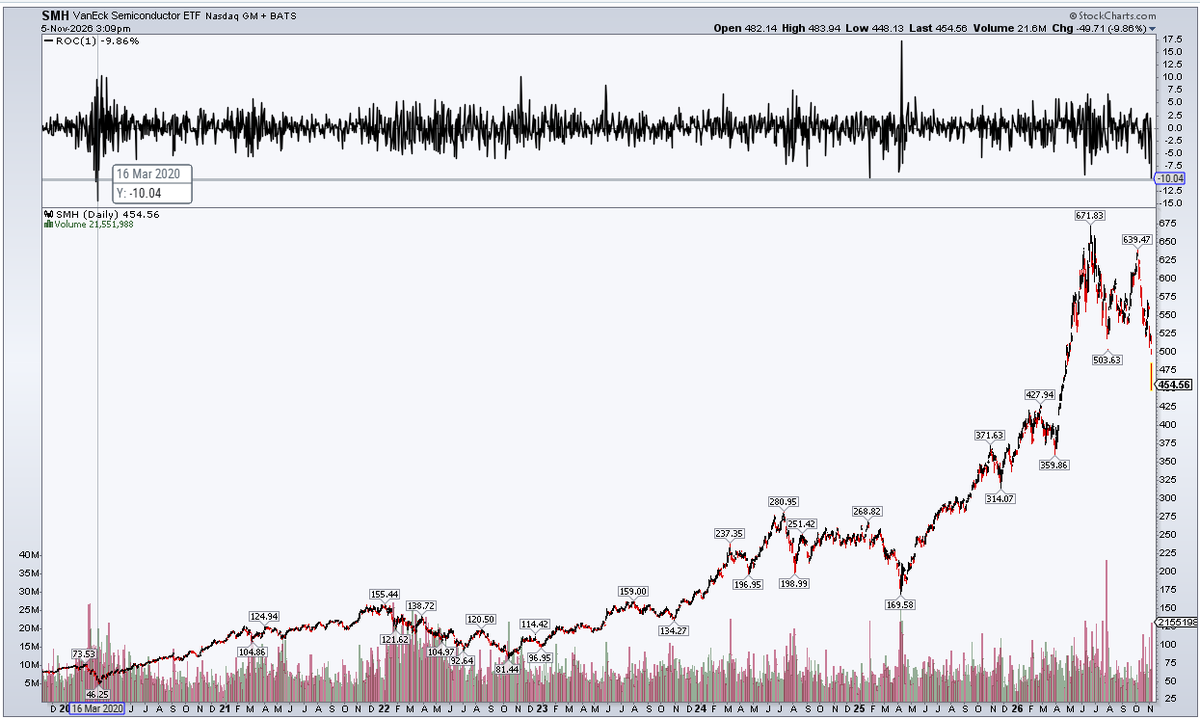
SMH semiconductor ETF daily with 1-day rate of change | Closed 454.56, −9.86%, a drop comparable to March 2020
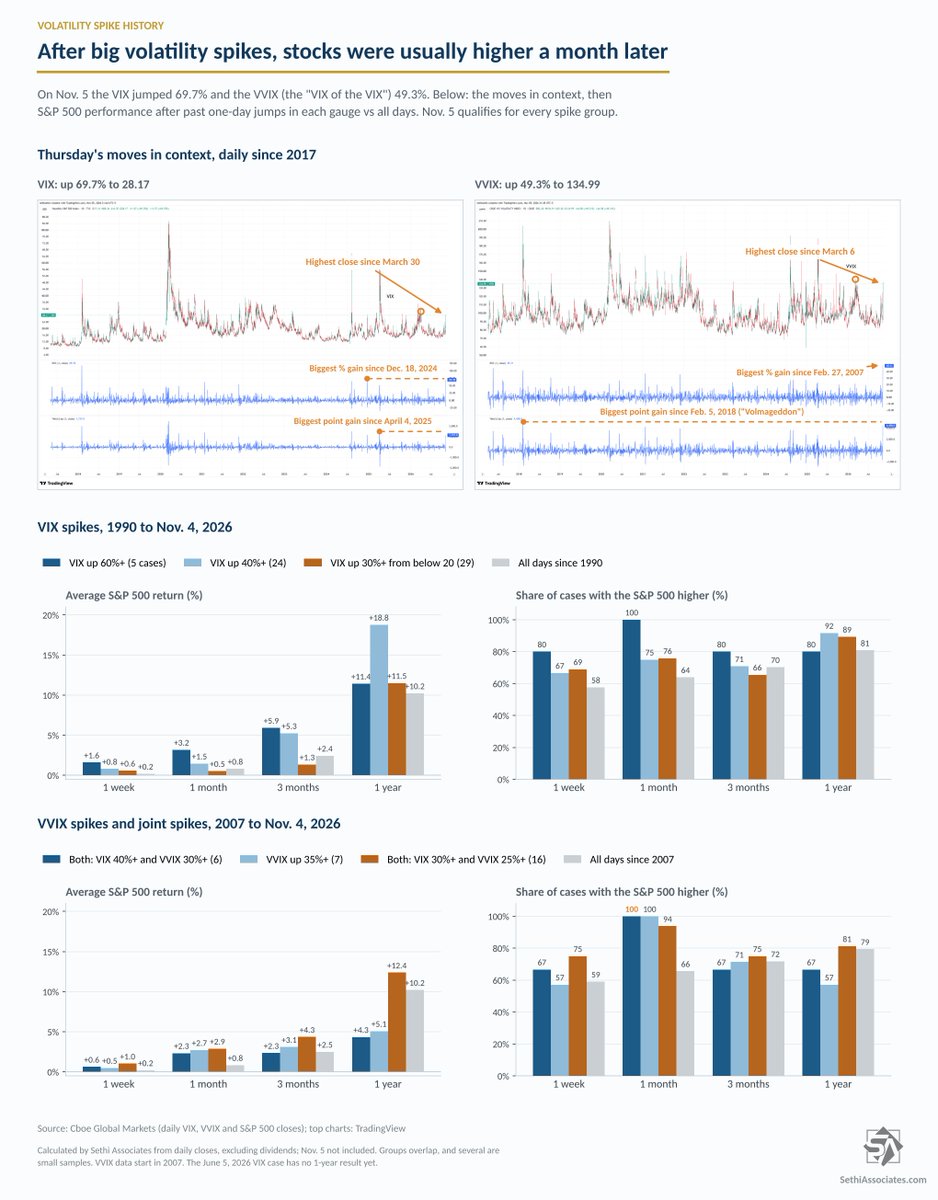
S&P 500 performance after past VIX/VVIX one-day spikes | After 60%+ VIX jumps, the S&P was higher 100% of the time a month later, averaging +3.2%
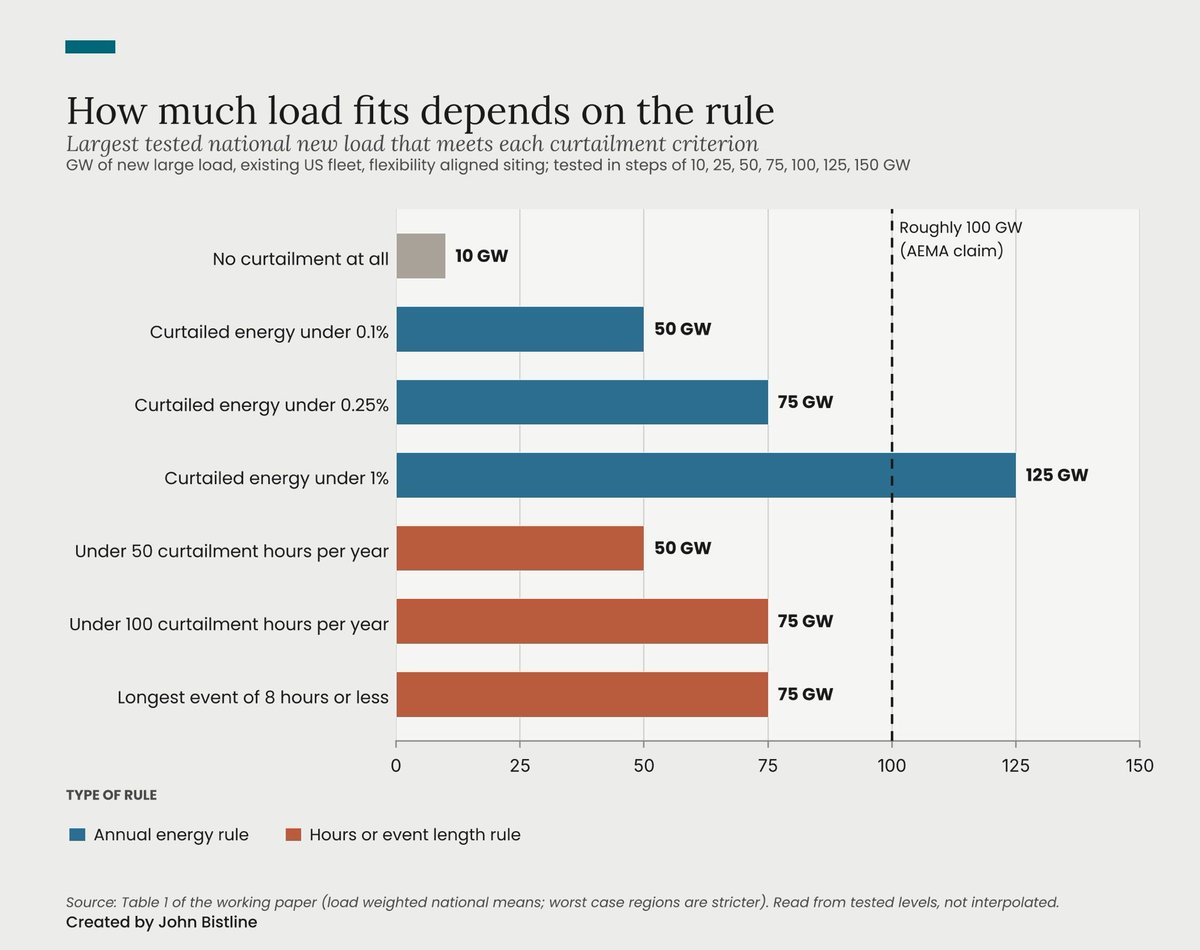
Largest new load meeting each curtailment criterion, GW | Up to 125GW under a 1% annual-energy rule, falling to 50-75GW under hours/event caps
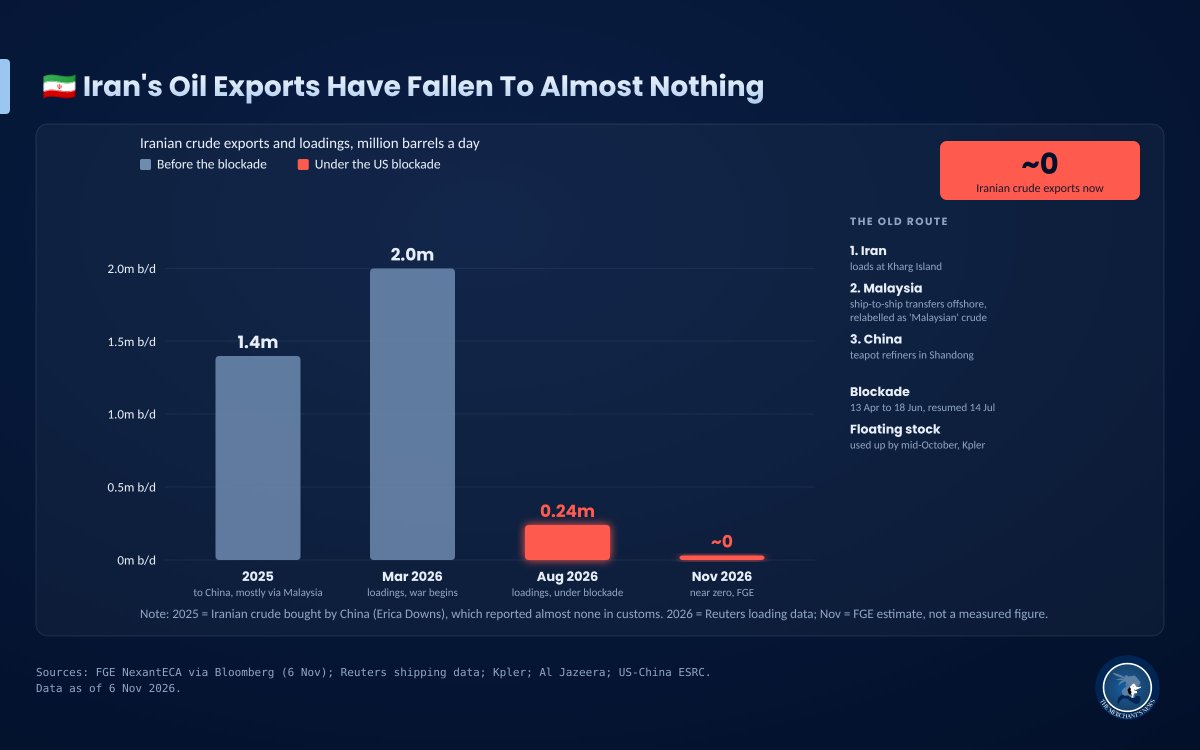
Iranian crude exports and loadings, million barrels a day | From 2.0m b/d in March to 0.24m in August and near zero by November
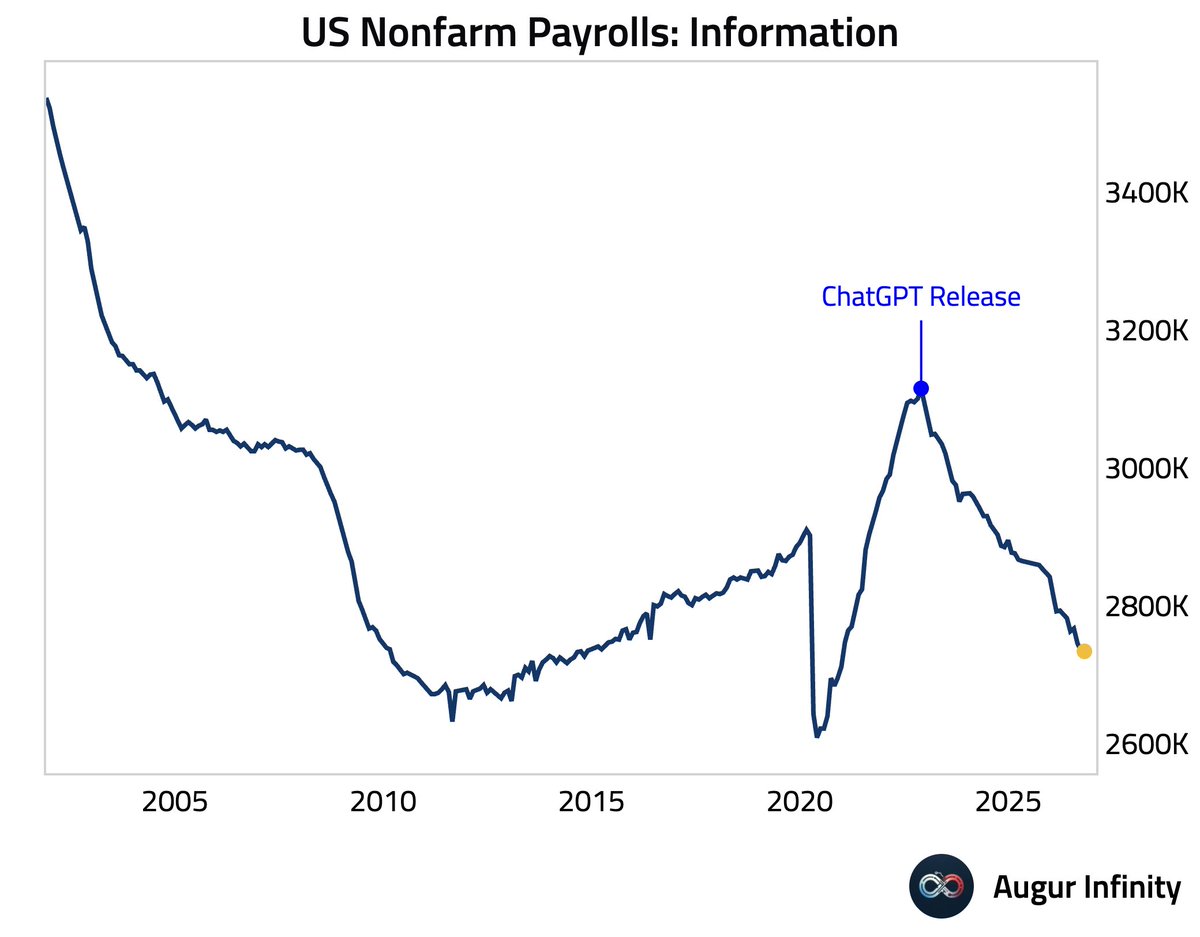
US nonfarm payrolls, information sector | Down to ~2.74M from a ~3.11M peak in late 2022, declining since the ChatGPT release
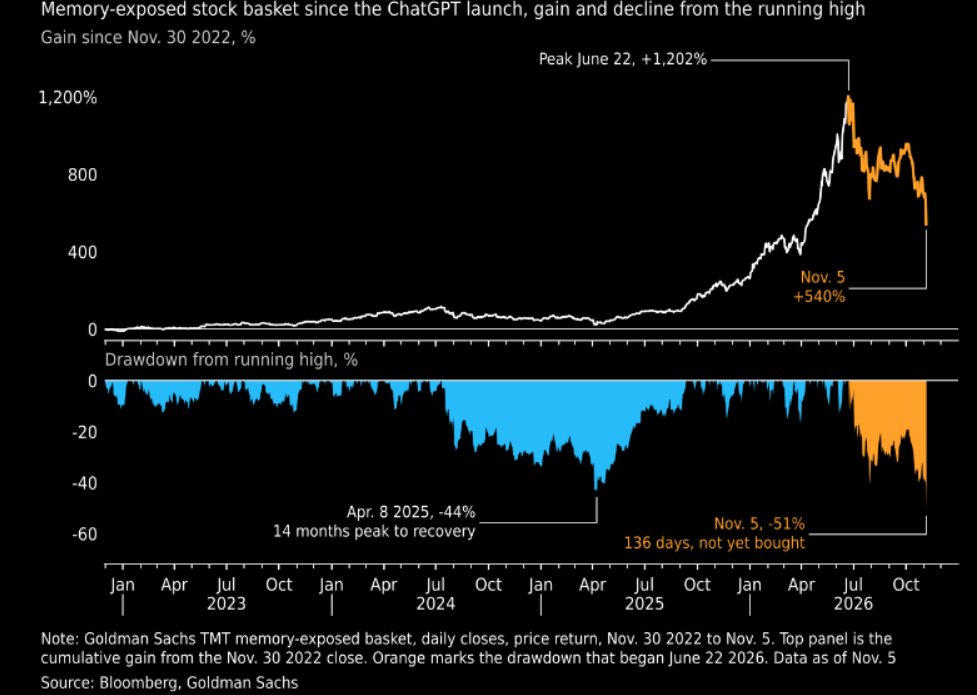
Goldman TMT memory-exposed basket, cumulative gain and drawdown since Nov 2022 | Off the June peak of +1,202% to +540%, a 51% drawdown
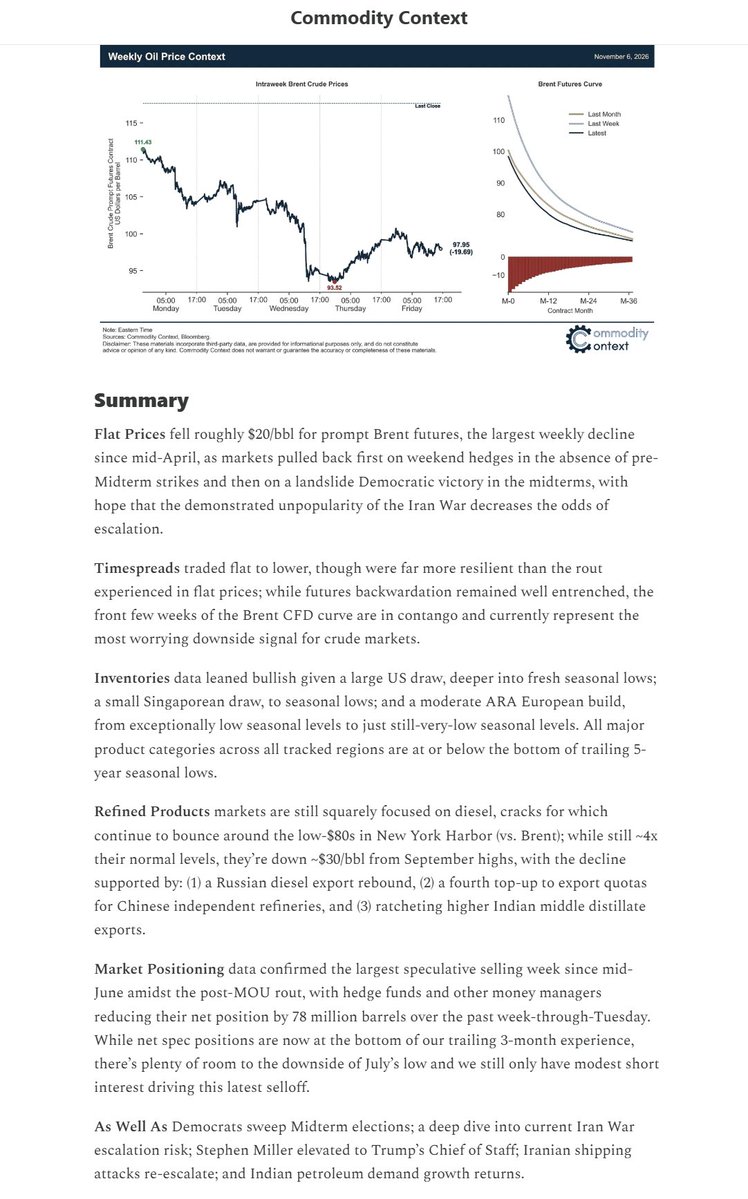
Intraweek Brent prompt futures and the Brent forward curve | Settled at $97.95, down $19.69 on the week, the largest weekly decline since mid-April
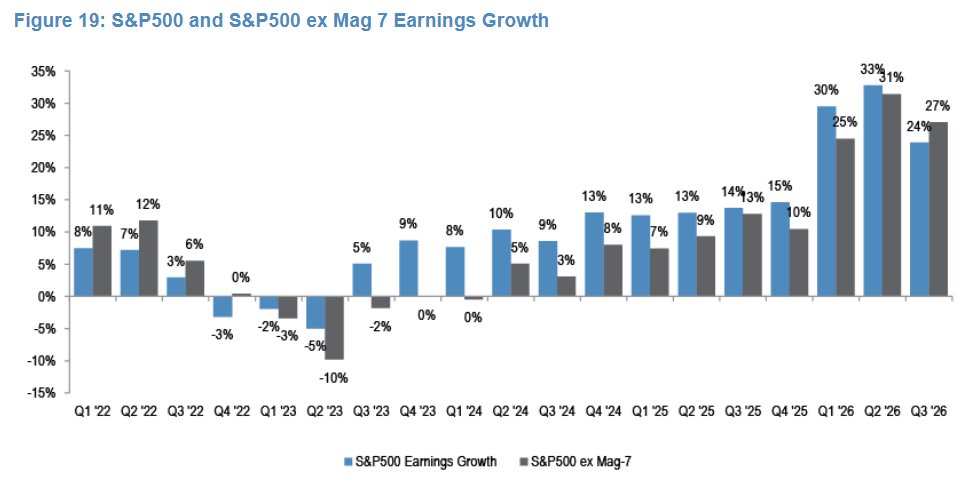
S&P 500 vs S&P 500 ex-Mag-7 EPS growth by quarter | Q3'26 index +24% trails ex-Mag-7 +27%, the first lag since 2022
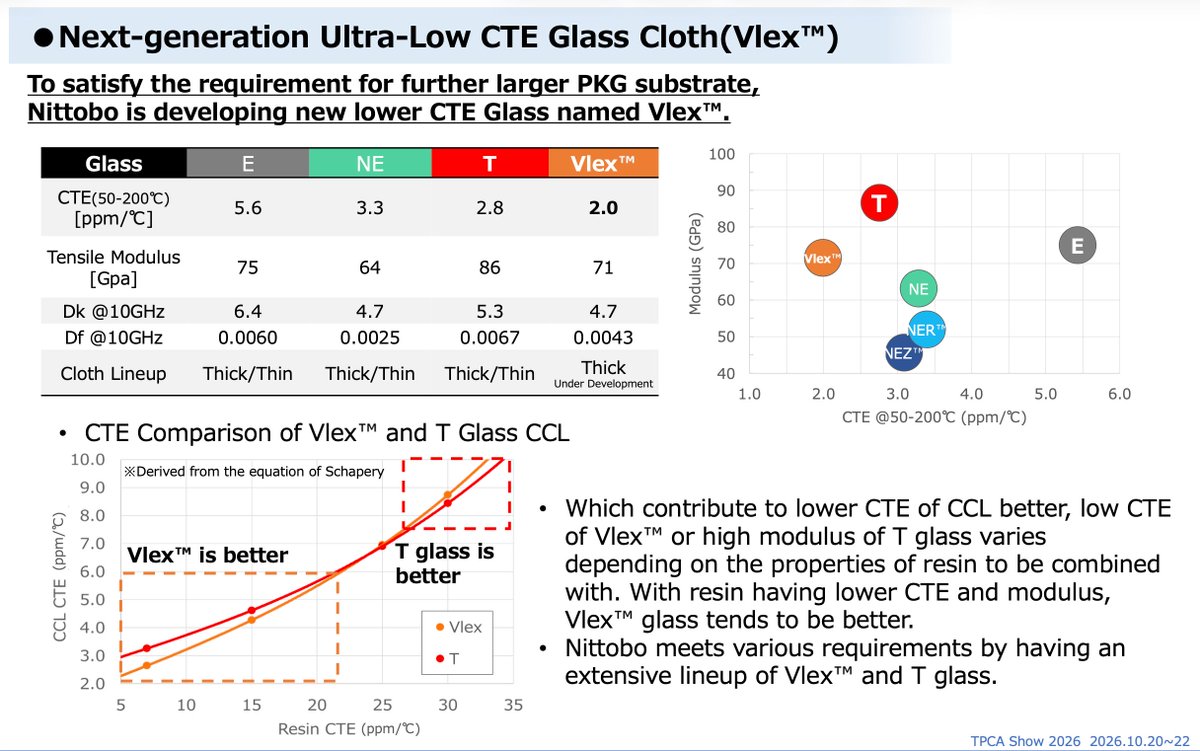
Glass cloth CTE and modulus comparison | Vlex CTE 2.0 ppm/°C beats T 2.8 and NE 3.3 for larger package substrates
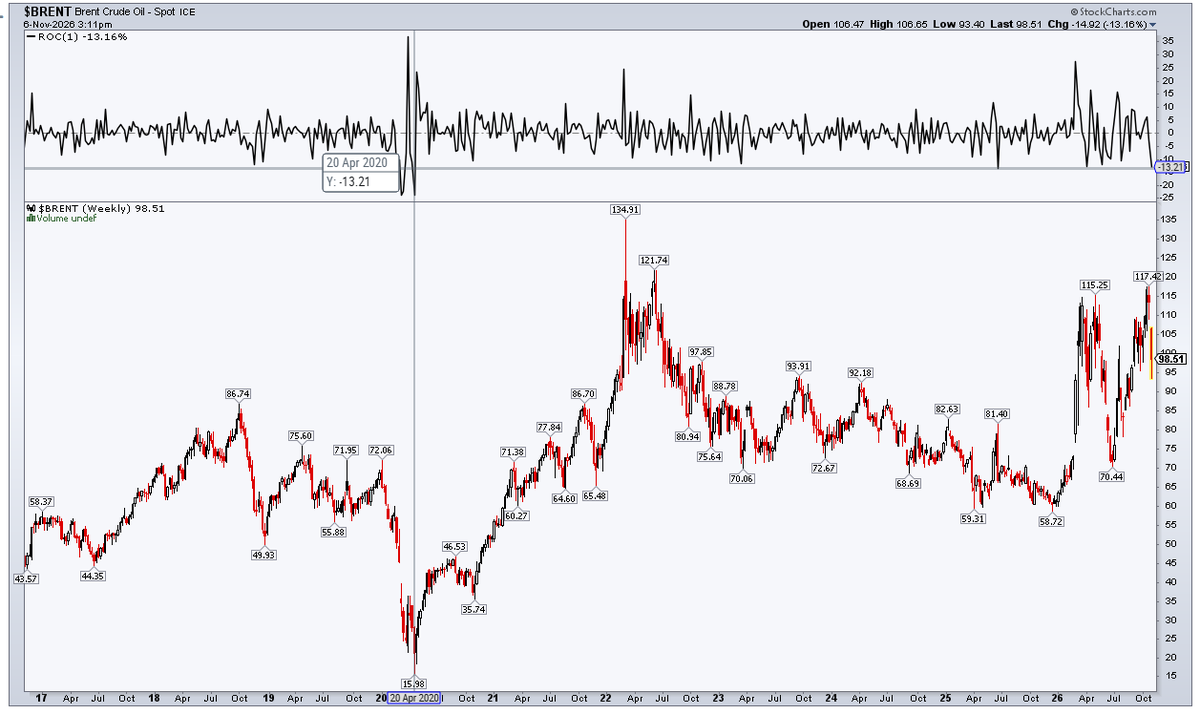
Weekly Brent crude spot price since 2017 | Down 13.16% this week to $98.51, nearly the steepest weekly drop since April 2020
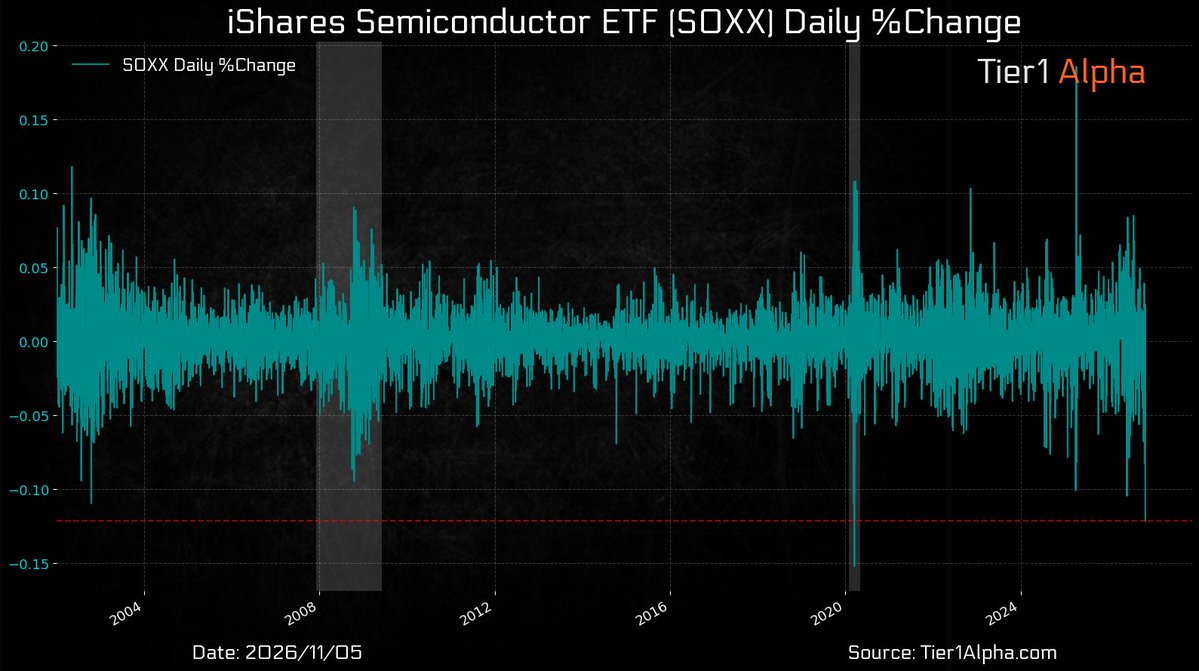
SOXX daily % change since 2003 | A ~12.5% fall on Nov 5 2026, among the largest single-day declines on record
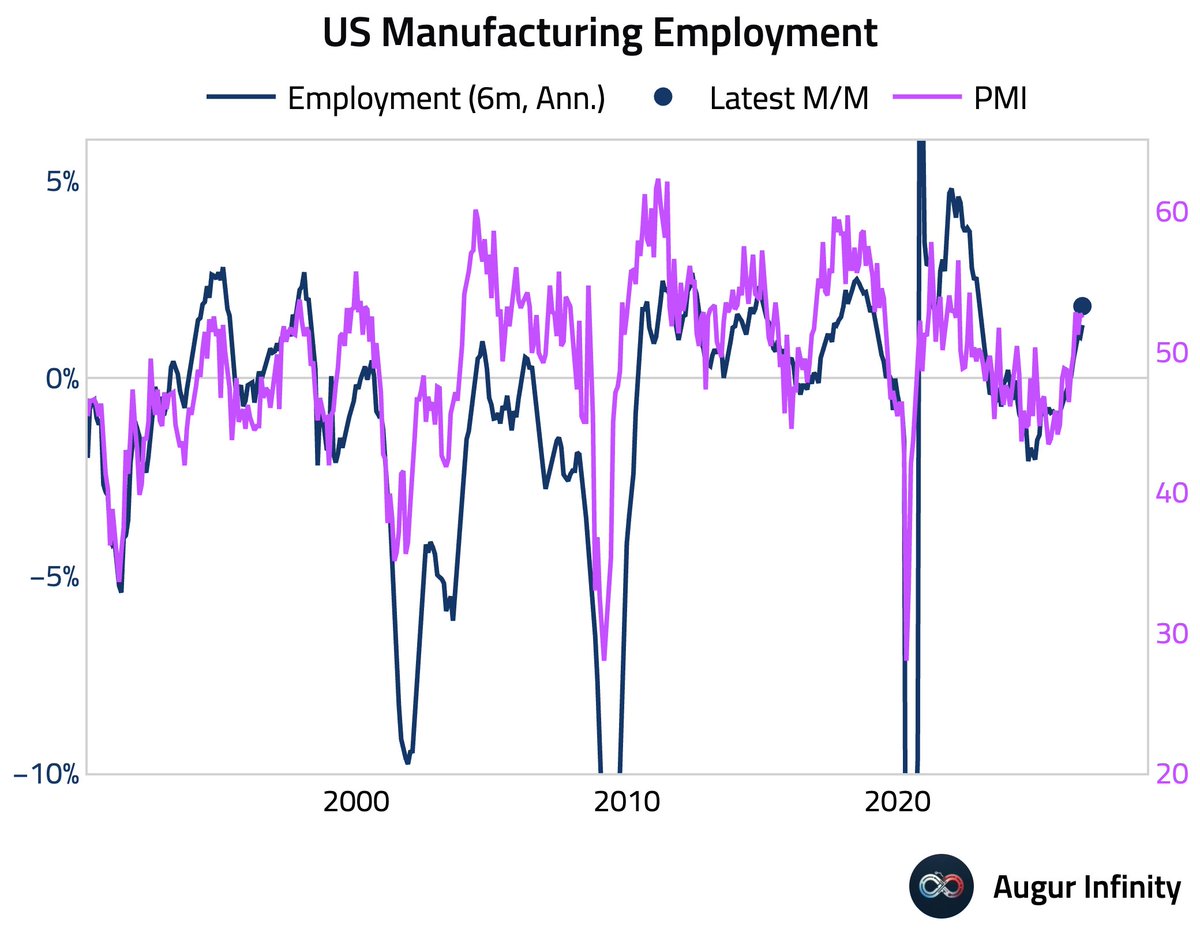
US manufacturing employment growth (6m annualized) vs PMI | Employment growth has rebounded to a multiyear high as PMI firms up
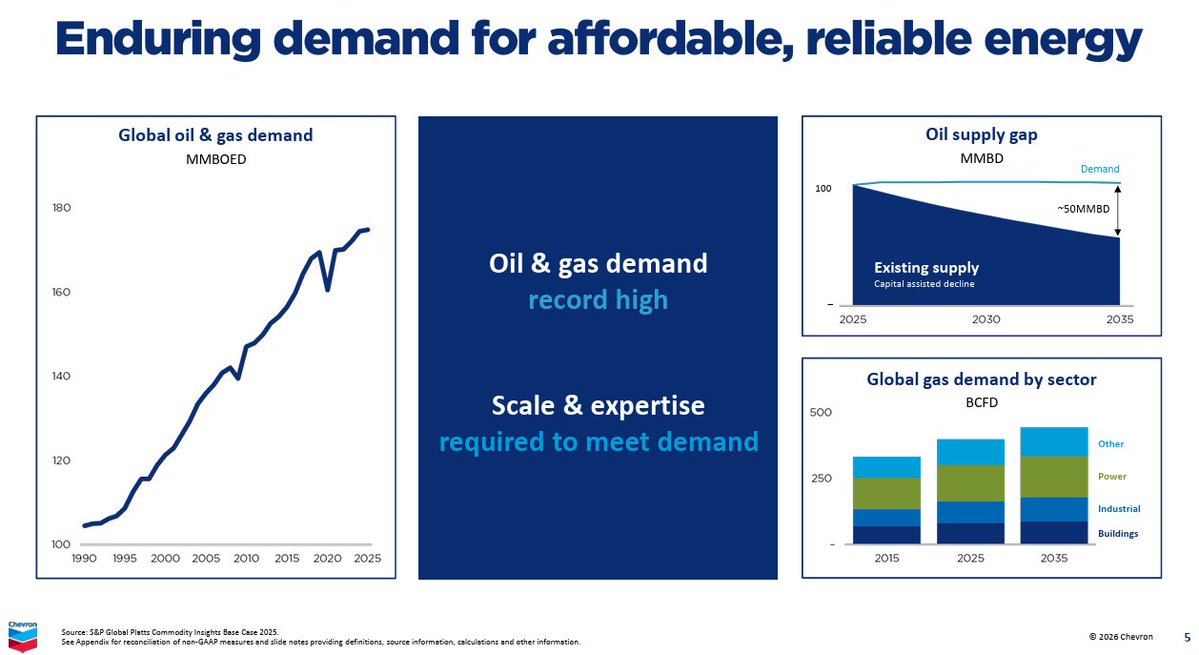
Chevron: global oil & gas demand, the oil supply gap and gas demand by sector | Demand at a record high; declining supply opens a ~50 MMBD gap by 2035
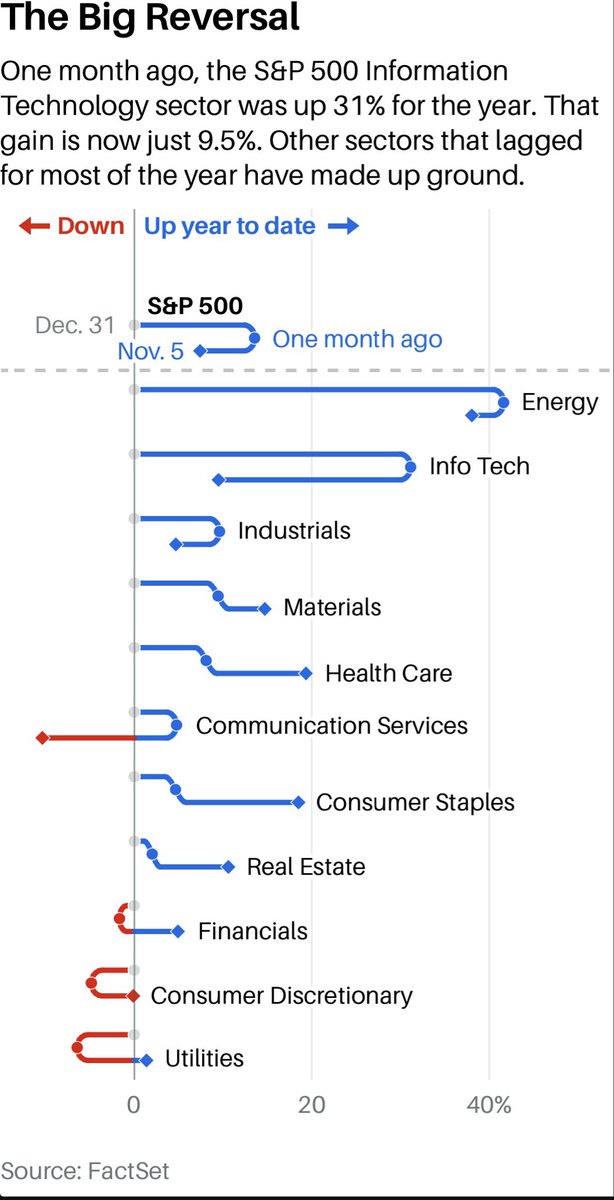
S&P 500 sector YTD returns, change over one month | Info Tech fell from +31% to +9.5% as lagging sectors like Energy caught up
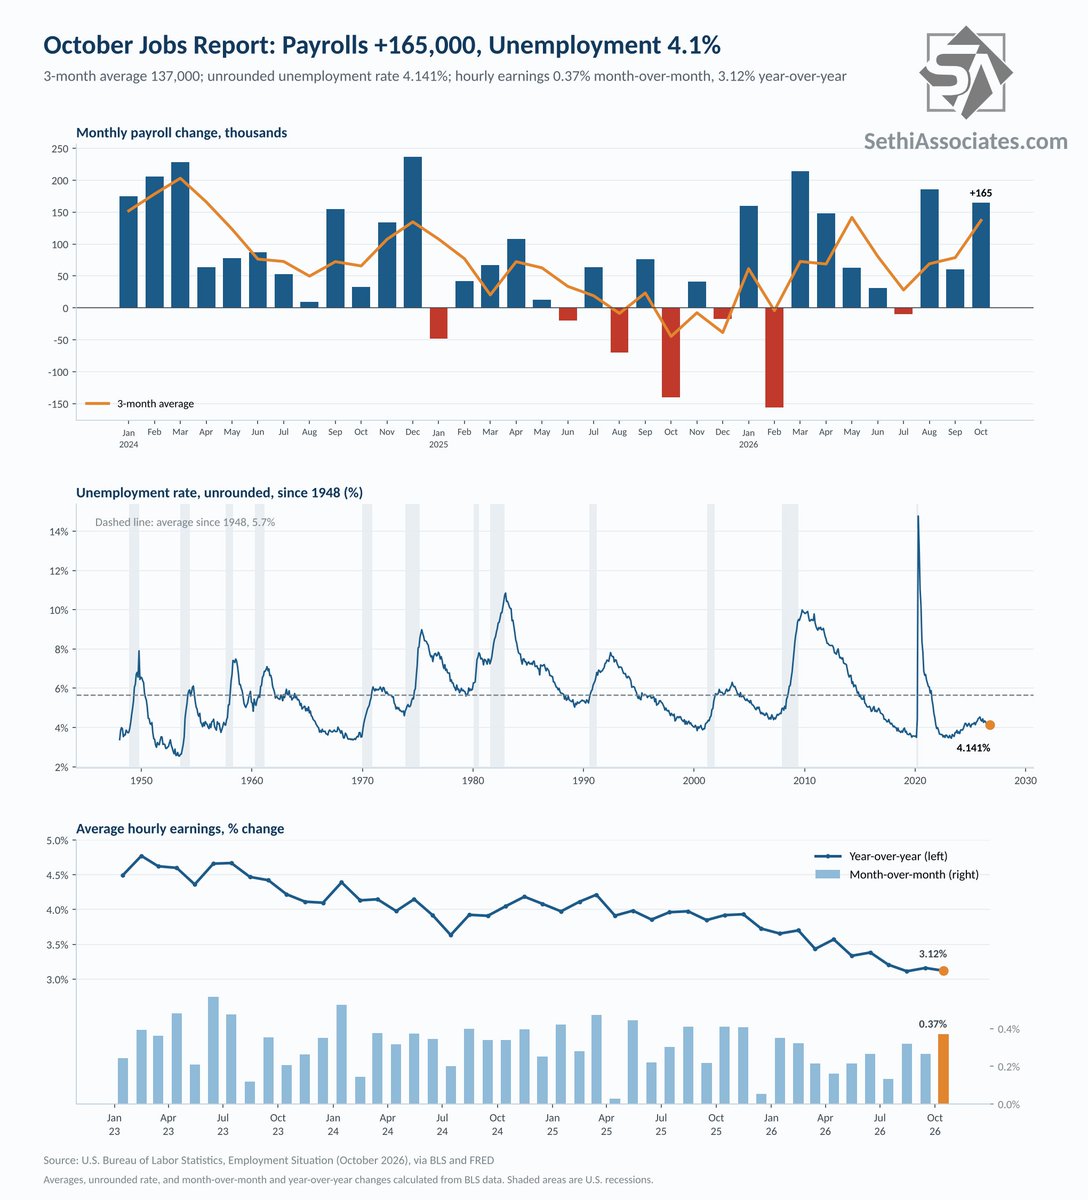
US jobs: monthly payrolls, unemployment rate and hourly earnings | October payrolls +165k, jobless rate 4.141%, and average hourly earnings up 3.12% y/y
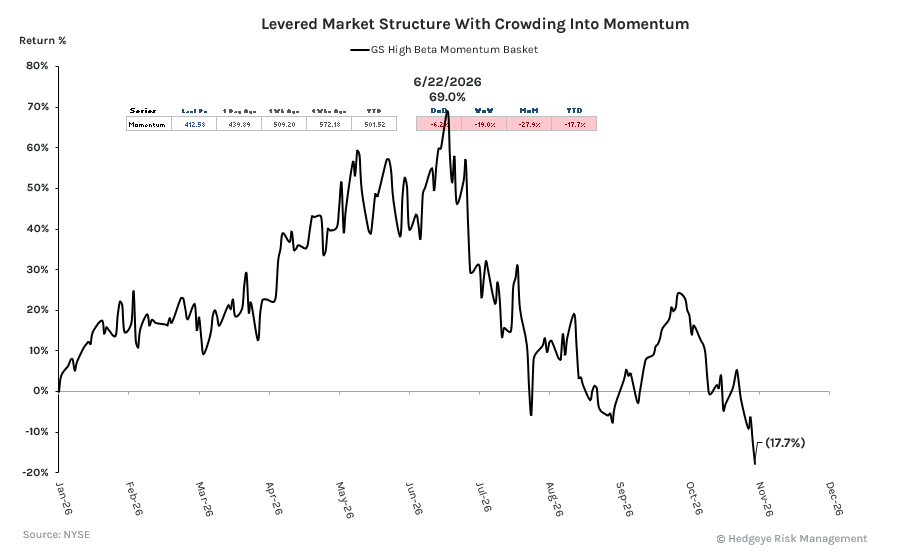
GS high-beta momentum basket return, 2026 | From a June 22 peak of +69% to -17.7% year to date
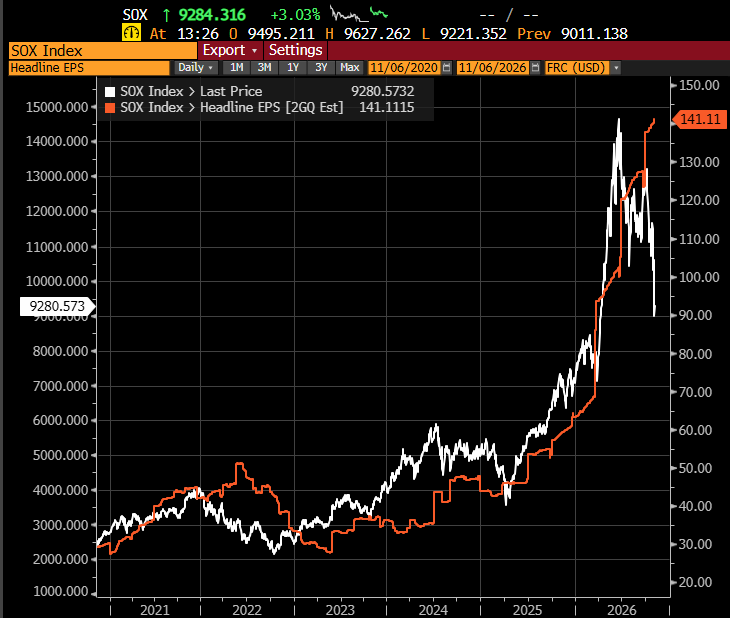
SOX index price vs forward EPS estimate, 2020-2026 | Price has fallen to ~9,281 while the earnings estimate climbs to a record ~141
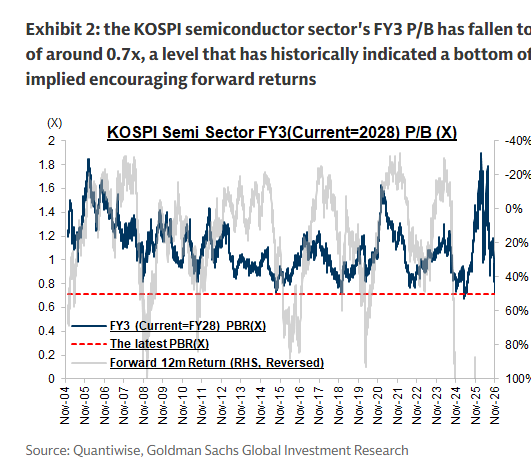
KOSPI semiconductor FY3 P/B vs forward 12-month return | Latest P/B ~0.7x, a historical trough that has mapped to stronger forward returns
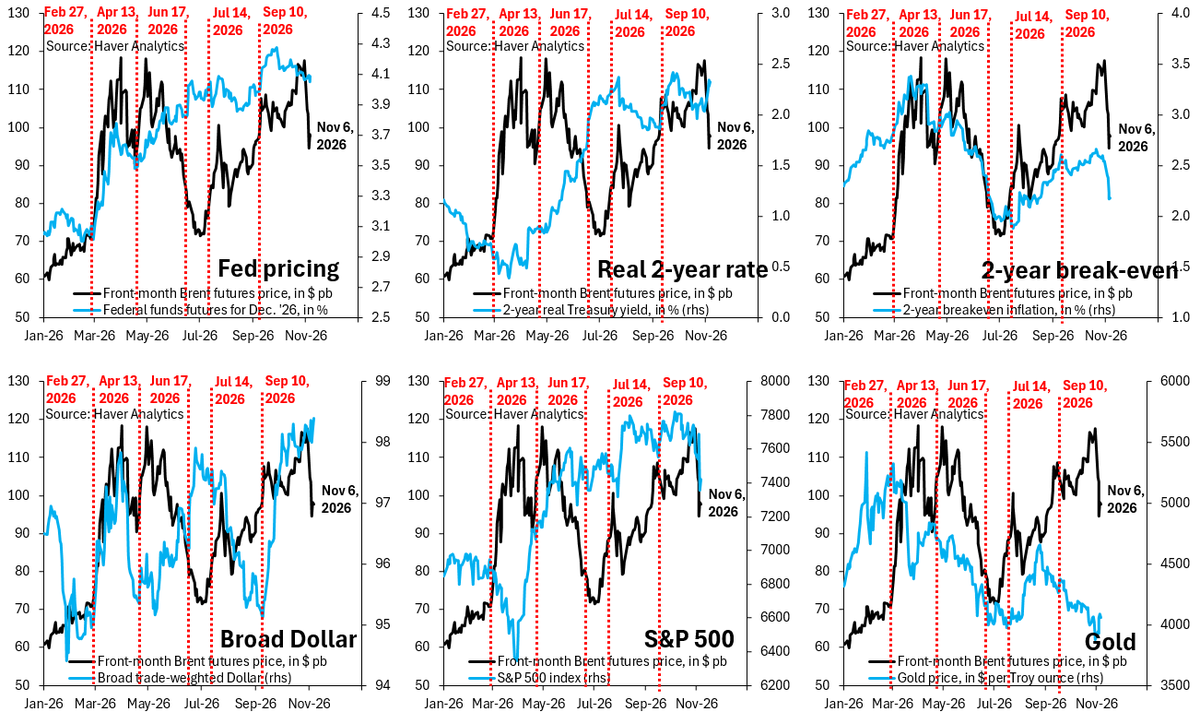
Front-month Brent futures against Fed pricing, 2y real rate, breakeven, the dollar, S&P 500 and gold, 2026 | As of Nov 6, oil tracks the dollar and stocks while diverging from gold
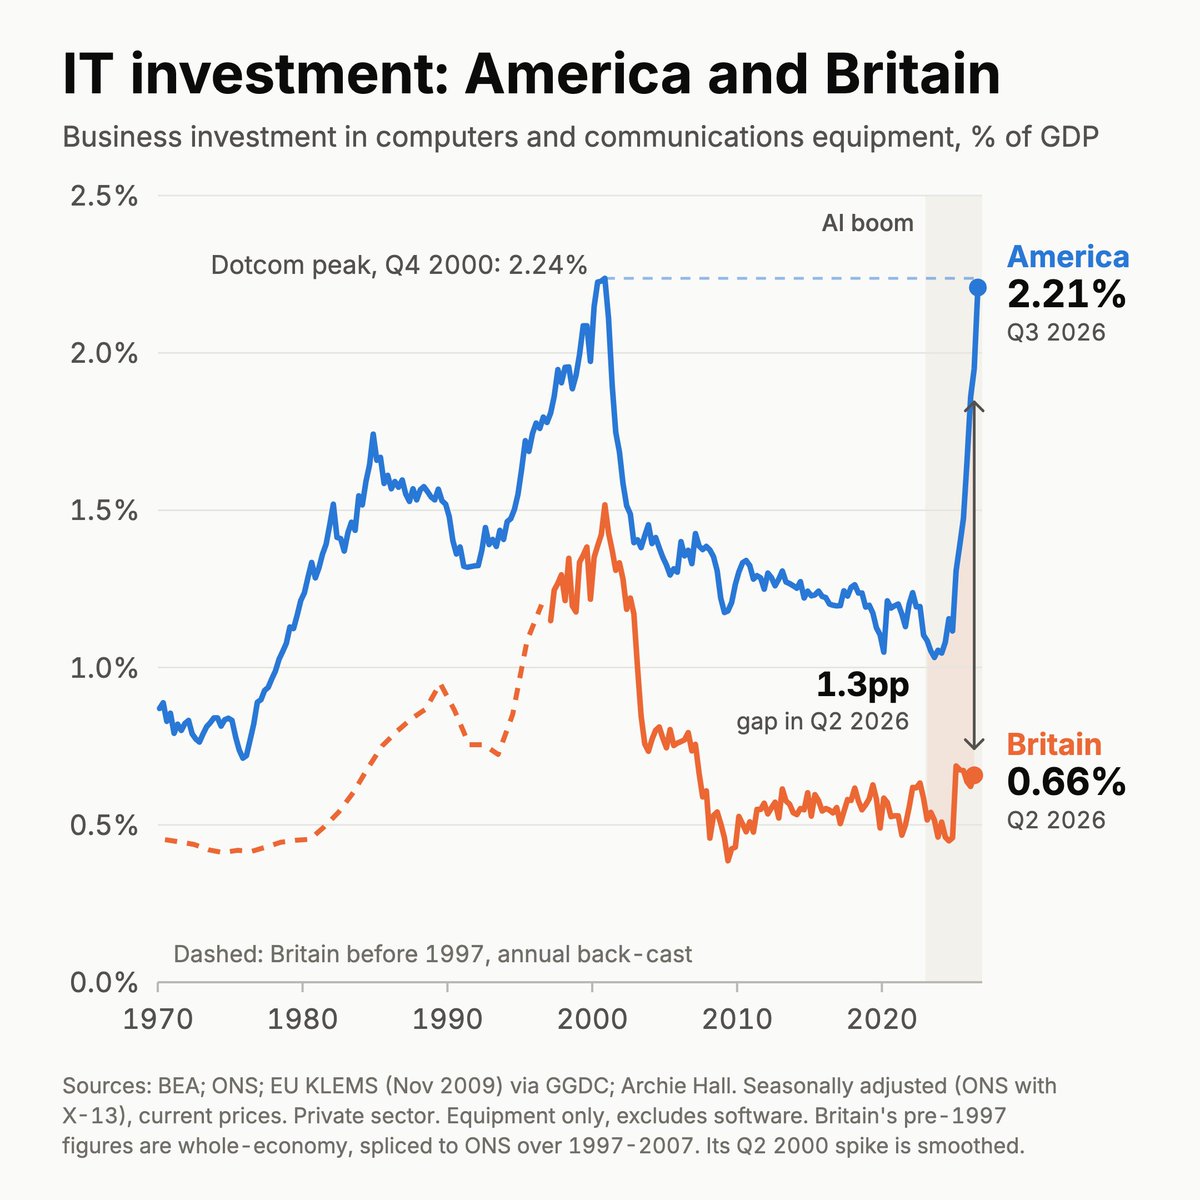
US vs UK business investment in computers & comms gear, % of GDP | US at 2.21%, near the 2000 dotcom peak and 1.3pp above the UK's 0.66%
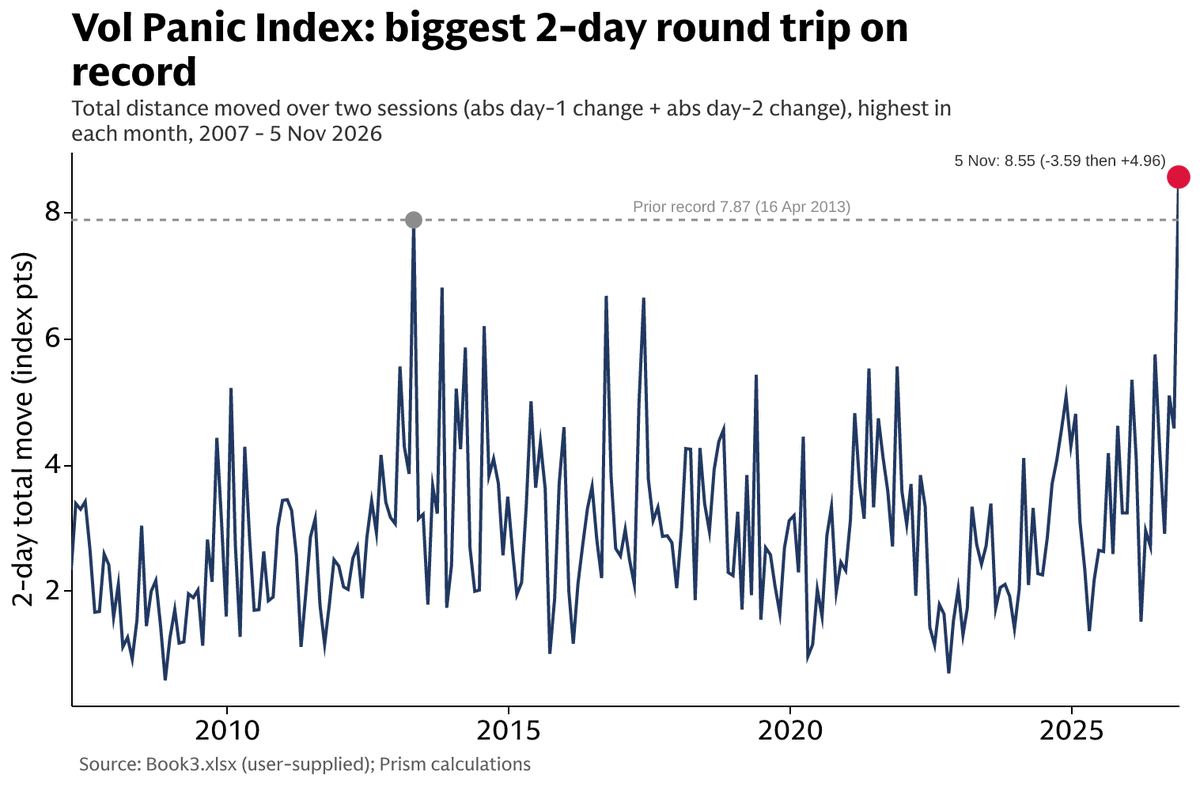
Largest two-day total move per month, index points, 2007-2026 | Nov 5 reached 8.55 (-3.59 then +4.96), topping the 2013 record of 7.87
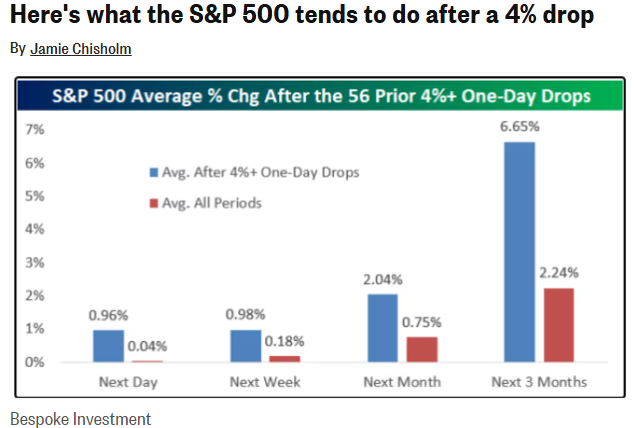
S&P 500 average change after 56 prior 4%+ one-day drops | +2.04% next month and +6.65% over three months, above all-period averages
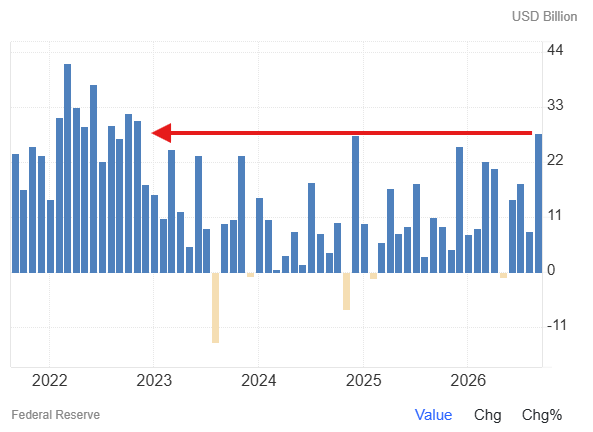
Monthly change in US consumer credit (USD billion) | September +$27.8B, the largest monthly gain since November 2022
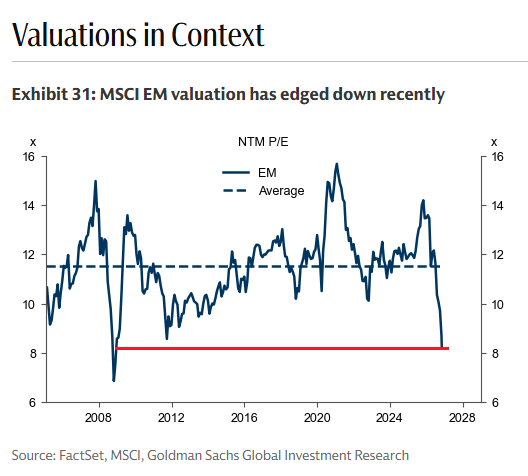
MSCI EM 12-month forward P/E, 2008-2026 | Down to roughly 8x, the lowest since 2009 and well below its long-run average
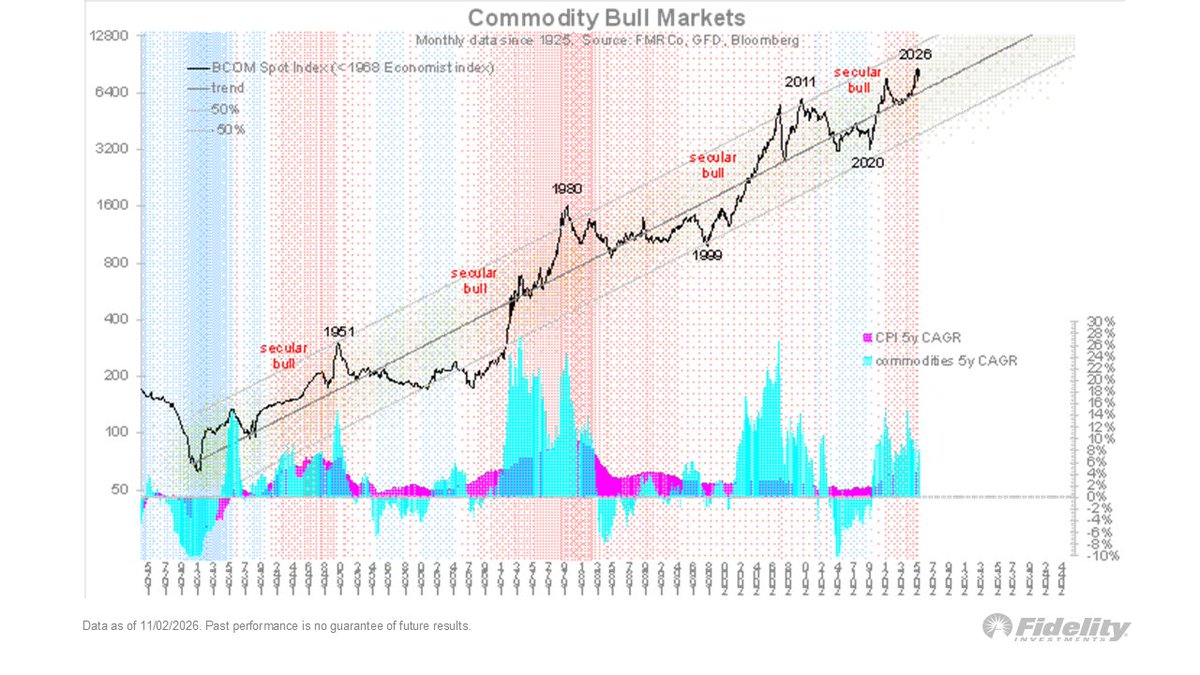
Bloomberg Commodity spot index, monthly since 1925, log scale | A new all-time high in October keeps the long-run uptrend intact
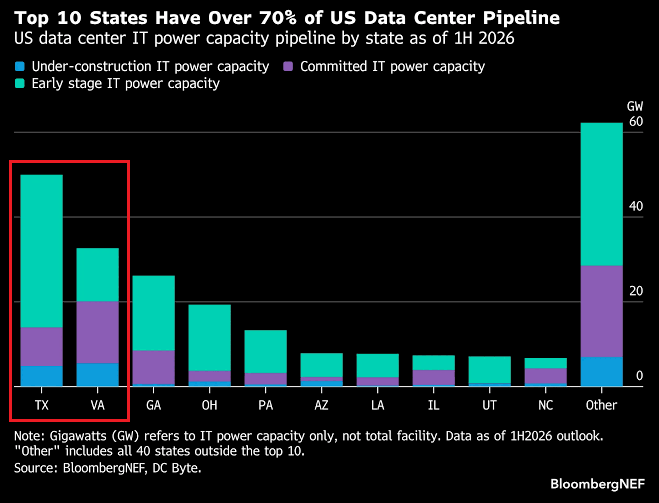
US data-center IT power capacity pipeline by state, 1H 2026 | Texas 47GW, Virginia 33GW and Georgia 26GW; the top 10 states exceed 70%
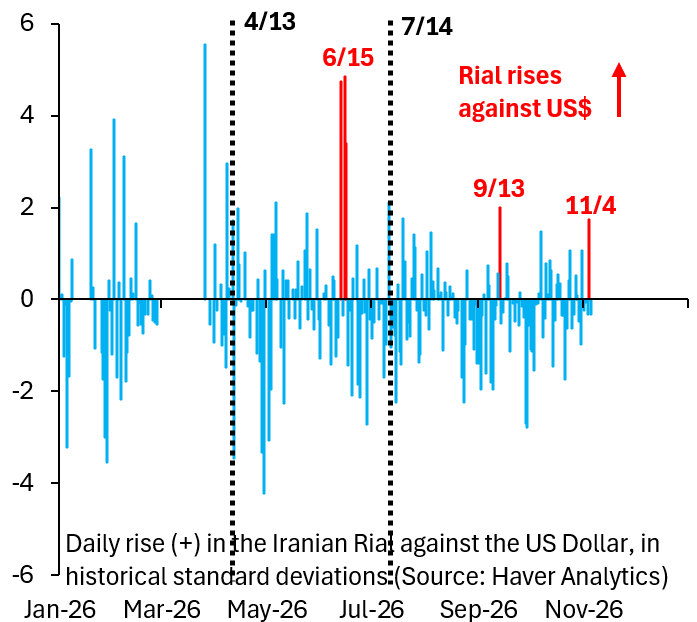
Daily rise in the Iranian rial vs USD, in historical standard deviations | A ~+5σ move on 6/15 and fresh positive spikes through 11/4
US nonfarm payroll net monthly change, seasonally adjusted | Latest +165k, with the 3-month moving average up to 137k
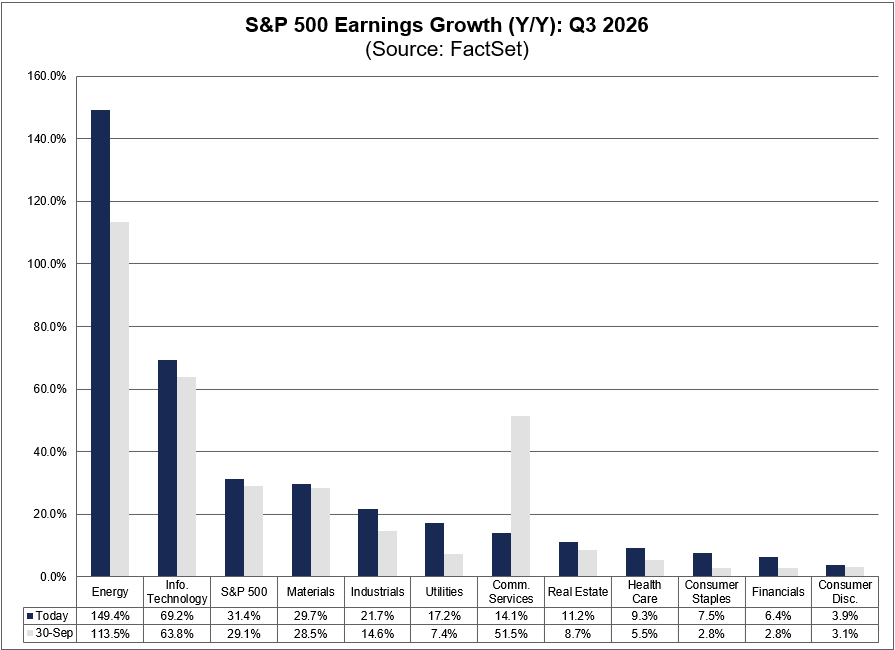
S&P 500 Y/Y earnings growth by sector, Q3 2026 | Blended +31.4% vs 29.1% on Sept 30, with Energy leading at +149%
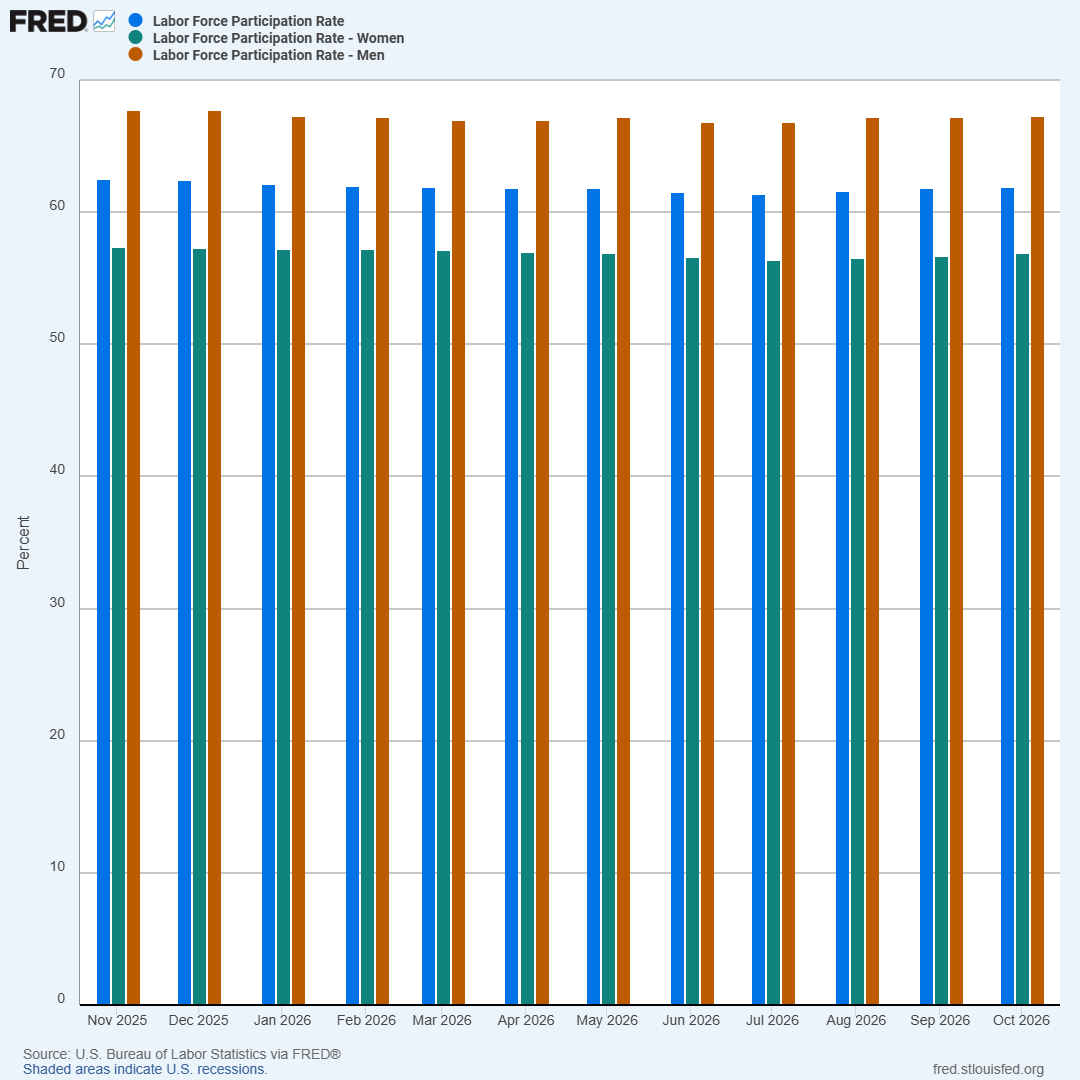
US labor force participation rate, overall vs men vs women | October up to 61.9%; men ~66.8% and women ~56.5%
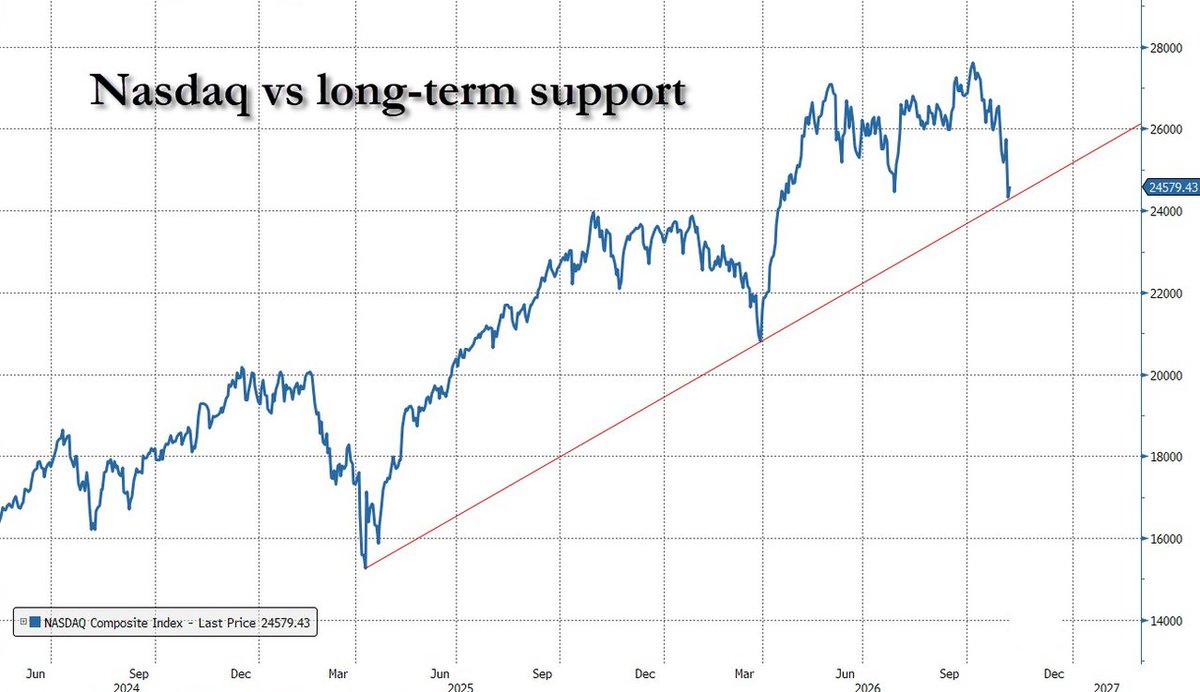
Nasdaq Composite index, 2024-2026 | Back to 24,579, approaching a multiyear rising support line
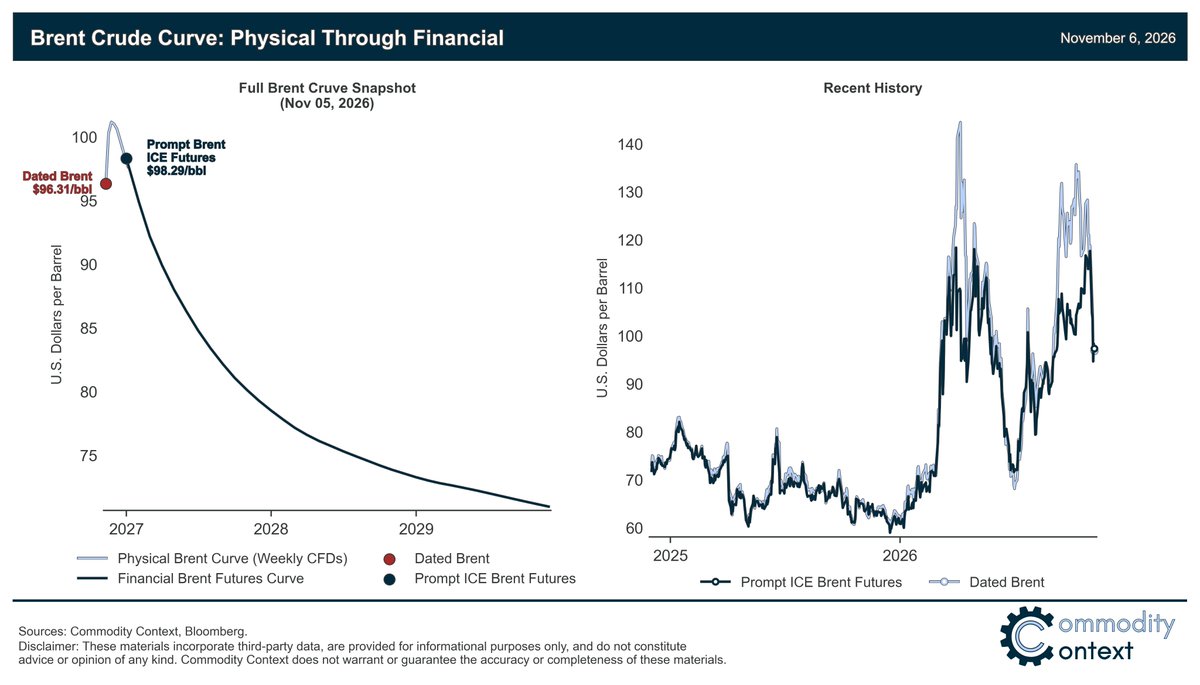
Brent physical vs financial curve, Nov 5 2026 | Dated Brent $96.31 now under prompt futures $98.29, front of curve in contango
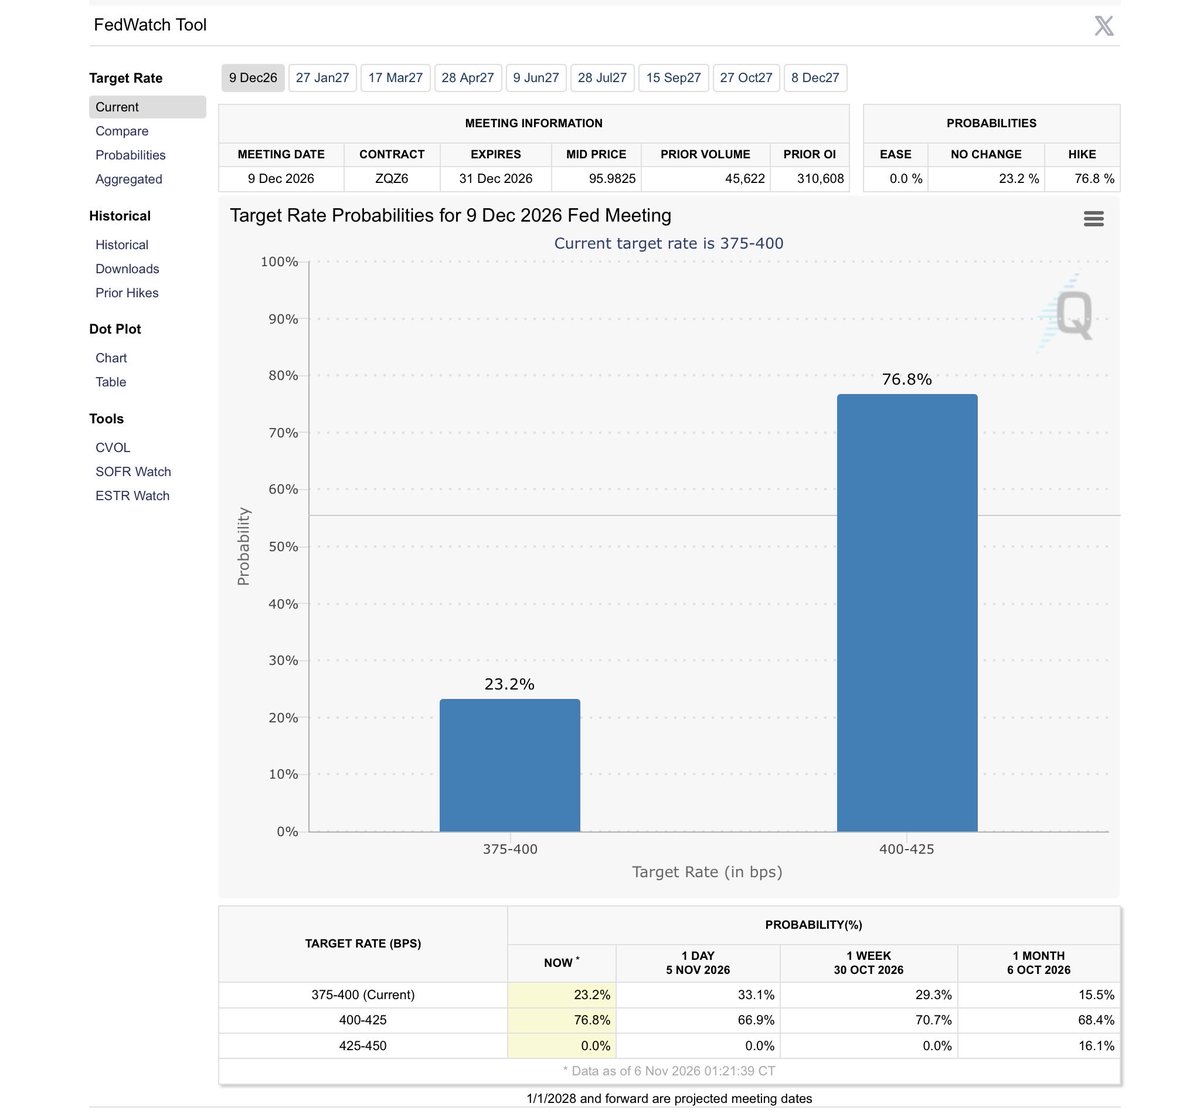
CME FedWatch probabilities for the Dec 9 FOMC | A hike to 400-425bp is priced at 76.8%, up from 66.9% a day earlier
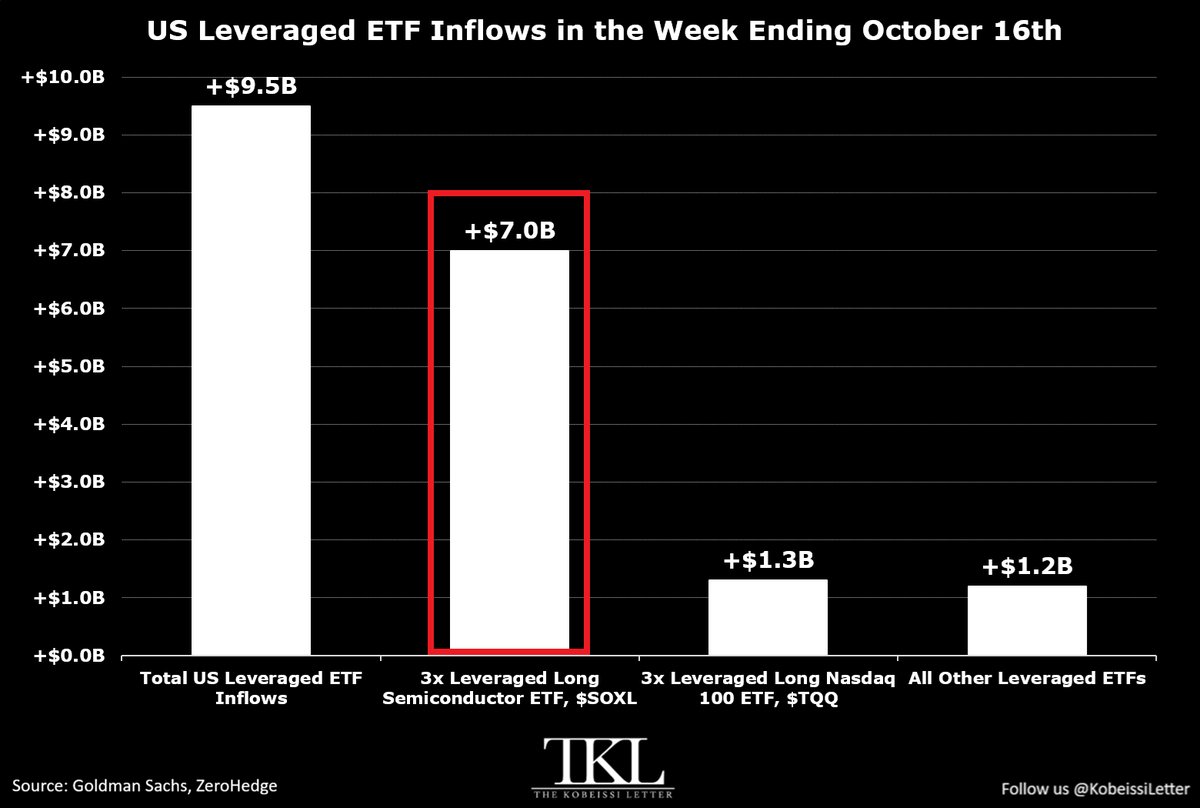
US leveraged ETF weekly inflows by fund | $9.5B total, with 3x semi SOXL +$7.0B vs TQQQ +$1.3B and others +$1.2B
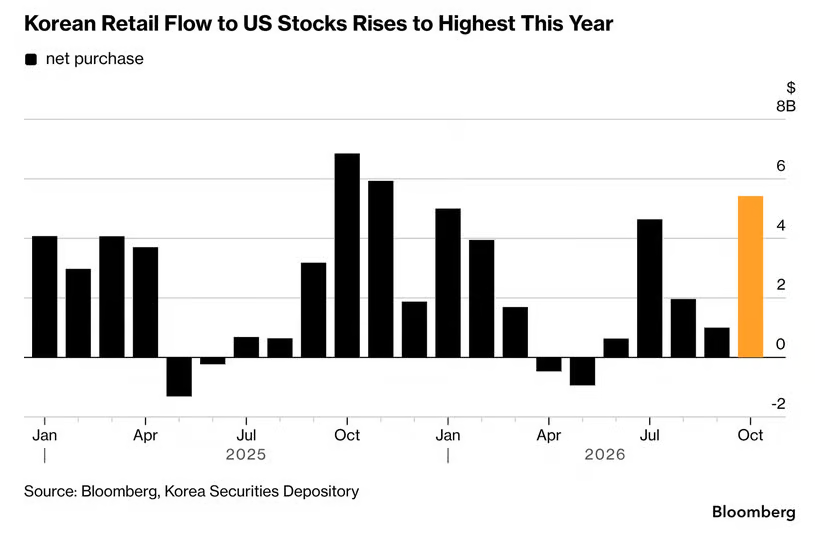
Korean retail monthly net purchases of US equities | October 2026 ~$5B, the largest month of 2026
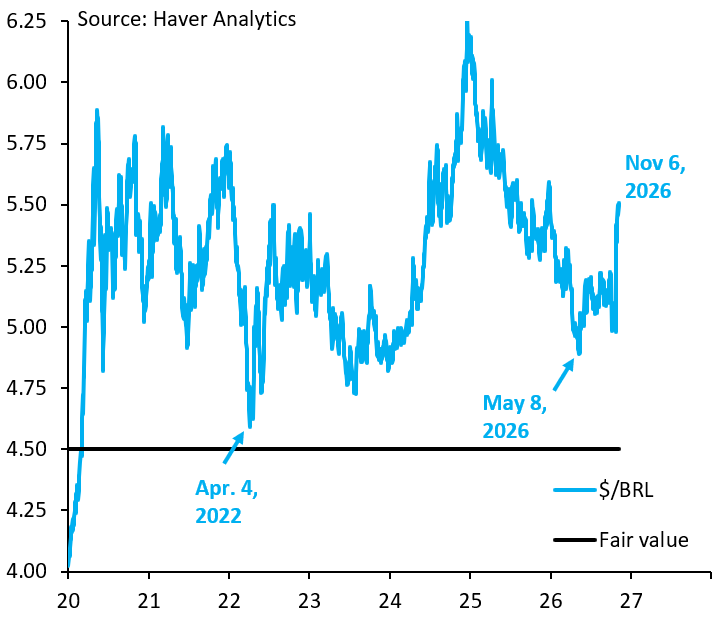
USD/BRL exchange rate, 2020-2026 | ~5.50 on 2026-11-06, about one real above the 4.50 fair-value line
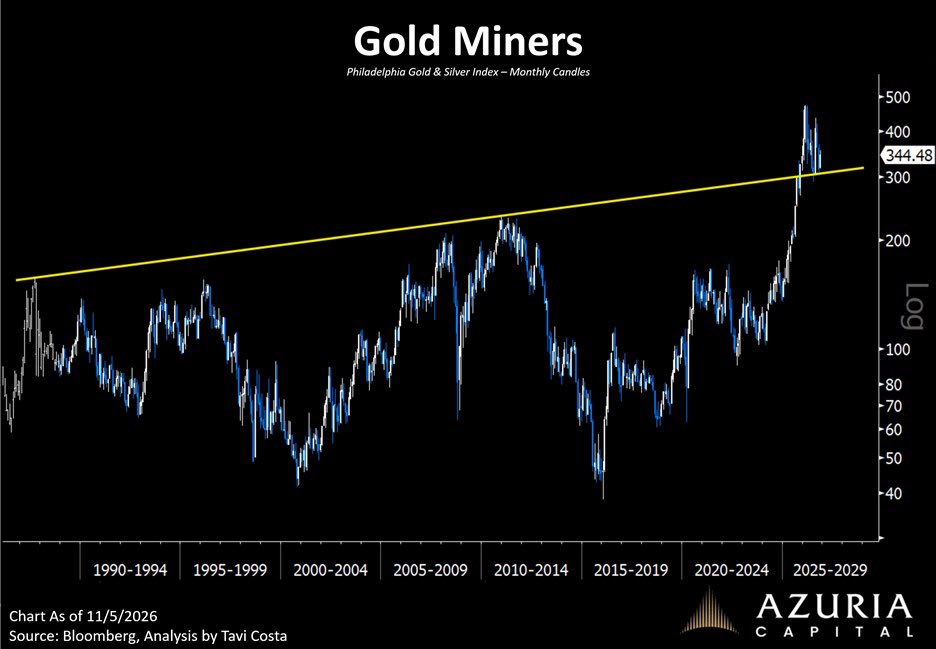
Philadelphia Gold & Silver (XAU) index, monthly candles, log scale | Now 344, breaking above a trendline spanning three-plus decades
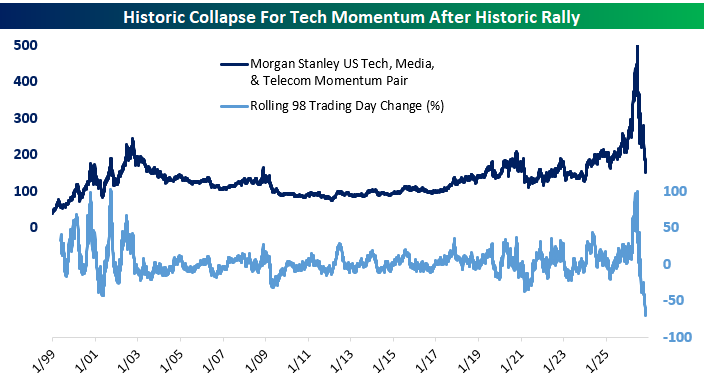
Morgan Stanley US TMT momentum pair vs rolling 98-day change | Index spiked near 500 then fell; the 98-day change swung from +100% to ~-70%
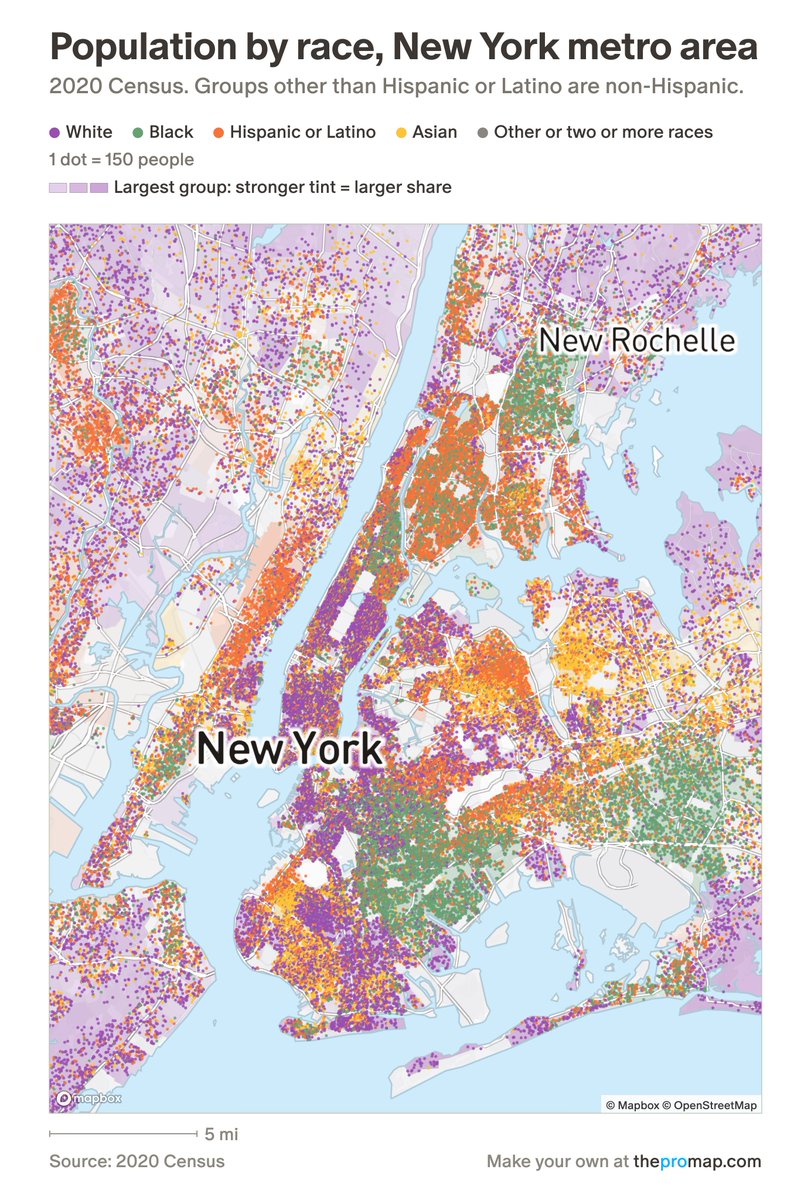
NYC metro population by race, 2020 Census | One dot = 150 people; White, Hispanic, Black and Asian residents cluster into distinct areas
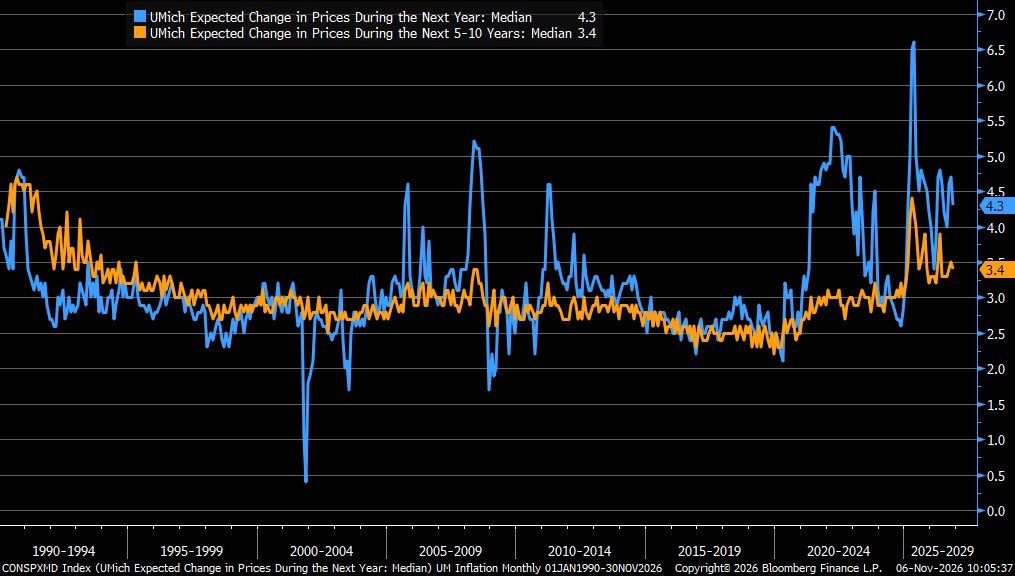
UMich median inflation expectations, 1-year vs 5-10 year, 1990-2026 | Near-term 4.3% and long-run 3.4%, both elevated vs the 2010s
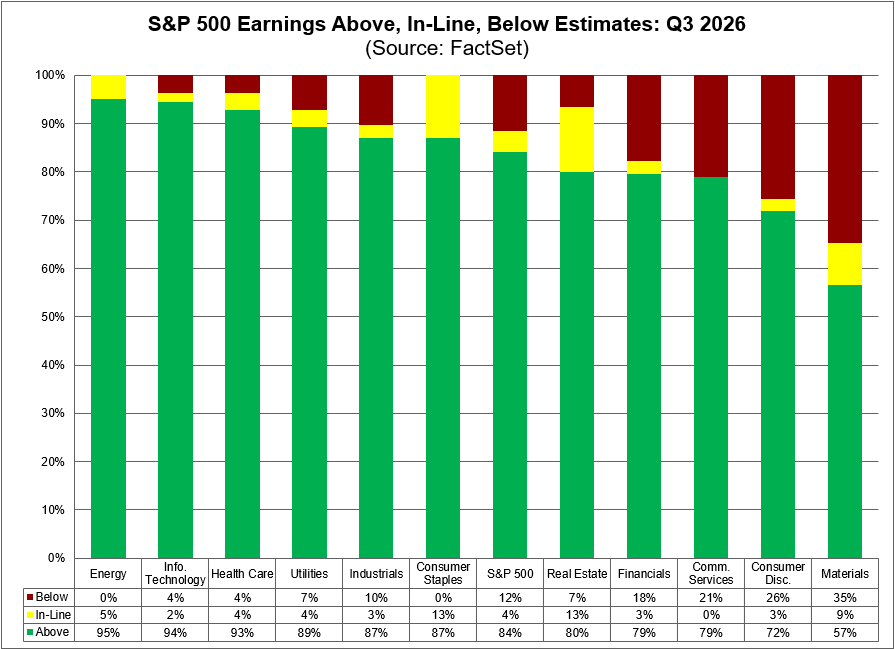
Share of S&P 500 companies above/in-line/below EPS estimates, Q3 2026 | 84% beat overall; Energy 95% and Info Tech 94% lead, Materials 57%
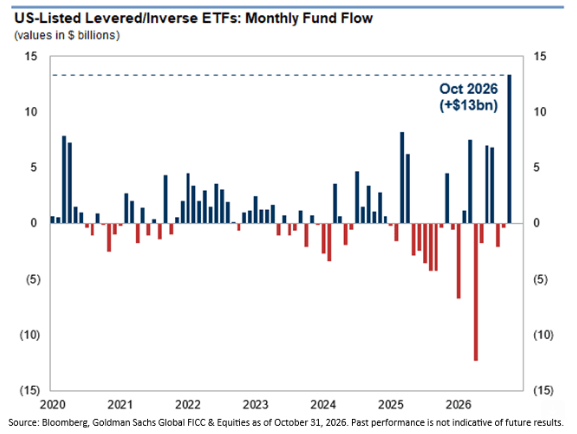
Monthly fund flows into US-listed levered/inverse ETFs | October 2026 saw +$13bn, the largest monthly inflow on record
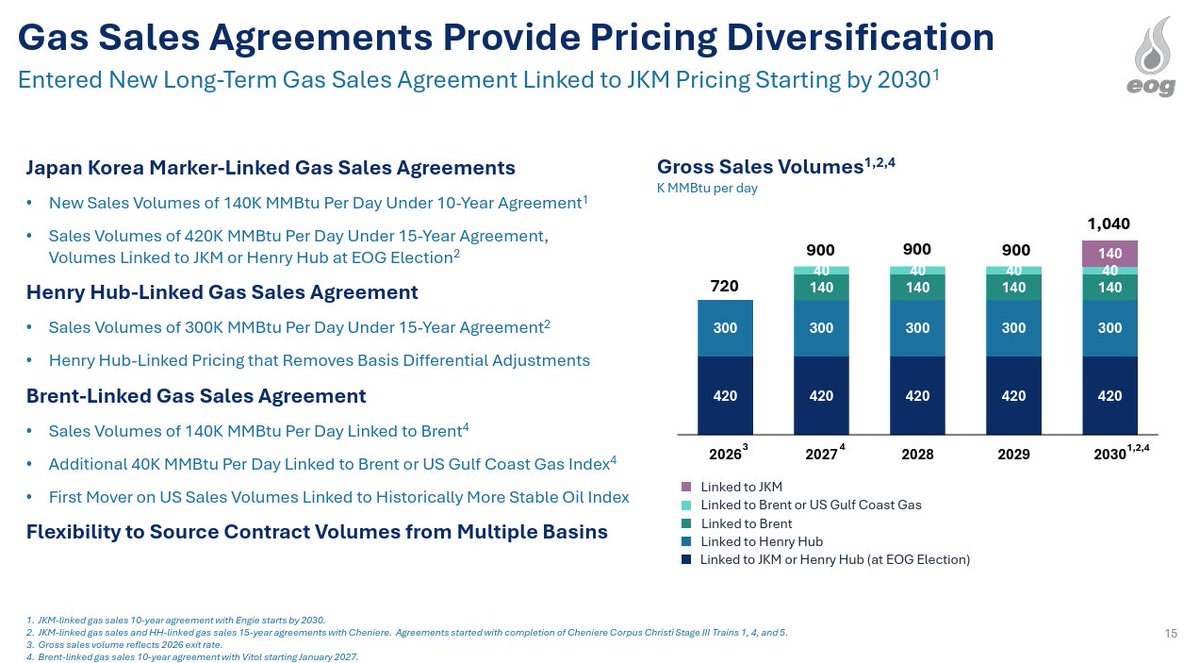
EOG gross gas sales volumes and pricing mix (K MMBtu/day) | From 720 in 2026 to 1,040 by 2030, adding JKM- and Brent-linked contracts
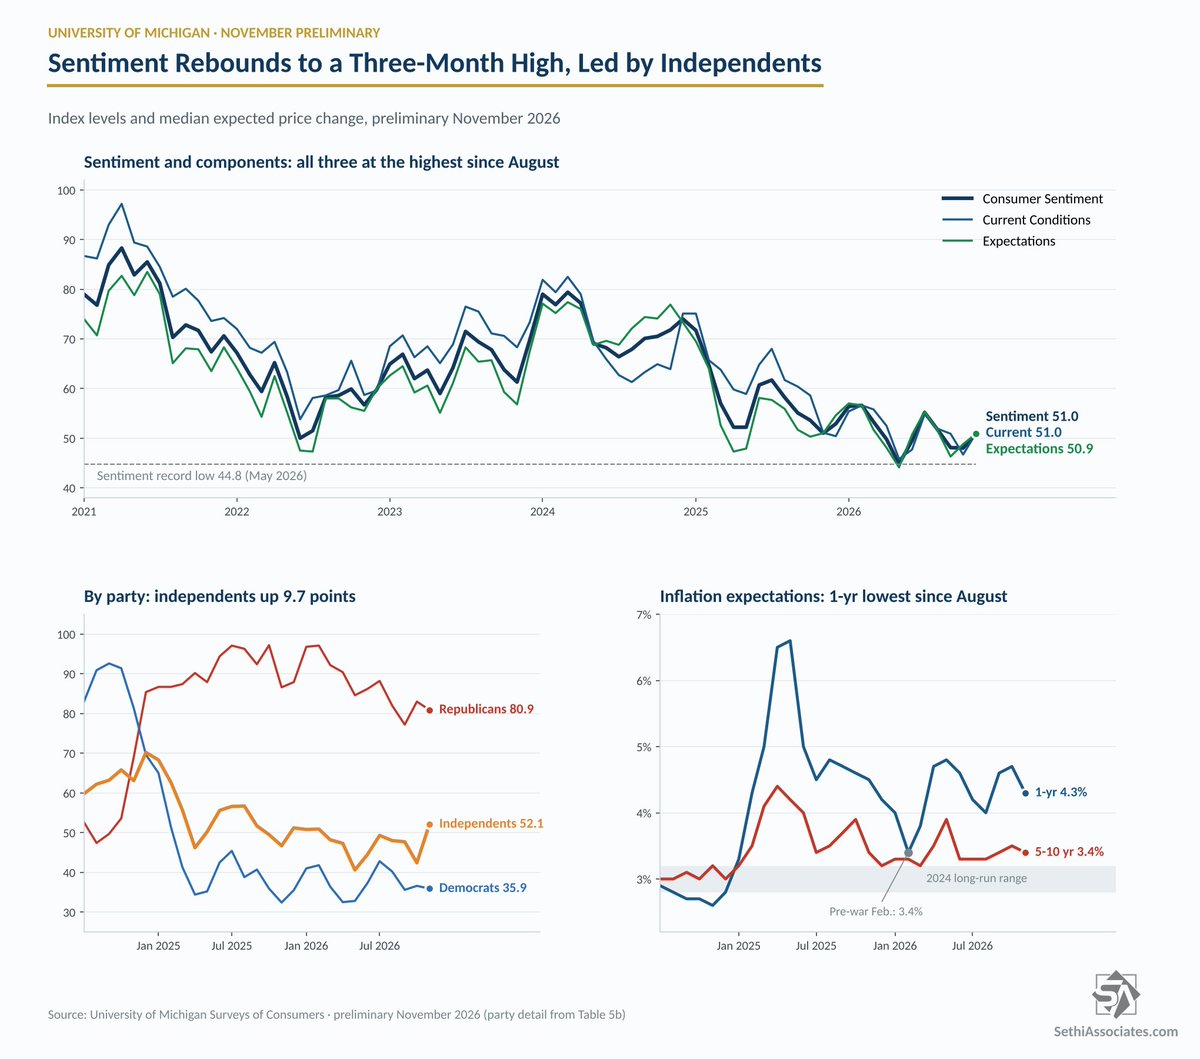
University of Michigan sentiment overall and by party | Headline 51.0, with Republicans at 80.9 far above Democrats at 35.9 and Independents rebounding to 52.1
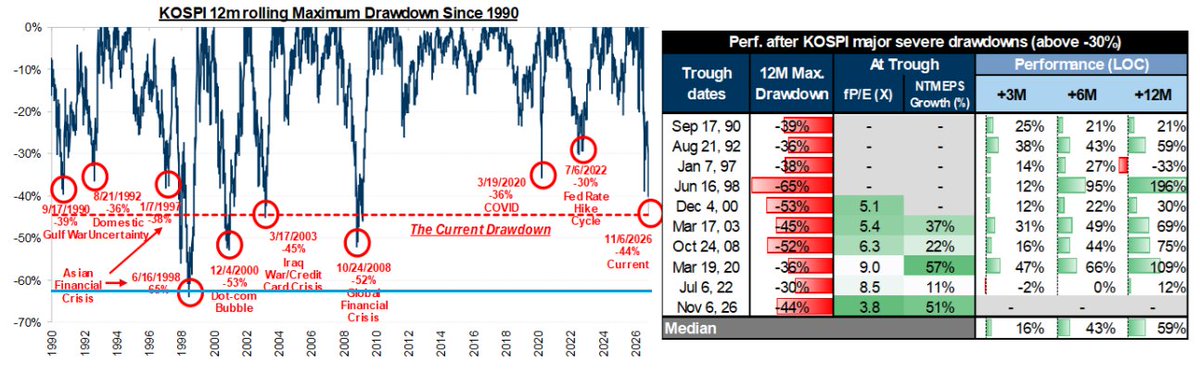
KOSPI 12-month rolling maximum drawdown since 1990 | The current 44% drawdown is approaching the 52-53% lows seen in the GFC and dot-com busts
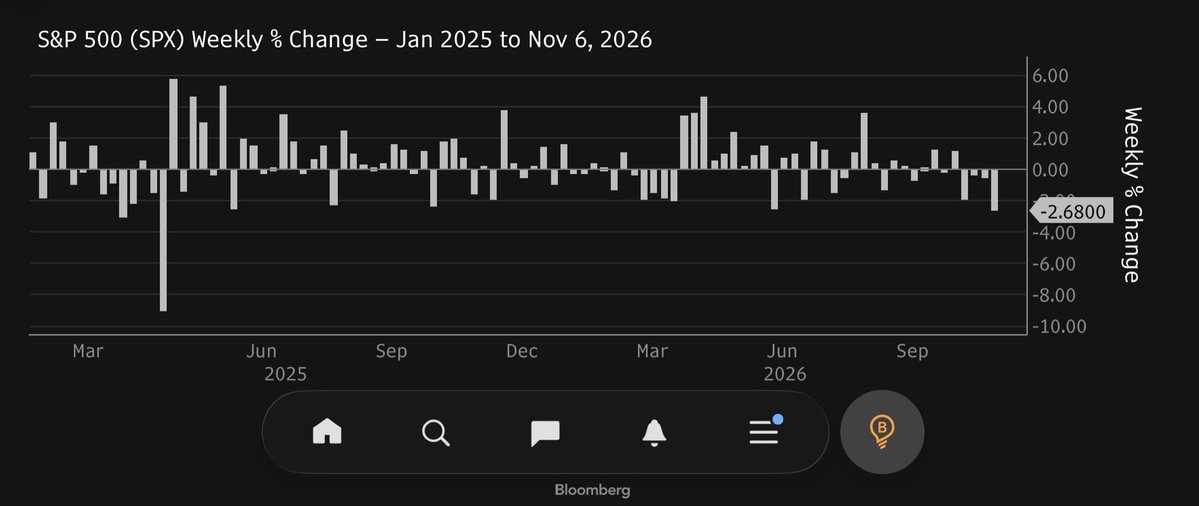
S&P 500 weekly % change, 2025 to date | Latest week -2.68%, the biggest weekly drop since April 2025
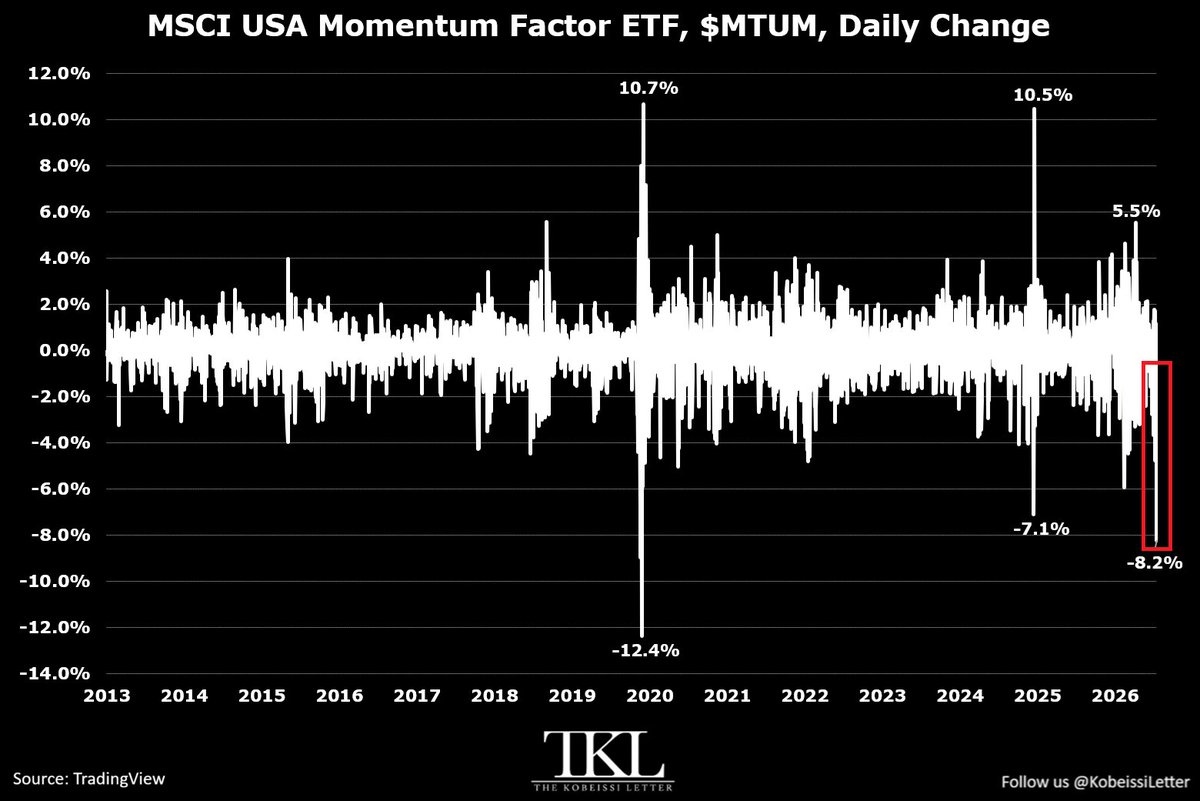
MTUM daily change since 2013 | Latest -8.2%, its third-largest drop on record after -12.4% in 2020
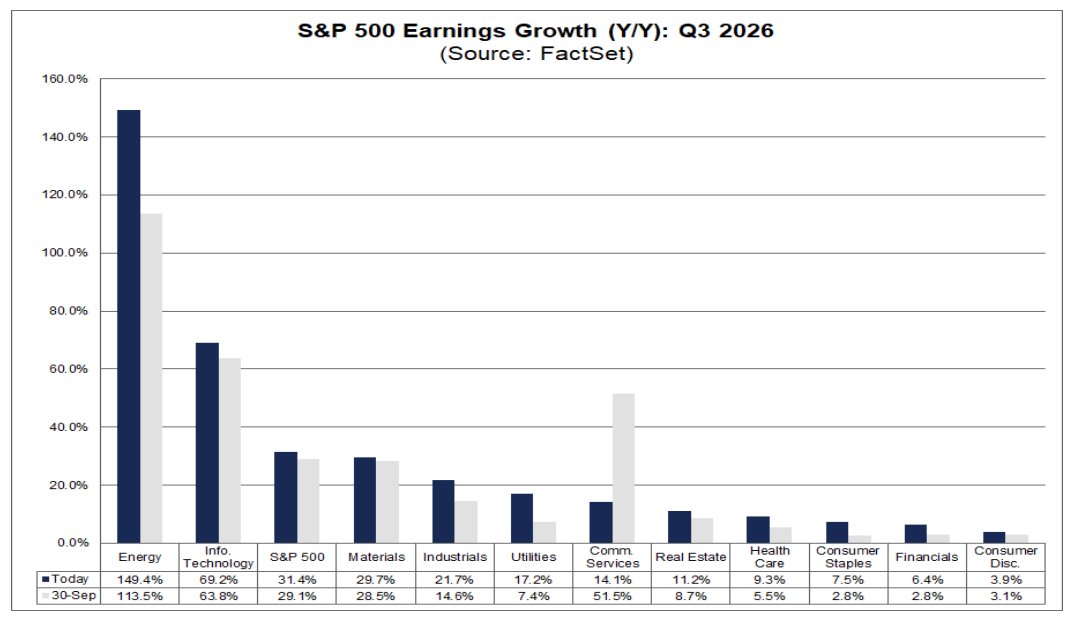
S&P 500 Y/Y earnings growth by sector, Q3 2026 | Index-wide 31.4%, led by Energy at 149.4% with Consumer Discretionary lowest at 3.9%
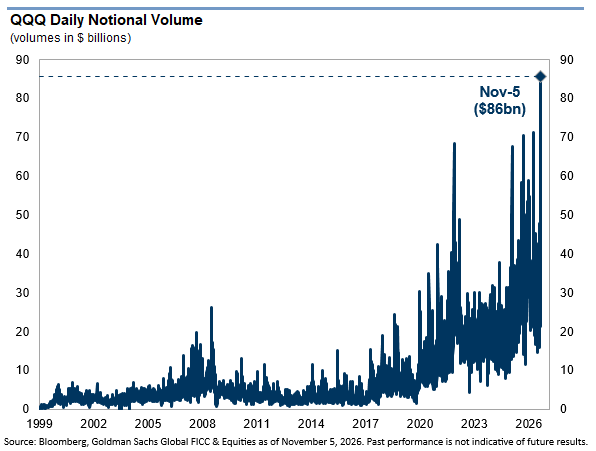
QQQ daily notional volume ($ billions), 1999-2026 | Nov 5 reached $86bn, an all-time high
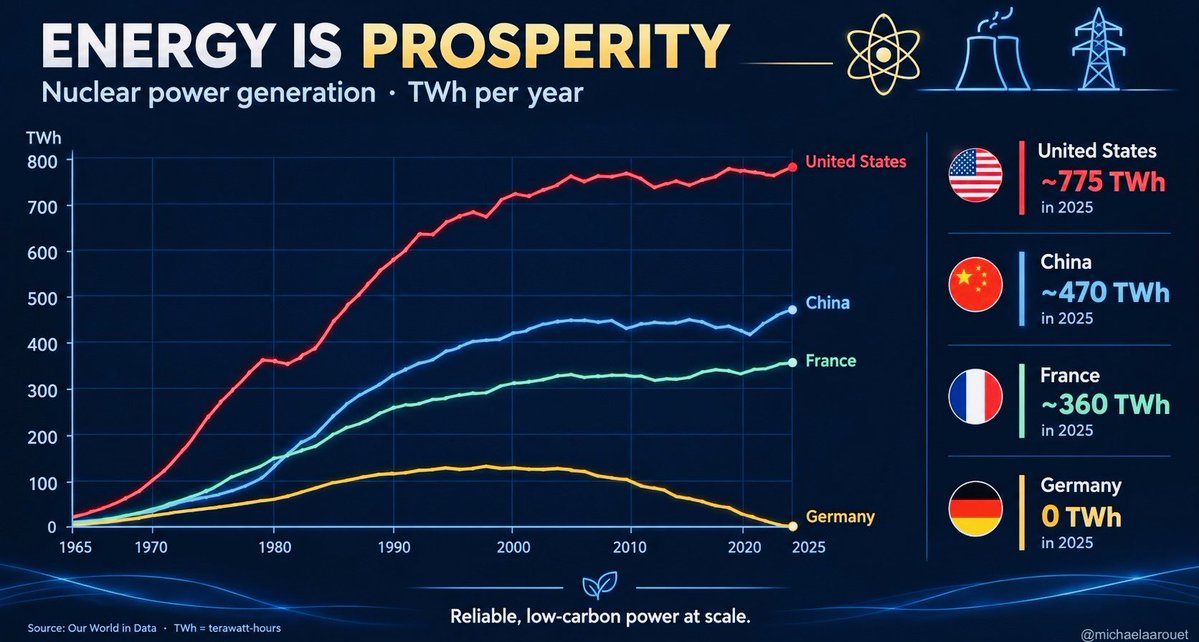
Nuclear power generation by country (TWh per year), 1965-2025 | US ~775, China ~470, France ~360, Germany down to 0 in 2025
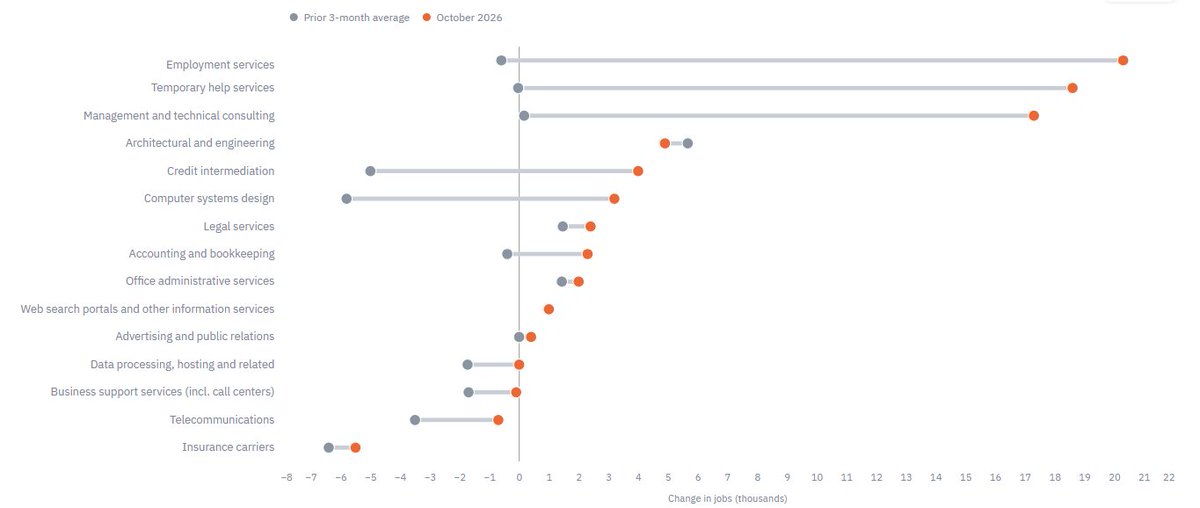
Job change by professional & business services subsector | Employment services added 20k+ in October, far above its prior 3-month average
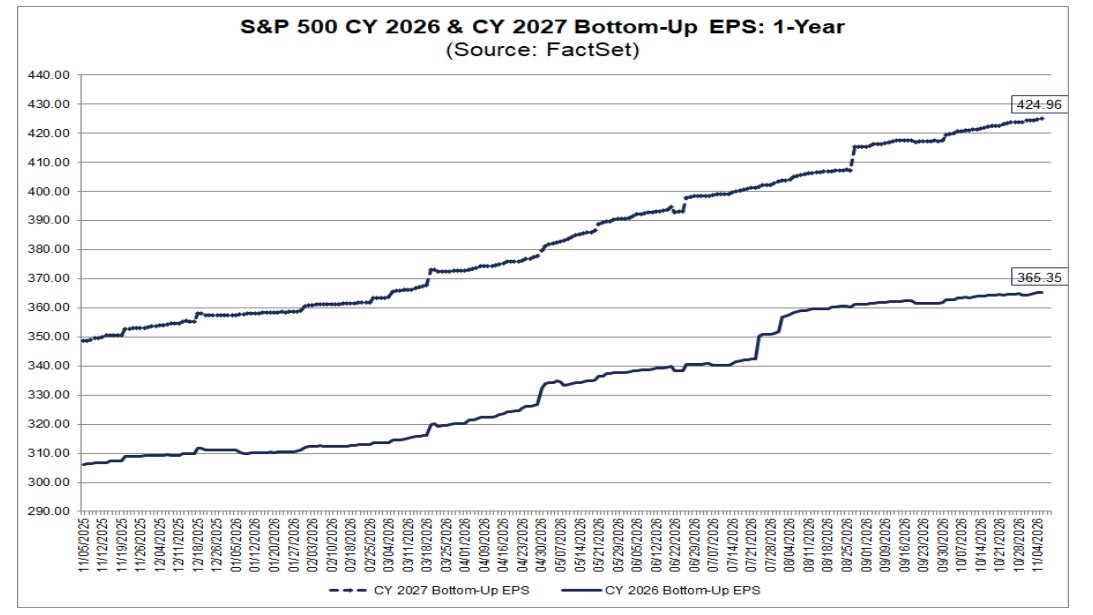
S&P 500 CY2026 and CY2027 bottom-up EPS, past year | 2027 at 424.96 and 2026 at 365.35, both revised steadily higher
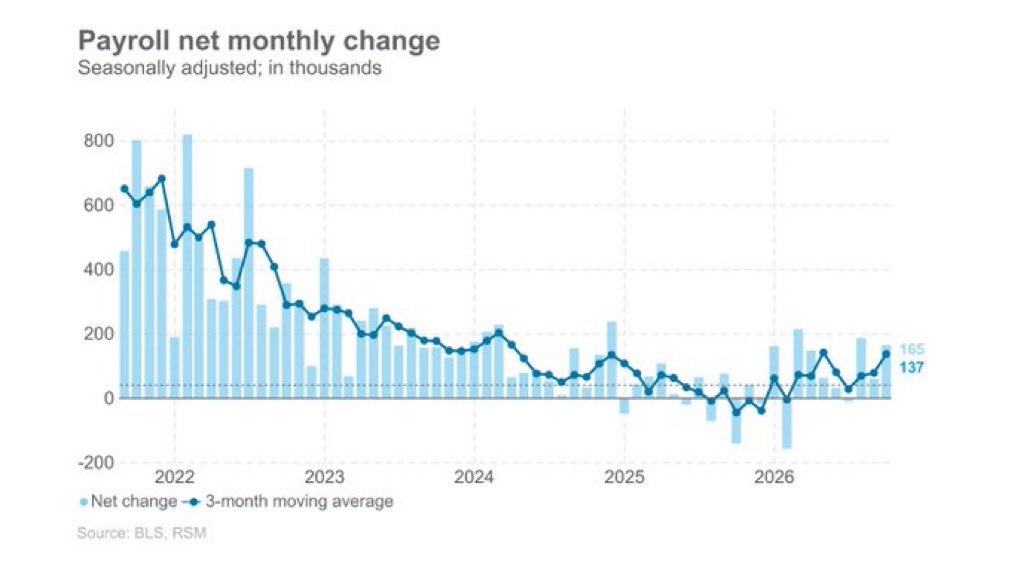
US nonfarm payroll net monthly change, seasonally adjusted | Latest +165k, with the 3-month moving average up to 137k
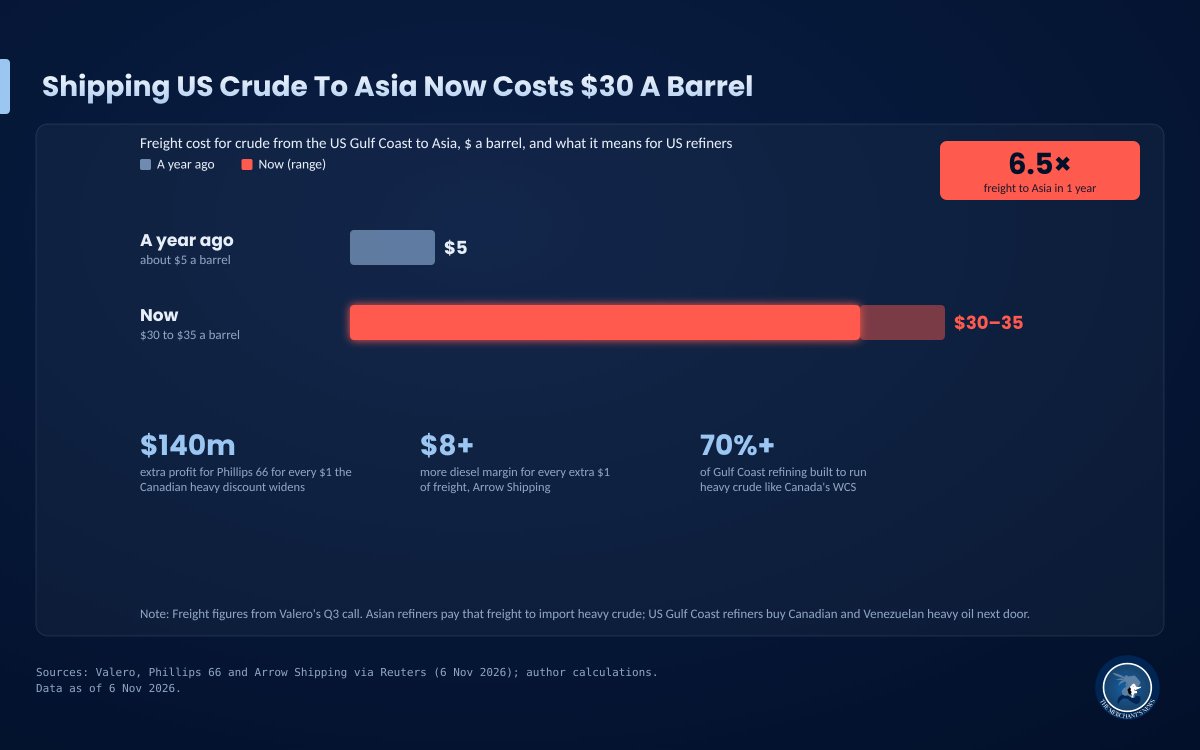
Freight cost for US Gulf Coast crude to Asia ($/bbl) | From ~$5 a year ago to $30-35 now, a 6.5x jump favoring US refiners
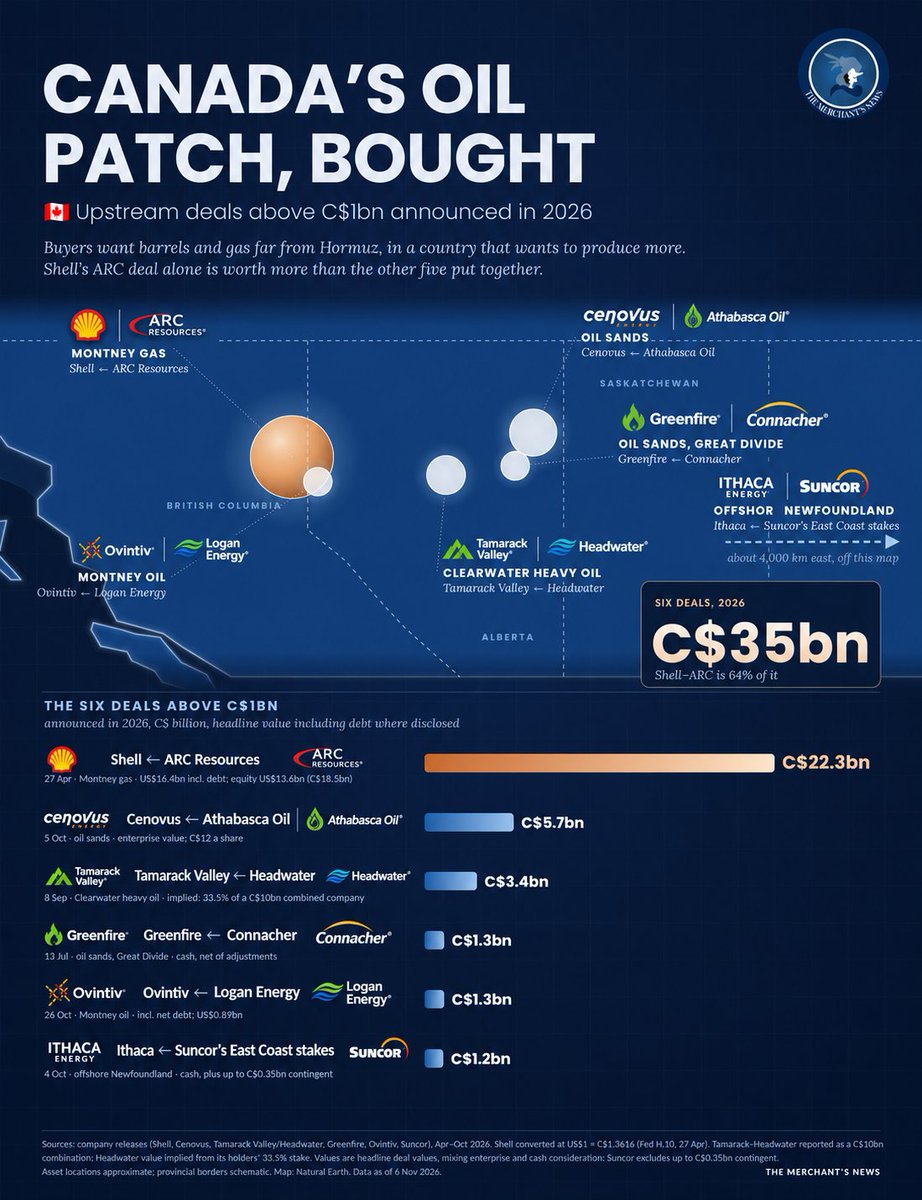
Canadian upstream oil & gas deals above C$1bn in 2026 | Six deals total C$35bn, led by Shell-ARC at C$22.3bn (64% of the total)
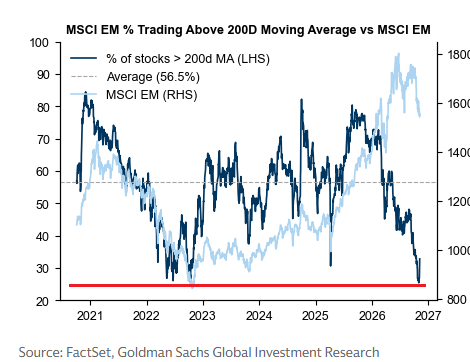
% of MSCI EM constituents trading above their 200-day moving average | Now ~25%, the lowest since March 2020 and well below the 56.5% average
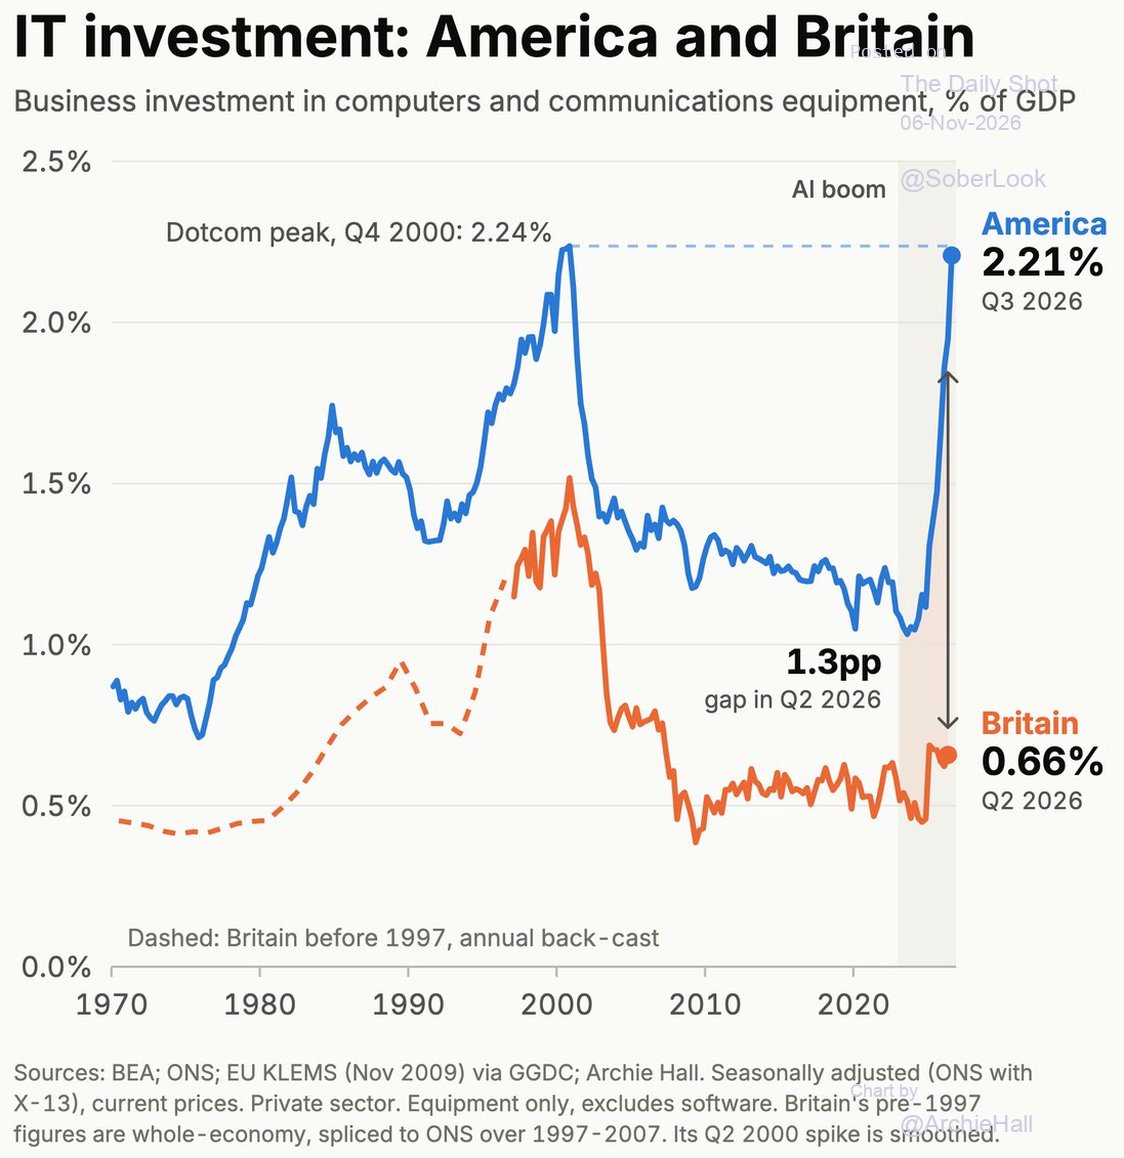
US vs UK business investment in computers & comms gear, % of GDP | US at 2.21%, near the 2000 dotcom peak and 1.3pp above the UK's 0.66%
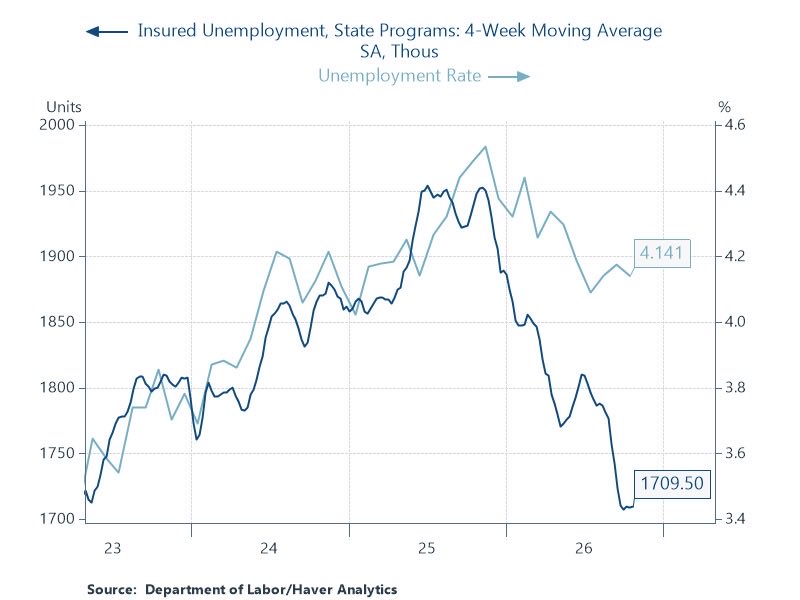
Insured unemployment (state, 4-wk avg) vs unemployment rate | Claims down to 1,709.5k while the jobless rate holds at 4.14%, diverging
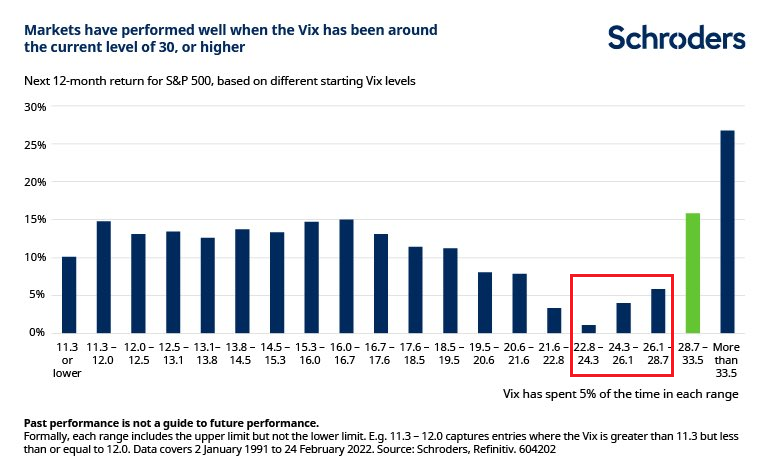
Next-12-month S&P 500 return by starting VIX level, 1991-2022 | The VIX 22.8-28.7 buckets show the lowest forward returns at ~1-5%, versus ~27% when the VIX is above 33.5
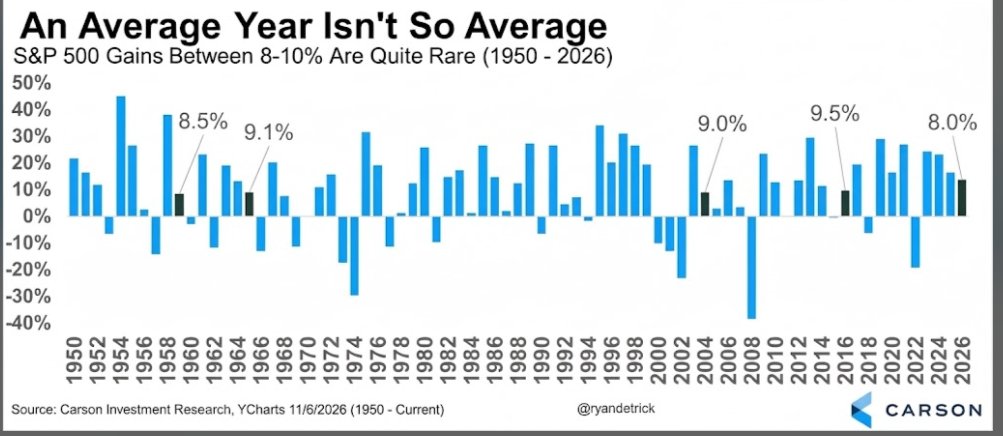
S&P 500 calendar-year returns, 1950-2026 | Only 4 years landed in the 8-10% band; 2026 is up 8.0% year to date
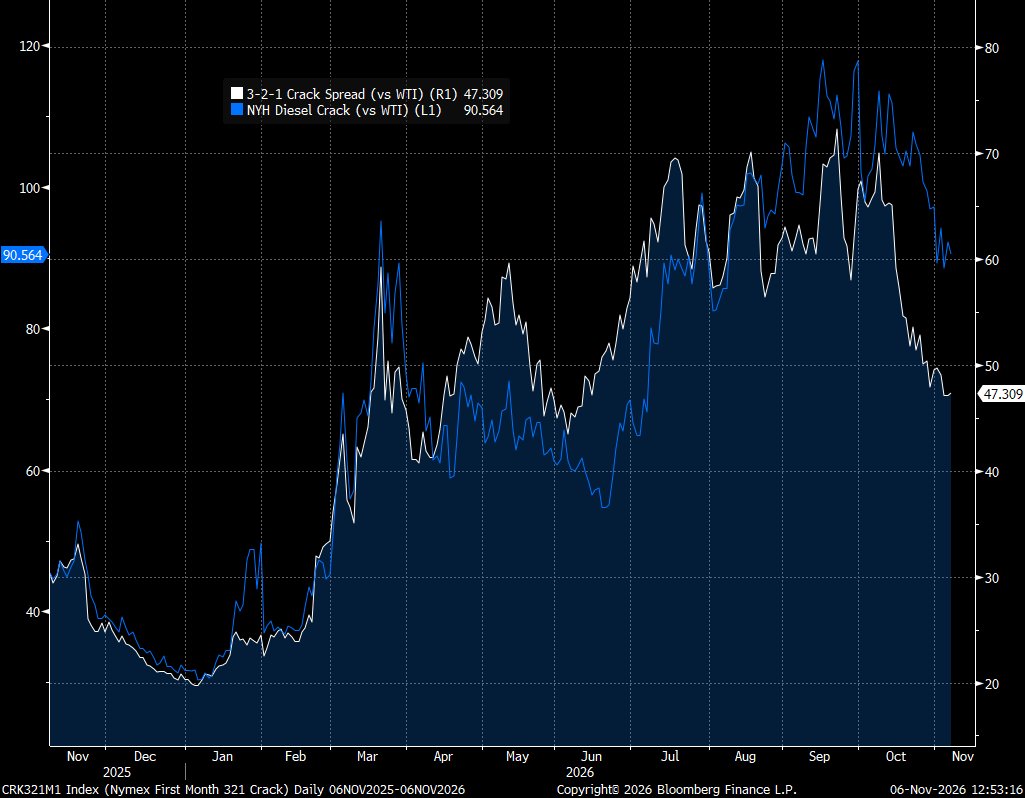
NYH diesel crack vs 3-2-1 crack spread (vs WTI, $/bbl) | Diesel crack $90.56 and 3-2-1 at $47.31, both easing from September highs