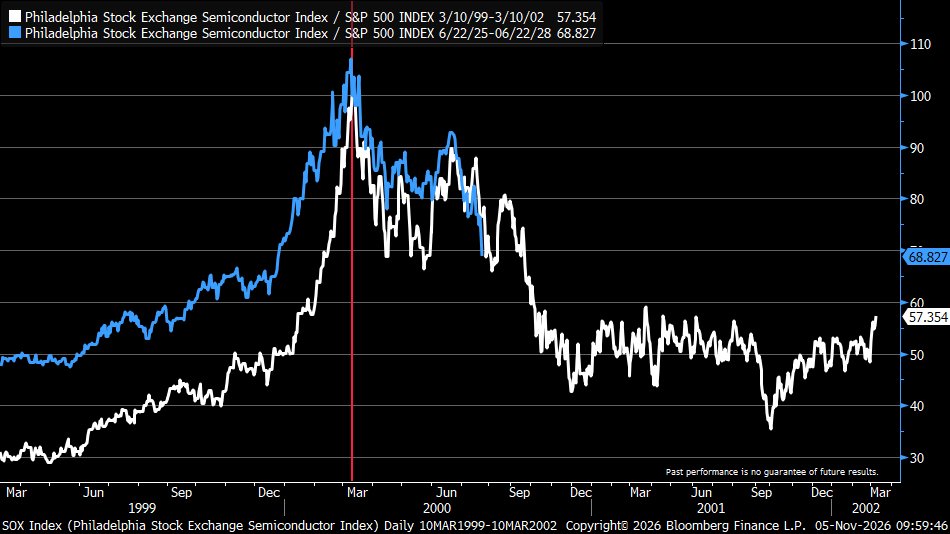
Semiconductors vs the S&P 500 Tracked Against the March 2000 Peak Analog
SOX/S&P 500 relative strength, 2000 vs current overlay | The current ratio hugs the path after the March 2000 top, recently easing to about 68.8
English financial charts and market context published in 2026-11, page 9.
SOX/S&P 500 relative strength, 2000 vs current overlay | The current ratio hugs the path after the March 2000 top, recently easing to about 68.8
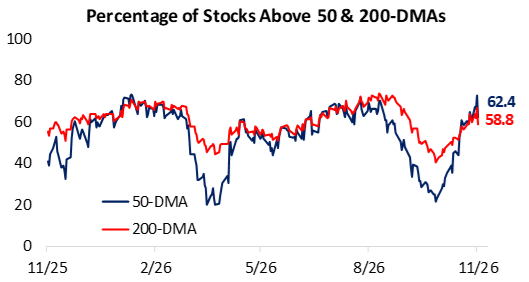
Share of S&P 500 stocks above their 50- and 200-day moving averages, 2025-2026 | Now 62.4% above the 50-DMA and 58.8% above the 200-DMA
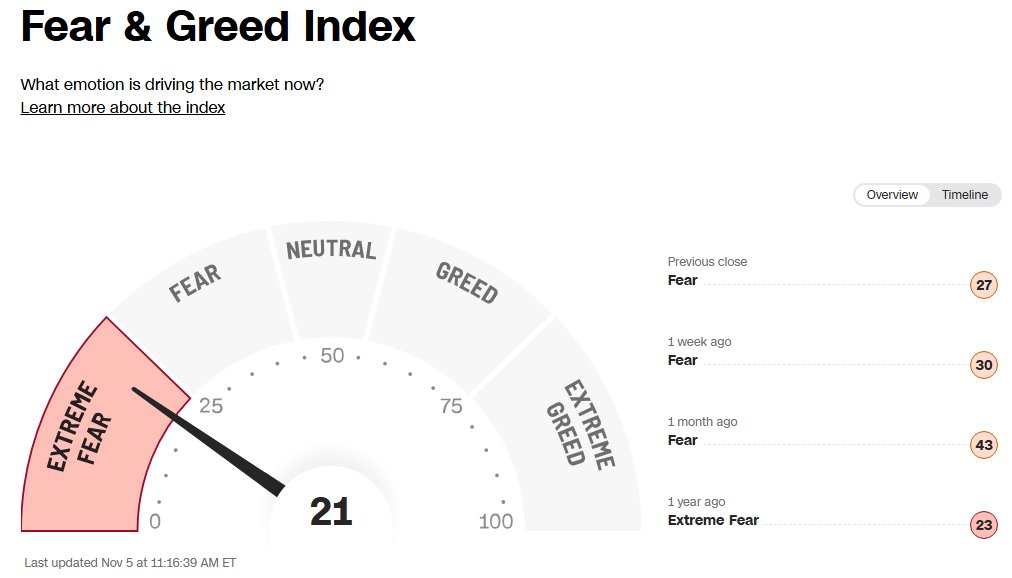
CNN Fear & Greed Index (0-100), live reading | Now 21 in 'Extreme Fear'; 27 at prior close, 30 a week ago, 43 a month ago
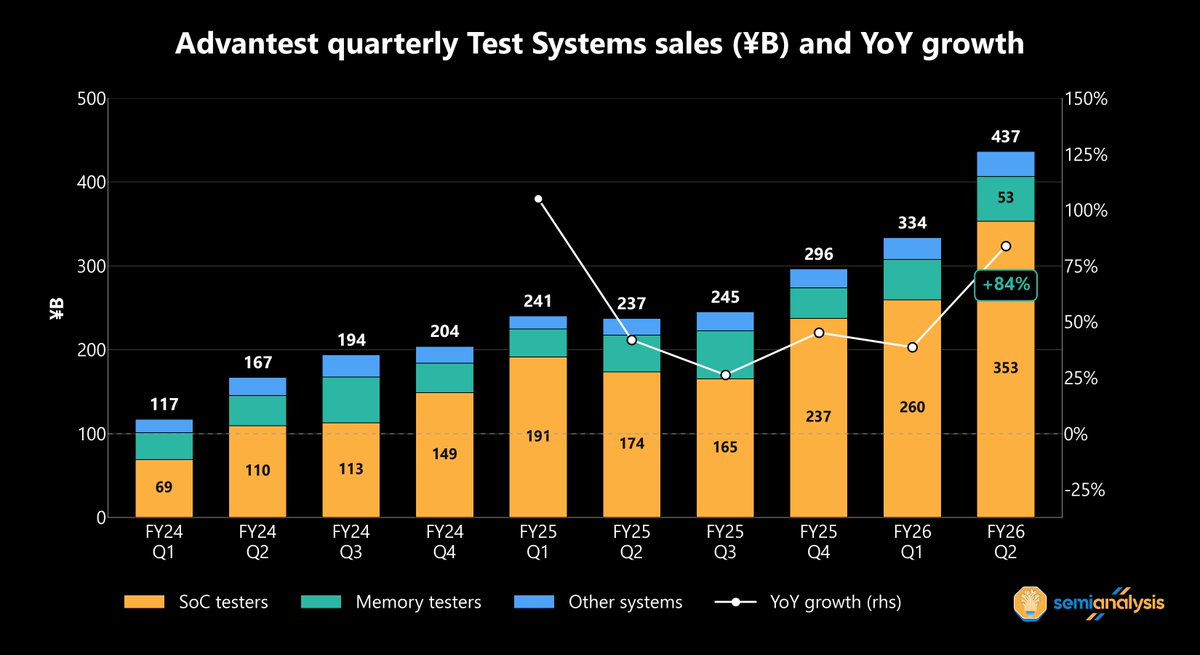
Advantest quarterly test-systems sales (¥B) with YoY growth | FY26 Q2 reached ¥437B, +84% YoY, SoC testers ¥353B
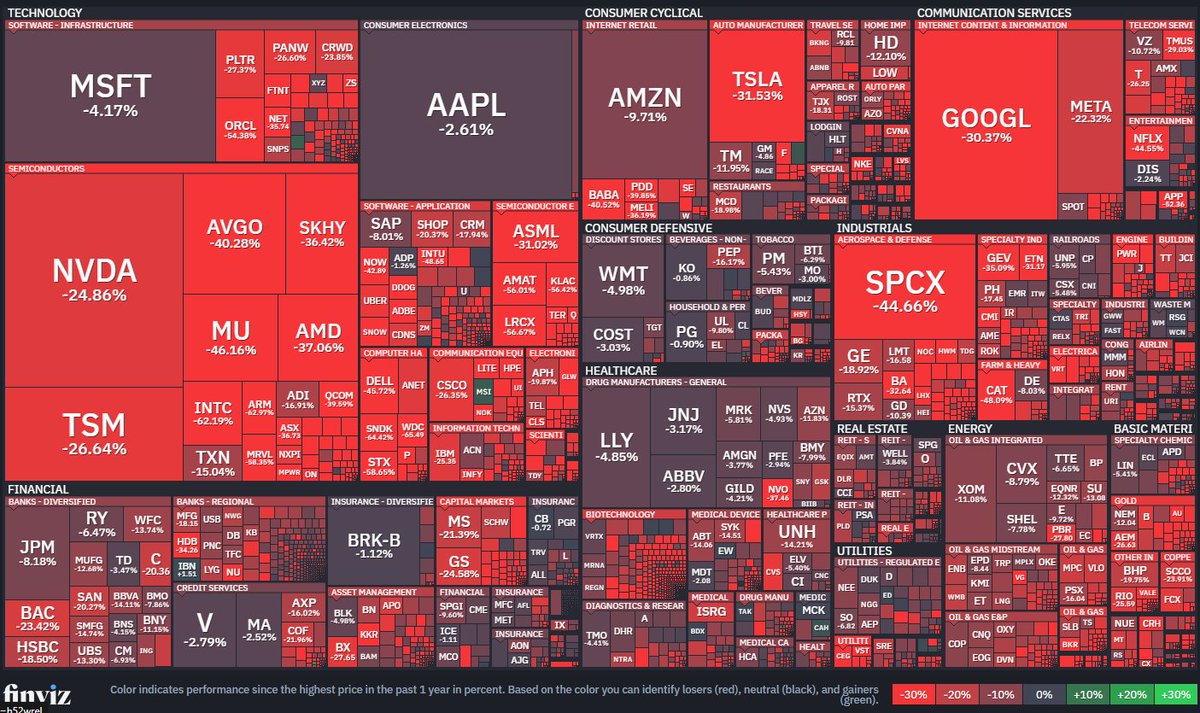
US equities colored by drawdown from the past year's high | MU -46%, SPCX -45%, AVGO -40% and AMD -37% lead the declines
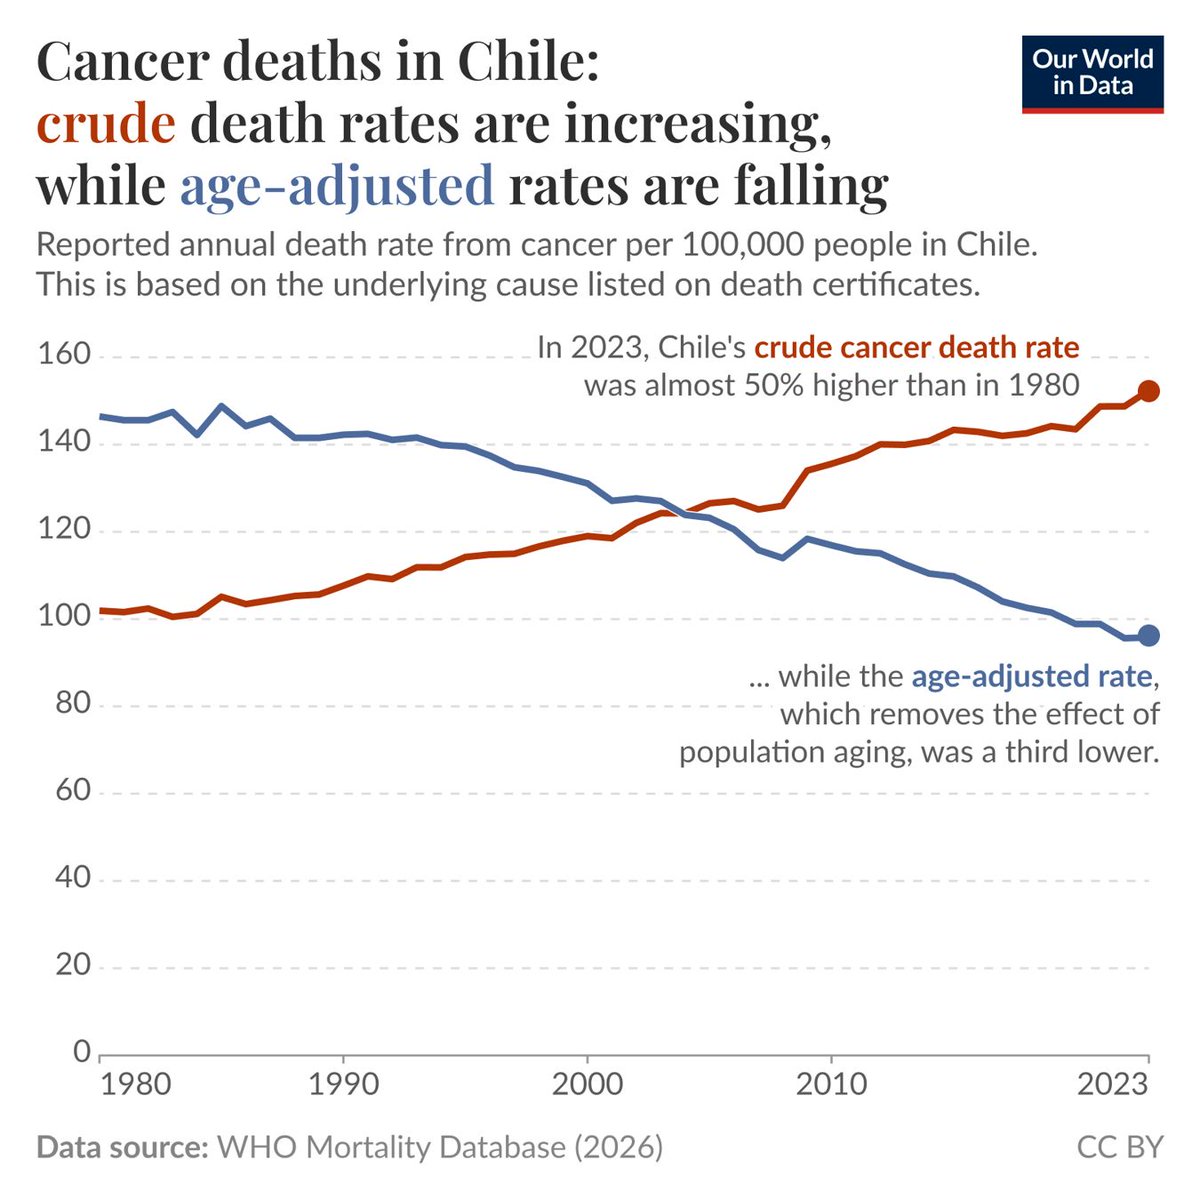
Cancer deaths per 100,000 in Chile, 1980-2023 | Crude rate ~50% above 1980 as the age-adjusted rate dropped about a third
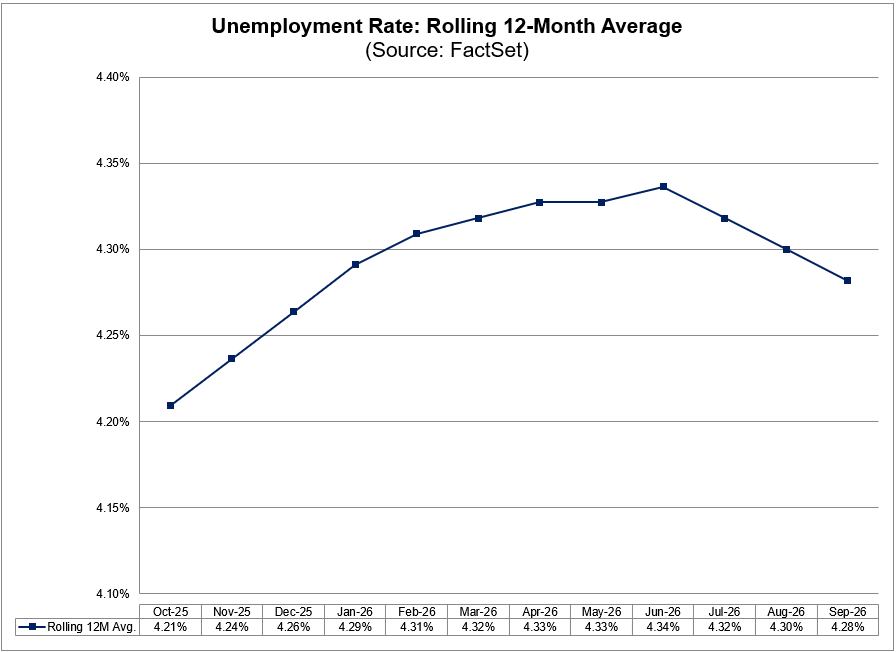
Rolling 12-month average unemployment rate | After peaking at 4.34% in June, it eased to 4.28% in September
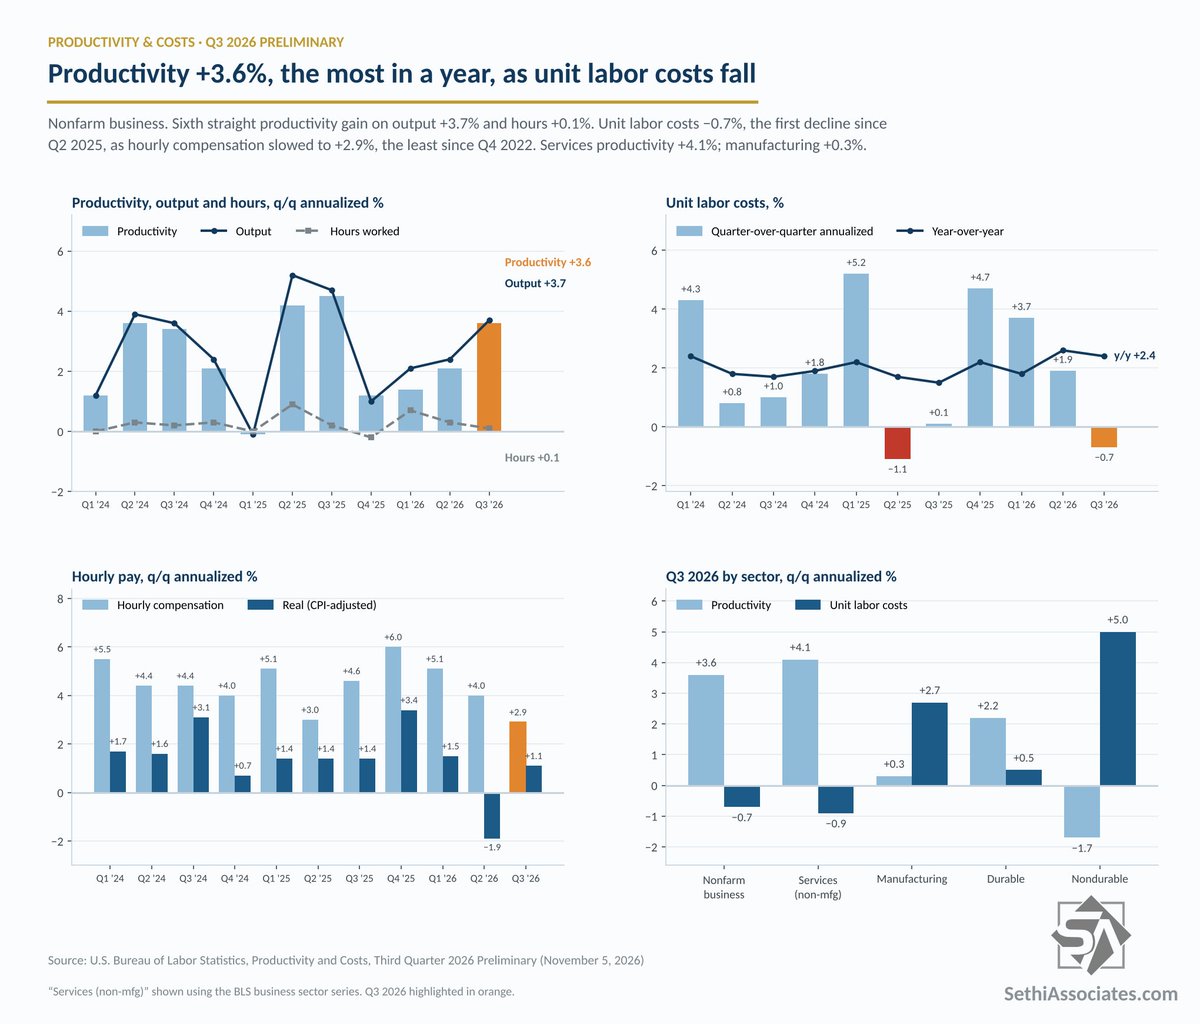
BLS productivity & costs, four panels, 2024-2026 | Q3 productivity +3.6% annualized with output +3.7% and hours +0.1%; unit labor costs -0.7%
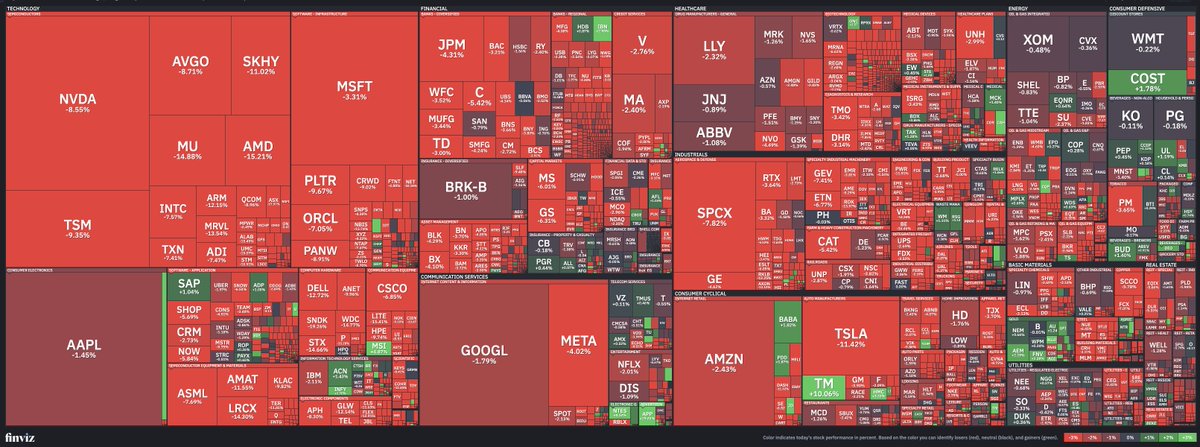
Single-day US stock performance heatmap (finviz; red down, green up) | Few sectors spared — AMD and MU down over 15%, NVDA and TSM about 8%
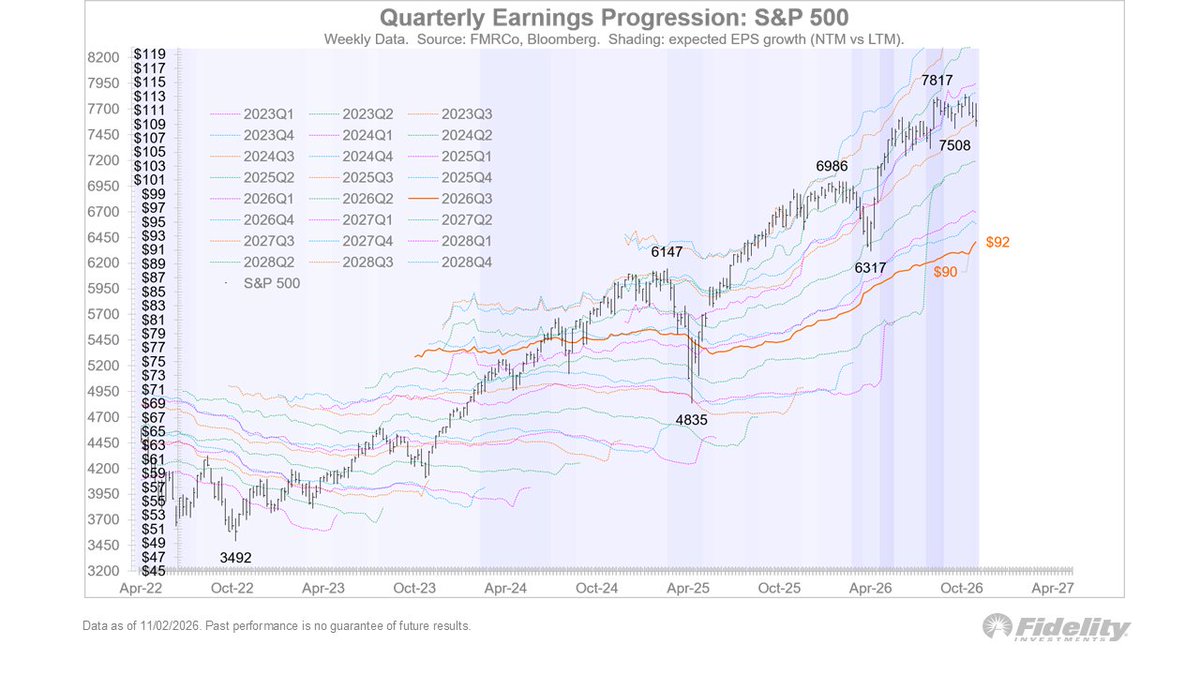
S&P 500 index and quarterly EPS progression, weekly data, 2022-2026 | Q3 2026 EPS up to about $92 as the index made new highs near 7,800
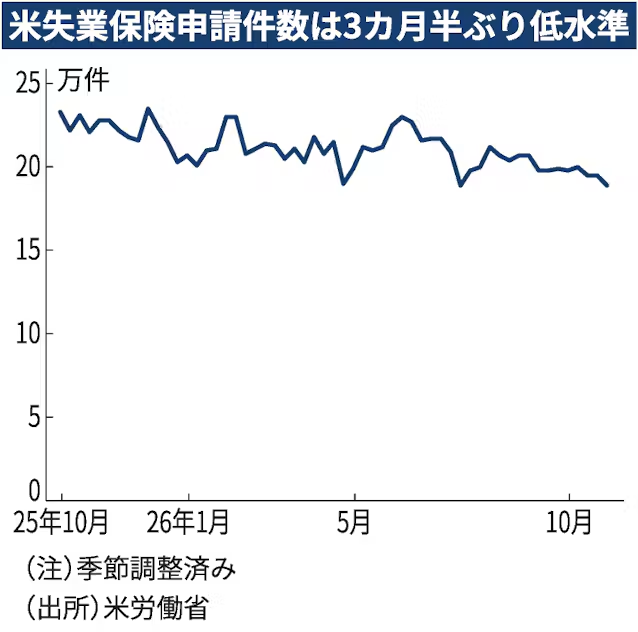
US weekly initial jobless claims (ten-thousands, SA), Oct 2025–Oct 2026 | Latest near 189,000, the lowest in about 3½ months
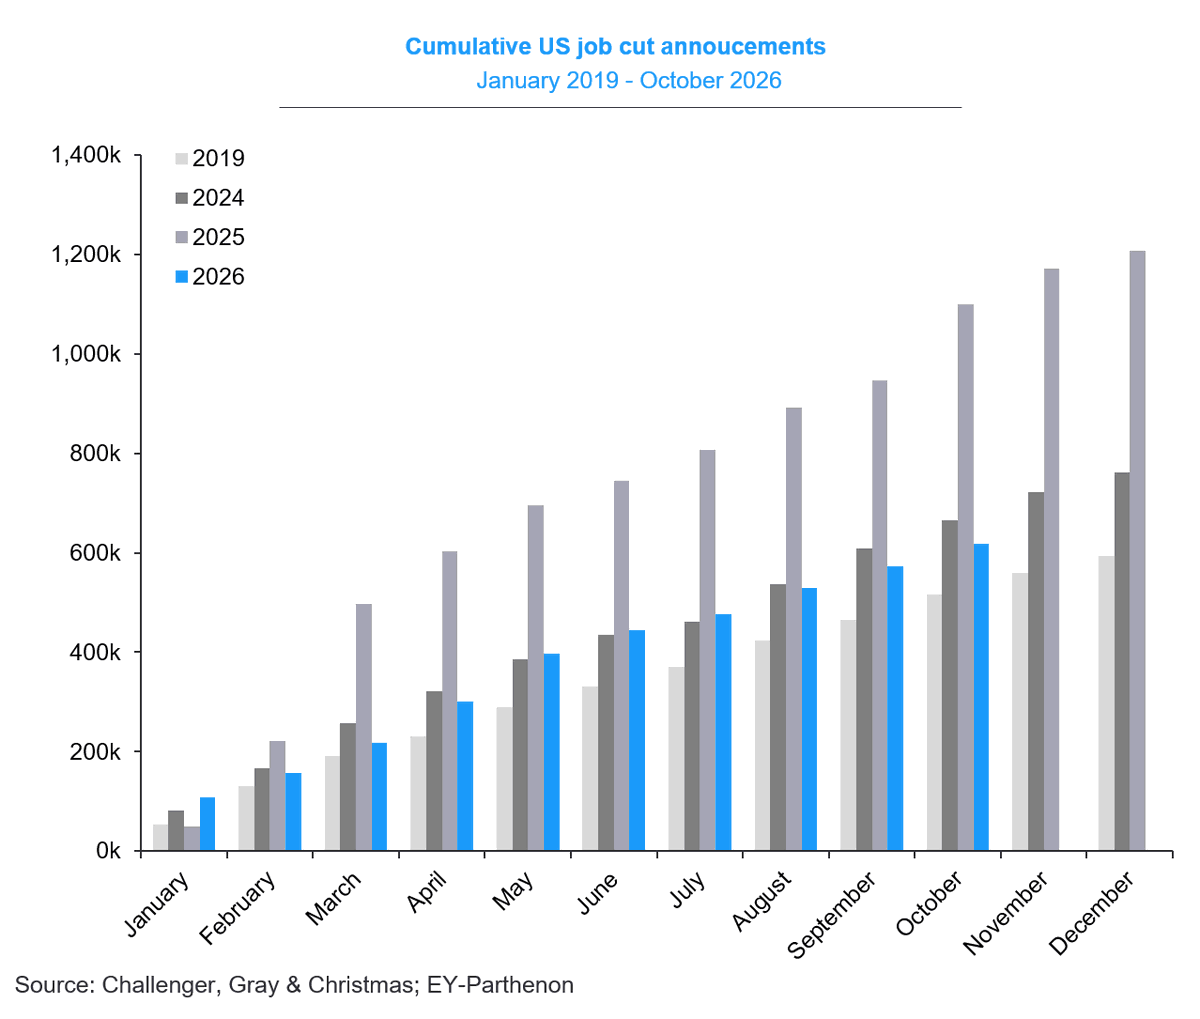
Cumulative US job-cut announcements by year, Jan-Dec, 2019/2024/2025/2026 | 2026 stands at ~617k through October, down 44% from ~1.1M in the same period of 2025
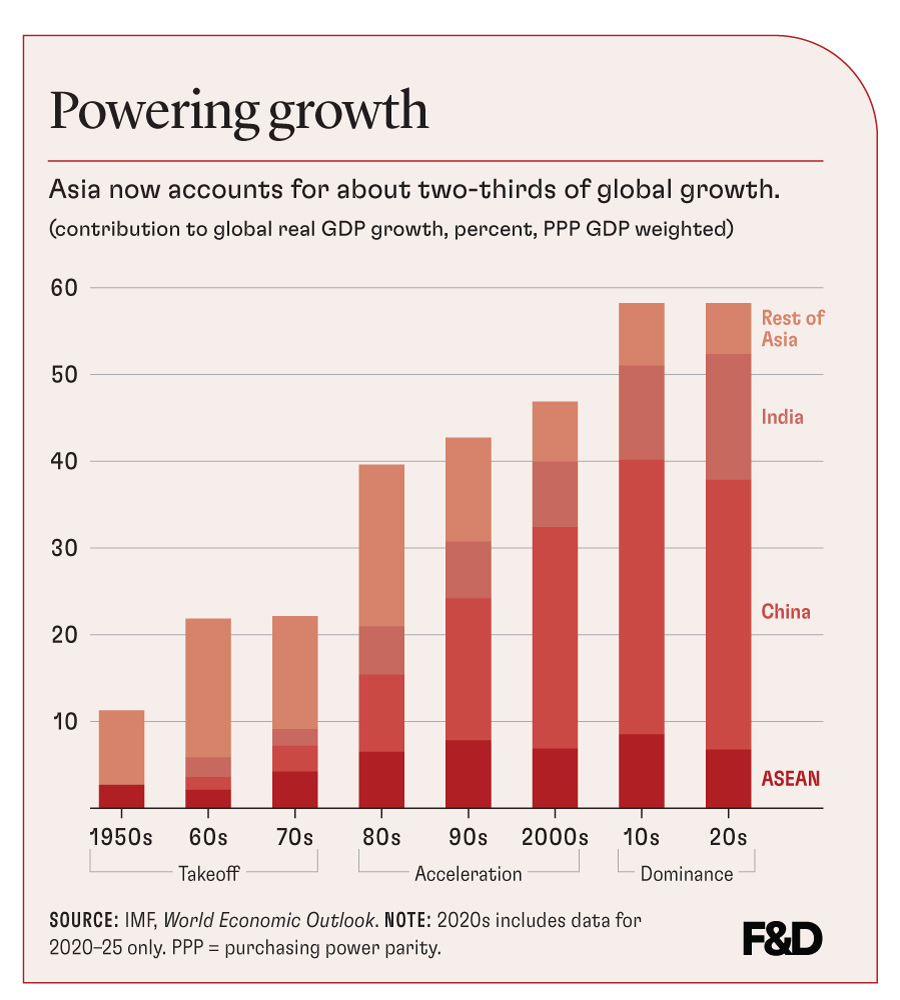
Asia's contribution to global GDP growth, %, PPP-weighted, 1950s-2020s | ~58% since the 2010s, with China alone about 40%, the largest single share
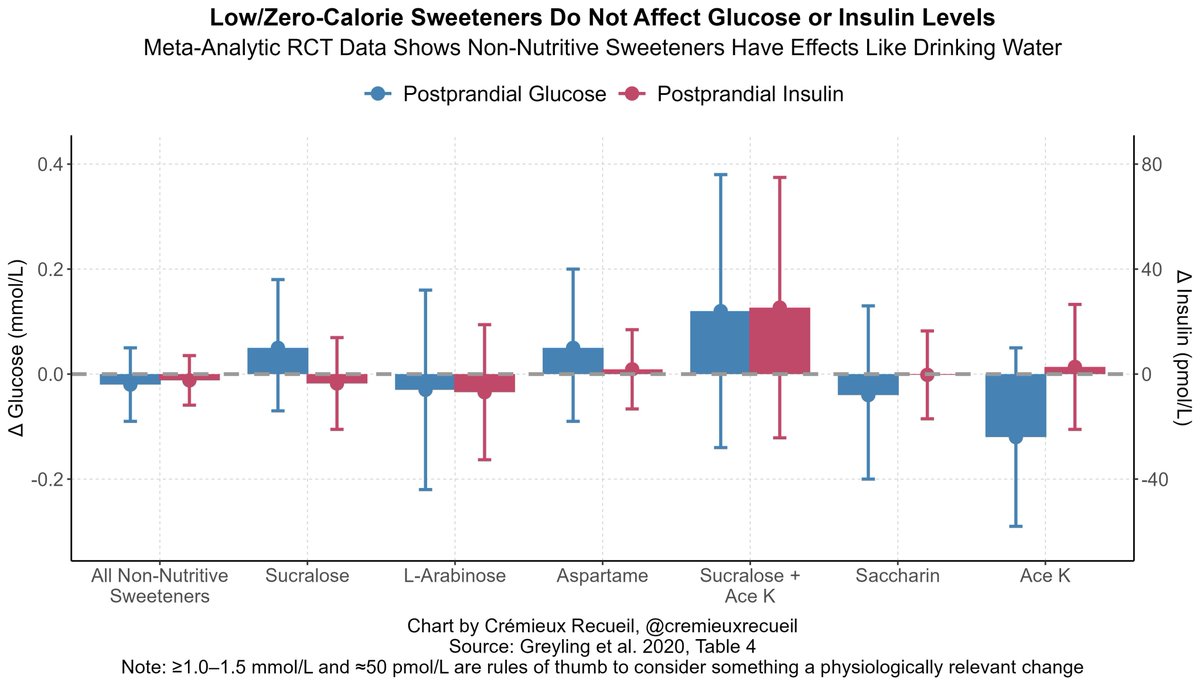
Postprandial glucose and insulin change by sweetener, meta-analytic RCT data | Effects for non-nutritive sweeteners cluster near zero
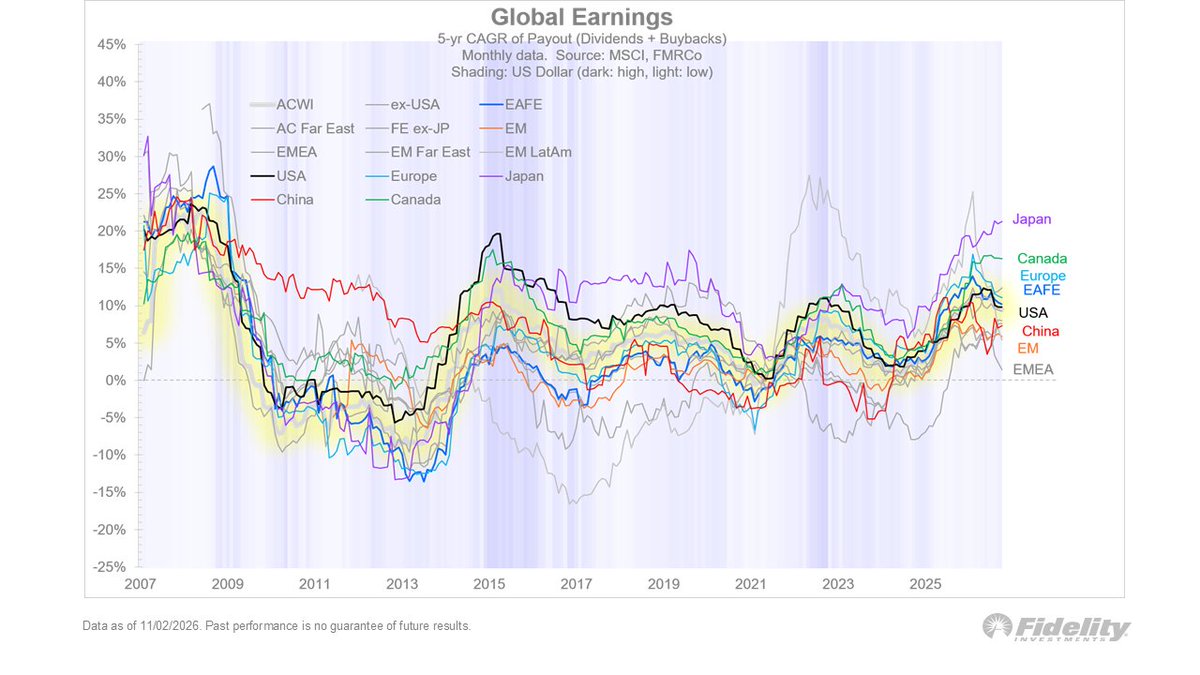
5-year CAGR of payout (dividends + buybacks) by region, 2007-2026 | Most regions including the US have peaked, while Japan keeps climbing to about 22%
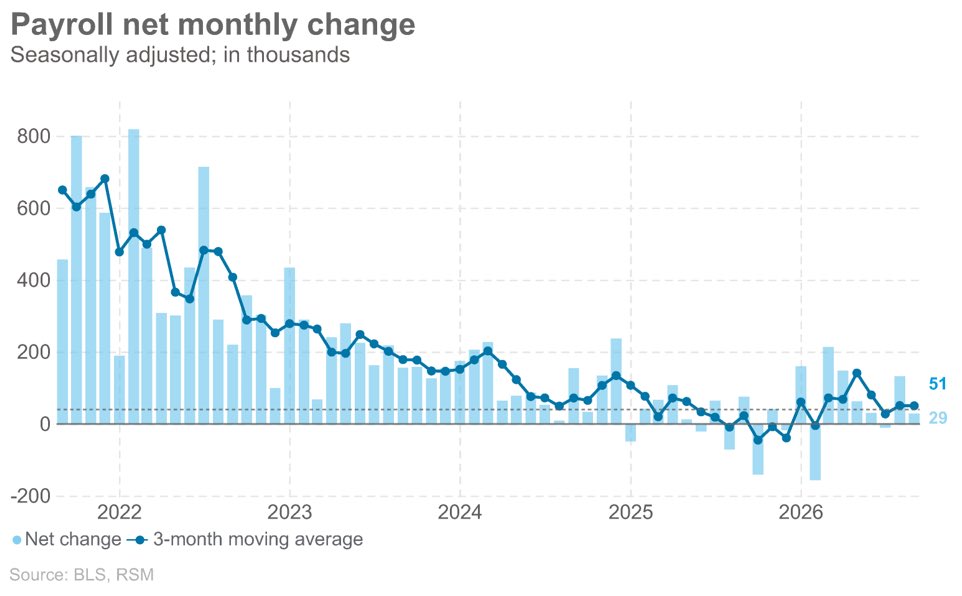
US nonfarm payroll net monthly change (thousands, SA) and 3-month moving average, 2022-2026 | Latest +29,000, 3-month average 51,000, far below the 800,000+ peaks of 2022
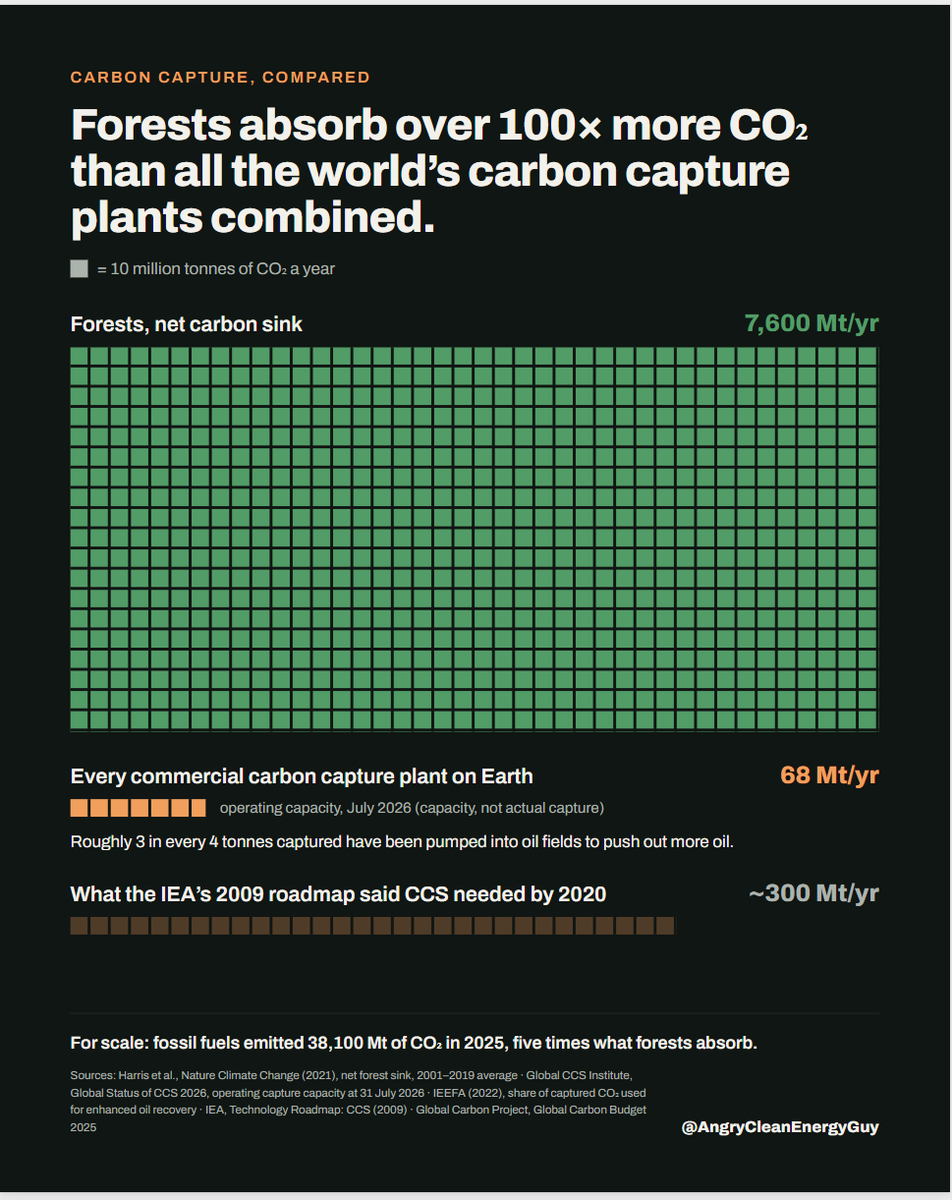
Forests' net carbon sink vs. global carbon-capture capacity | Forests take in 7,600 Mt/yr vs. just 68 Mt for all CCS plants, a 100x-plus gap
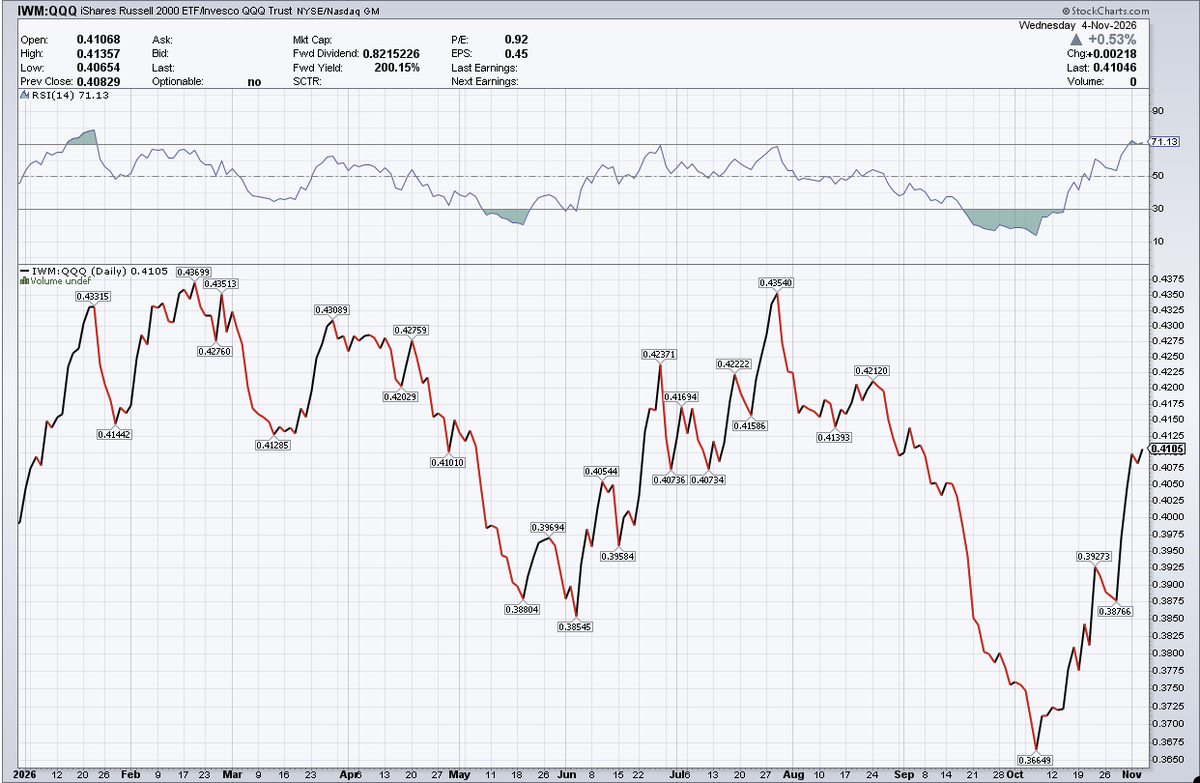
iShares Russell 2000 to Invesco QQQ ratio, daily with RSI | Rebounded to 0.4105 from an October low of 0.367, with RSI back near 71
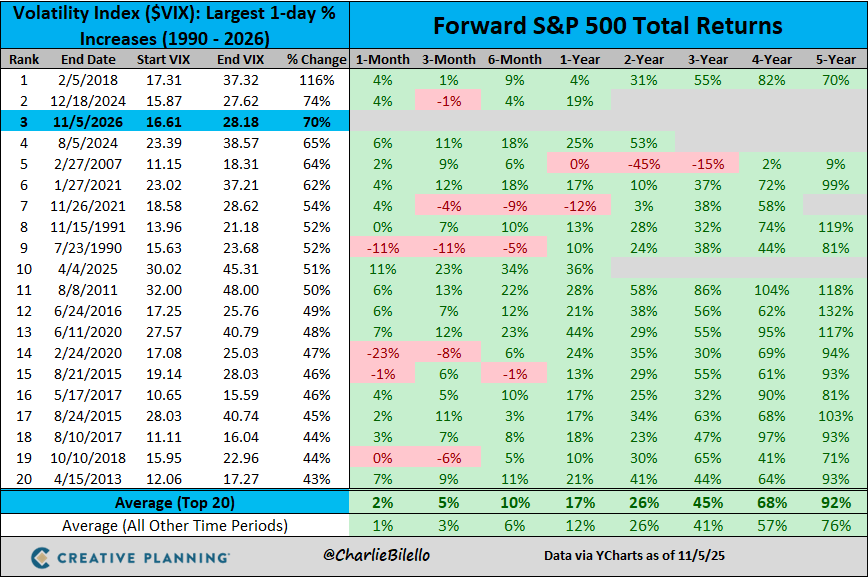
Largest 1-day VIX spikes since 1990 and subsequent S&P 500 forward returns | Nov 5's +70% ranks 3rd; the top 20 averaged +17% over the next year
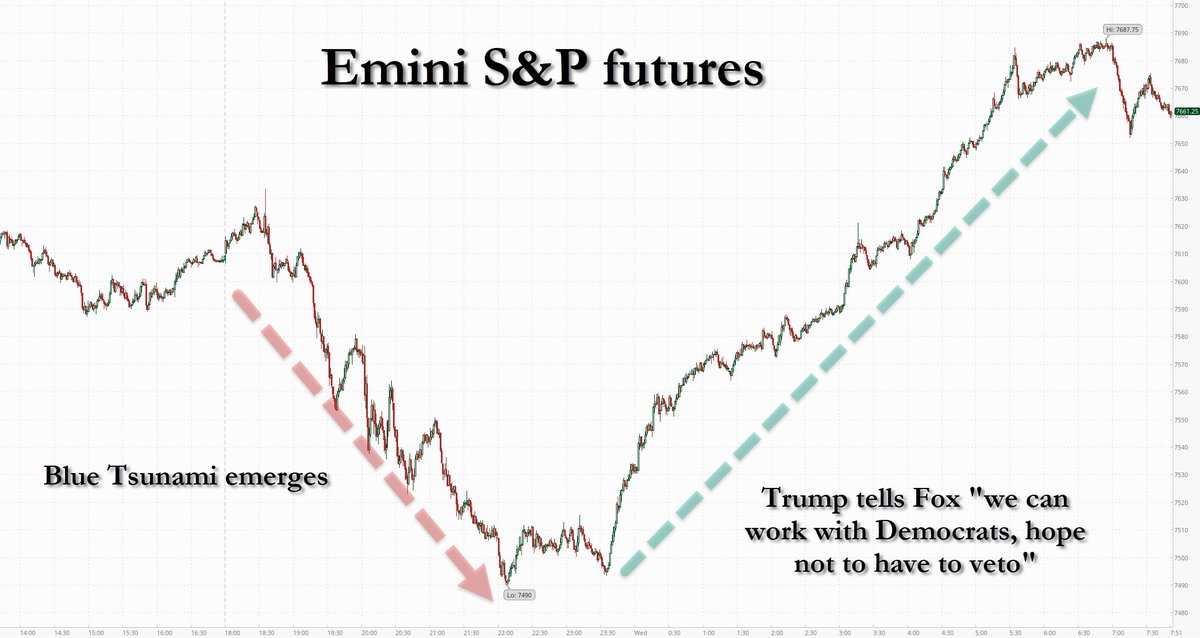
E-mini S&P 500 futures, overnight intraday | Dipped to a low of 7,490 before recovering to a high of 7,687.75; last 7,661.25
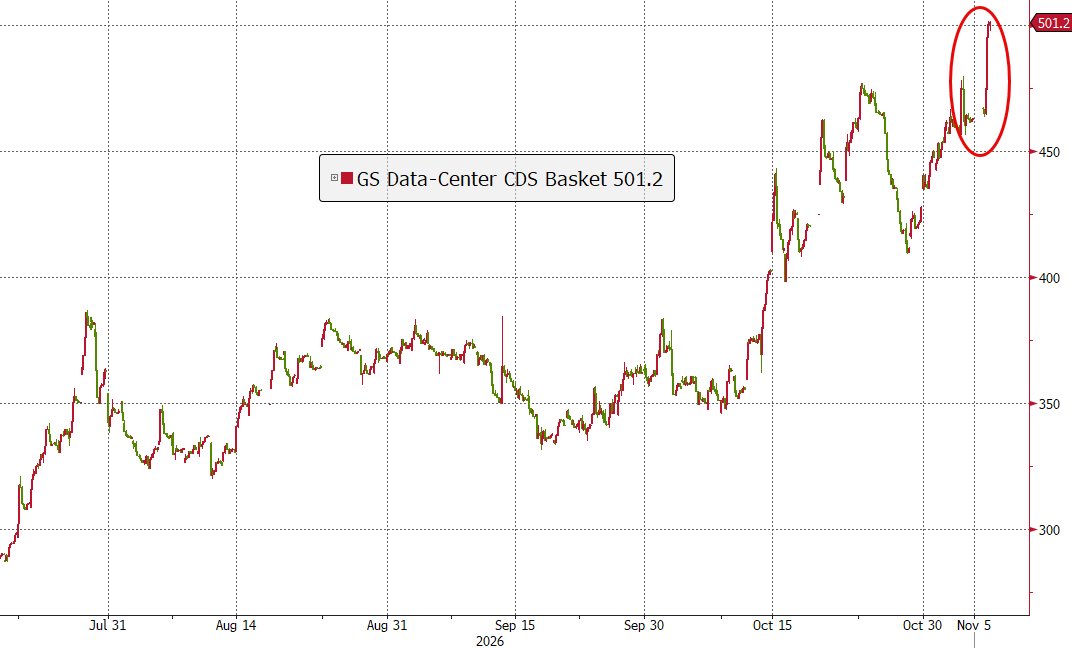
Goldman Sachs data-center CDS basket | Climbed to 501.2, an all-time high, after a sharp rise since late October
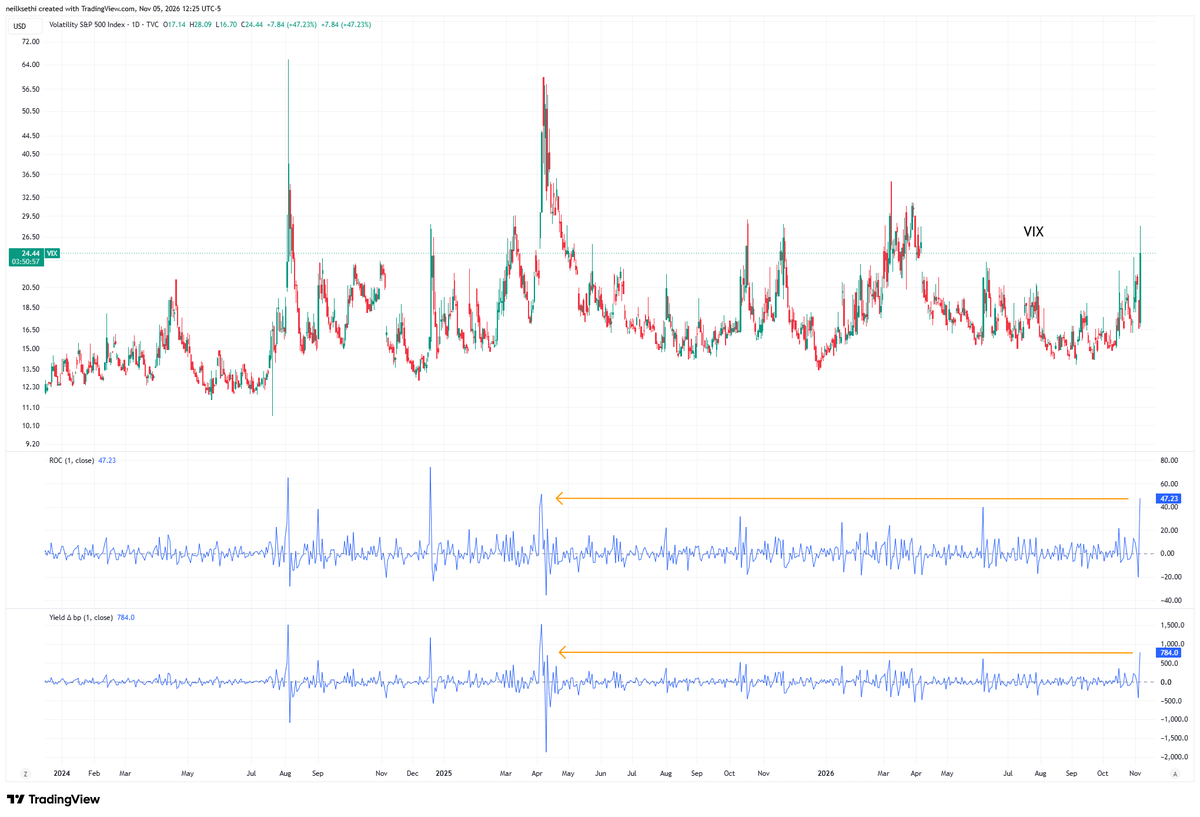
Cboe VIX volatility index, daily with 1-day rate-of-change, 2024-2026 | Up about 47% (+7.84) on the day to 24.44, the largest daily gain since April 2025
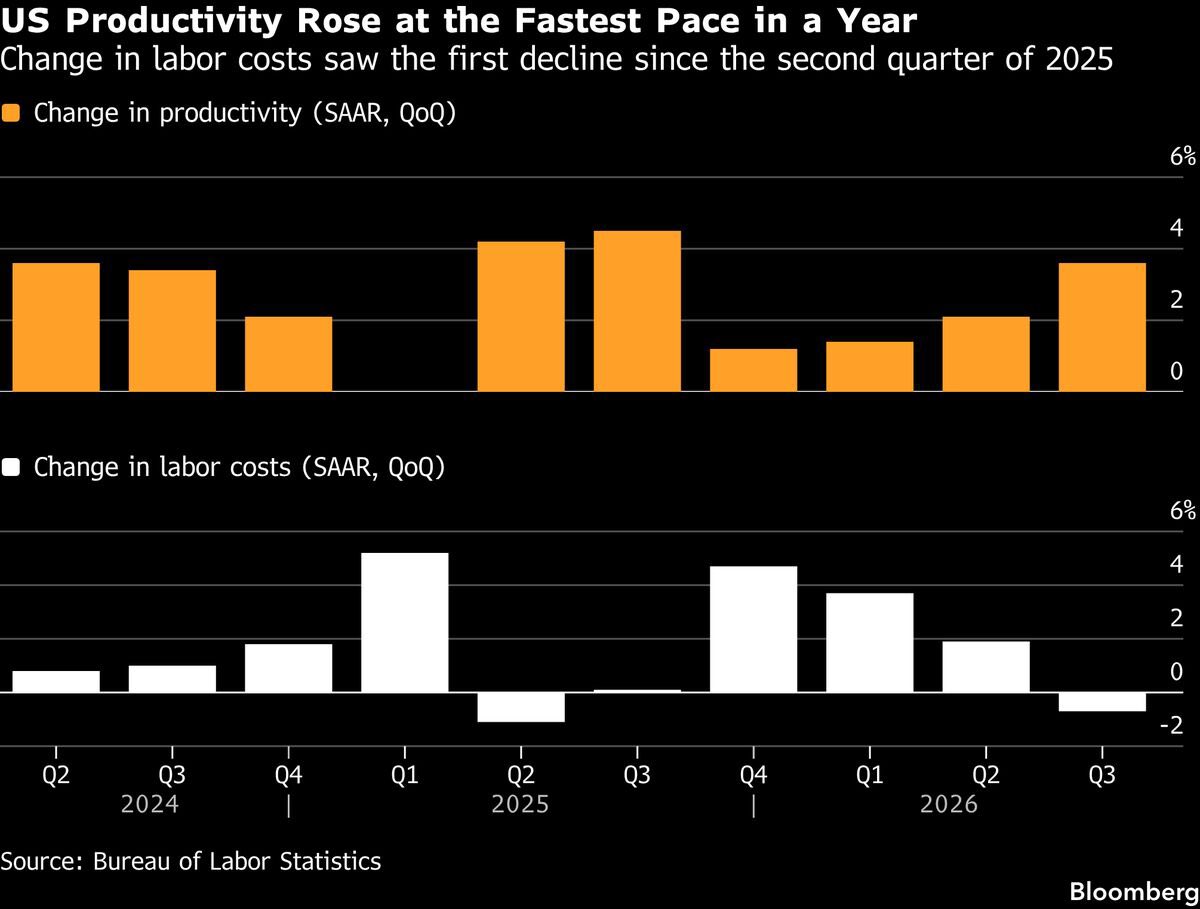
U.S. nonfarm productivity and unit labor costs, SAAR QoQ, 2024-2026 | Q3 2026 productivity up 3.6% annualized, the fastest in a year, as labor costs turned down
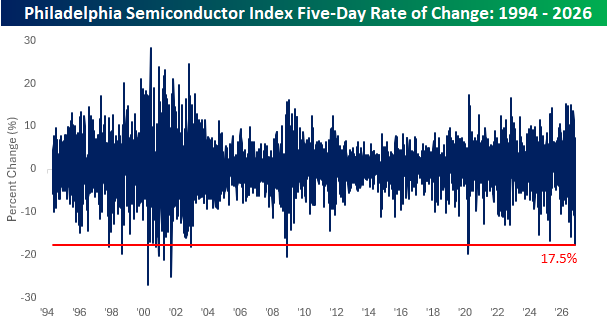
SOX five-day rate of change, 1994-2026 | A latest five-day fall of 17.5%, seen only in five crisis episodes since 1994
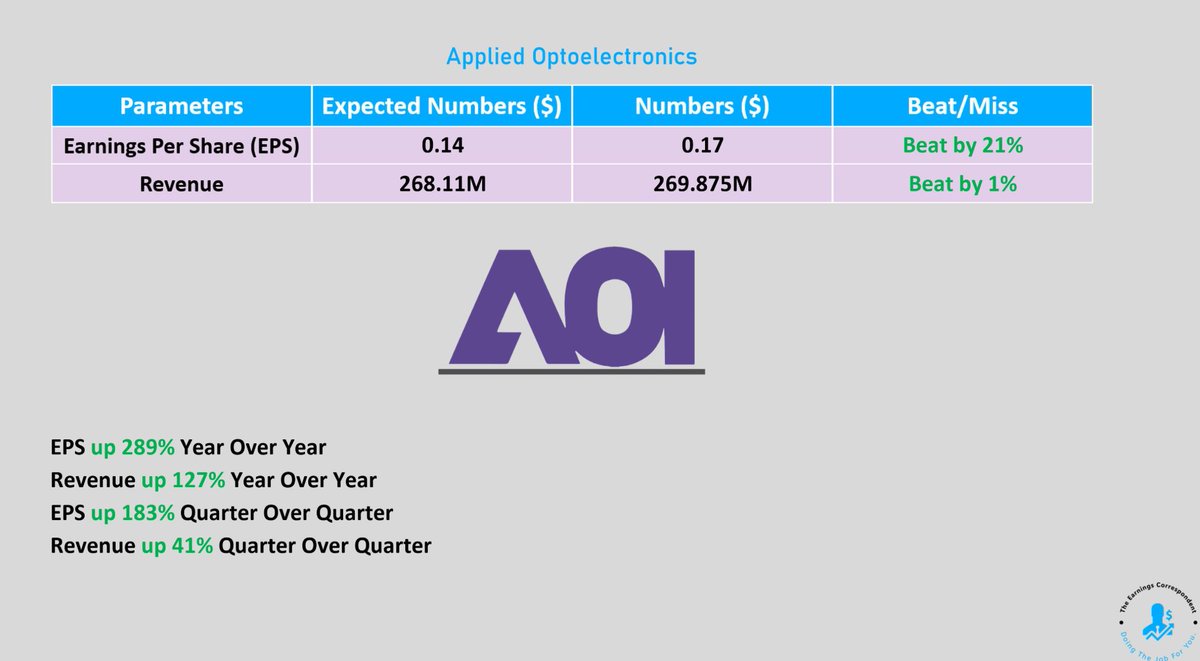
Applied Optoelectronics quarterly results | EPS $0.17 beat the $0.14 estimate by 21%; revenue $269.9M, up 127% YoY
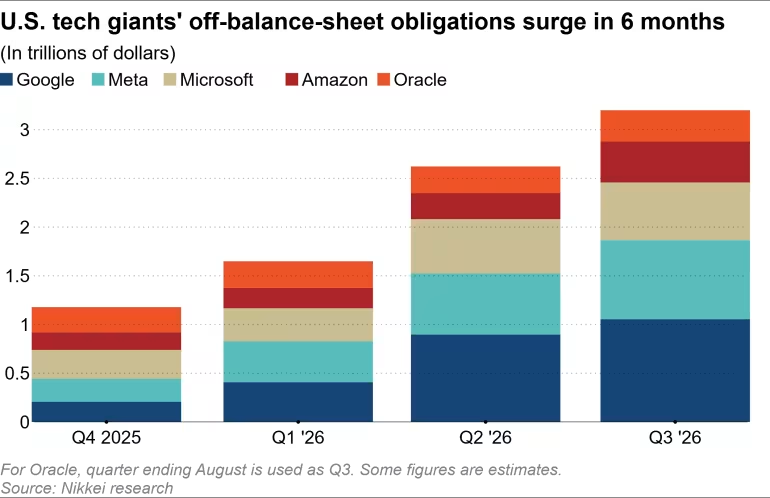
Off-balance-sheet obligations of Google, Meta, Microsoft, Amazon and Oracle (trillions), Q4 2025–Q3 2026 | ~$3.2T in Q3 2026, nearly doubling in six months; Google largest at ~$1.05T
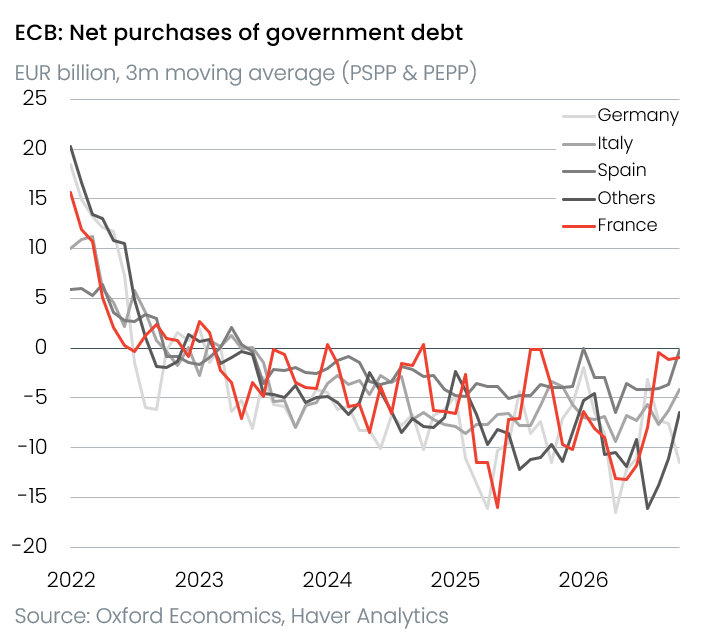
ECB net government-debt purchases by country (EUR billion, 3-month MA, PSPP & PEPP) | Turned negative after 2022; most countries run monthly net sales in 2025-2026
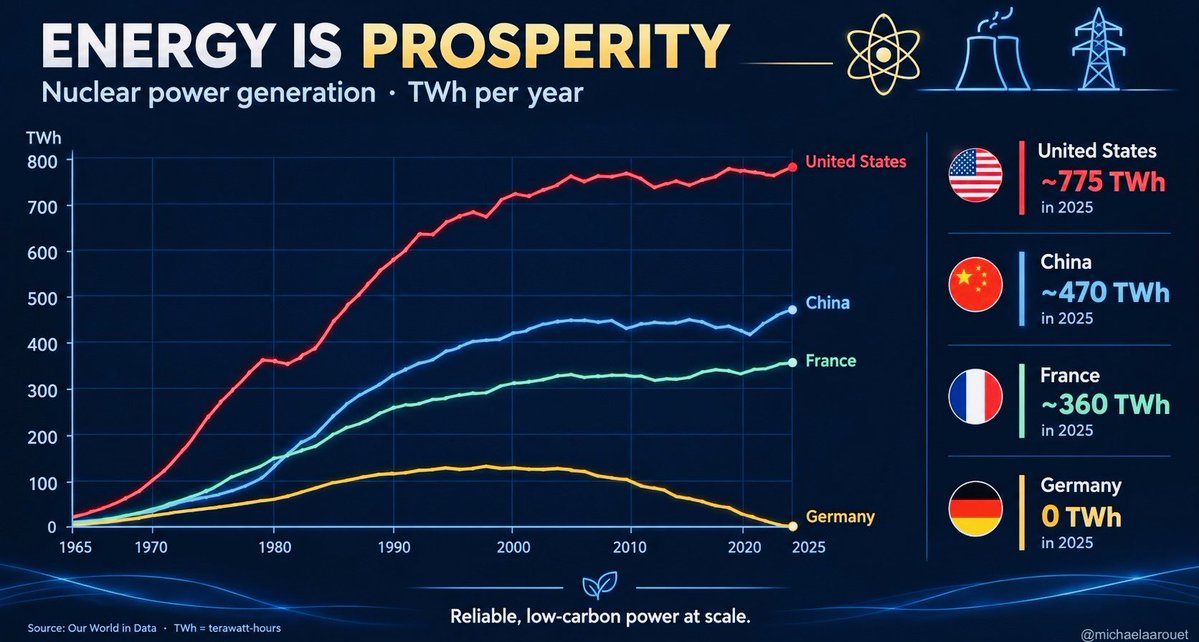
Annual nuclear power generation by country (TWh), 1965-2025, Our World in Data | In 2025 the US leads at ~775 TWh, China ~470, France ~360, Germany 0
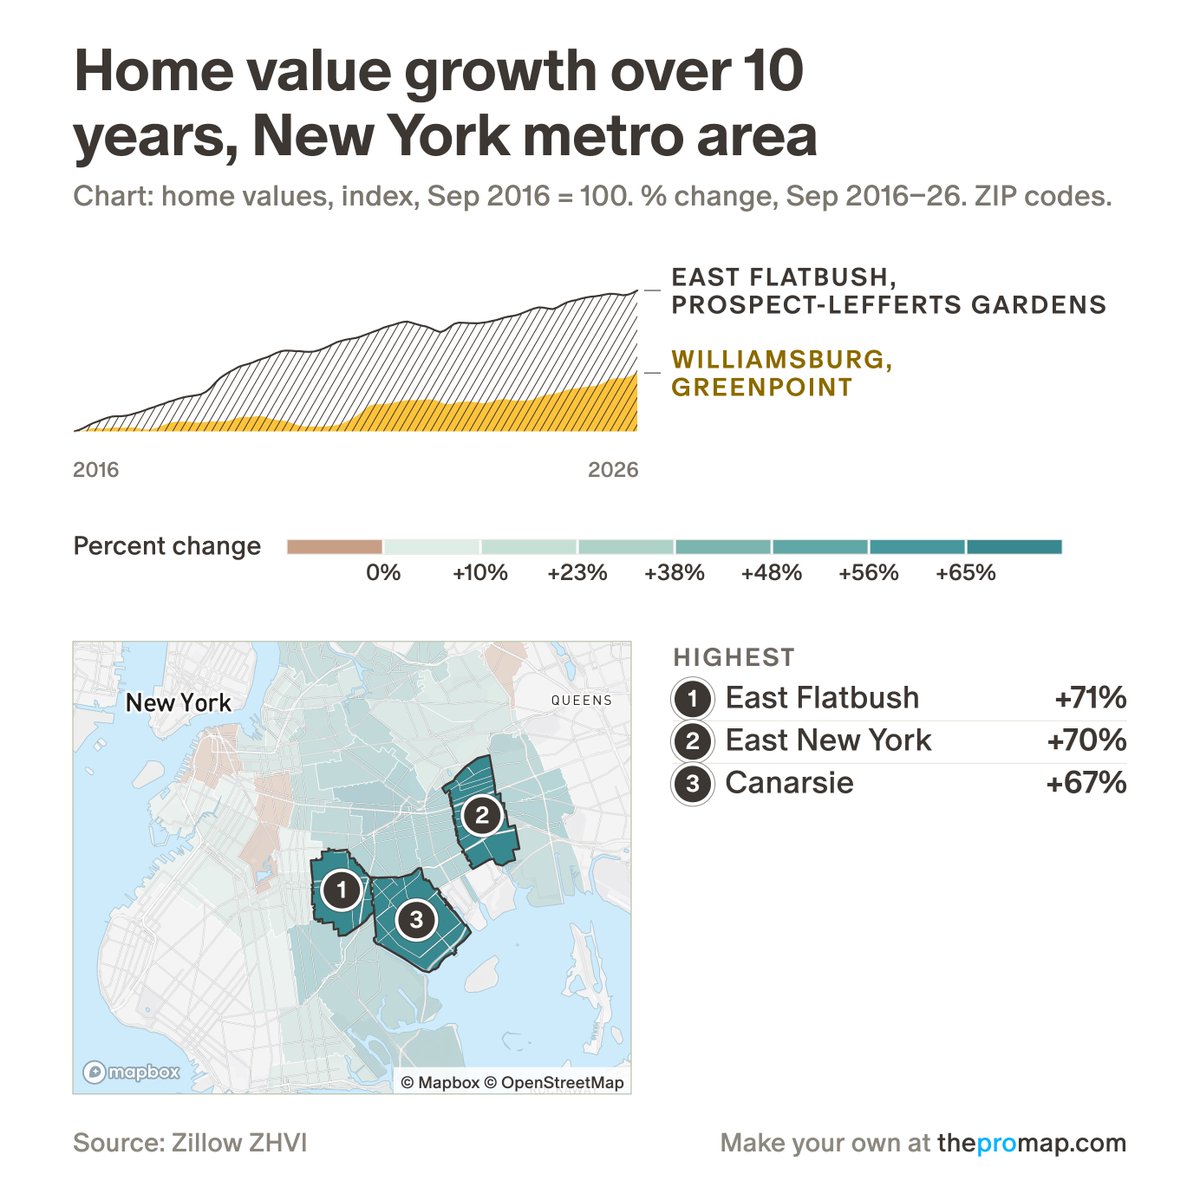
New York metro home-value growth over 10 years, index Sep 2016=100 | Top ZIPs: East Flatbush +71%, East New York +70%, Canarsie +67%
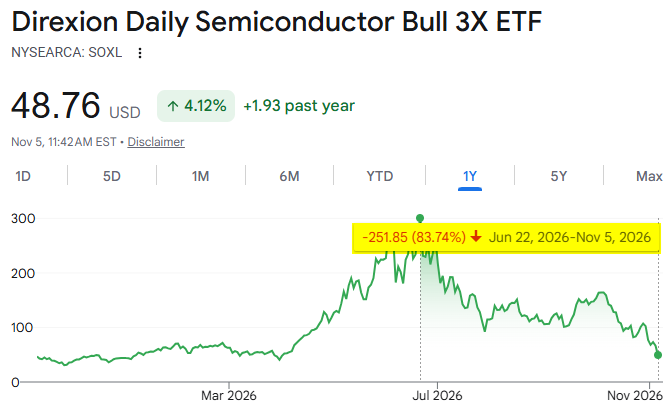
Direxion Daily Semiconductor Bull 3x ETF (SOXL), past year | Down about 84% (-251.85) from its June 22 peak, last at $48.76
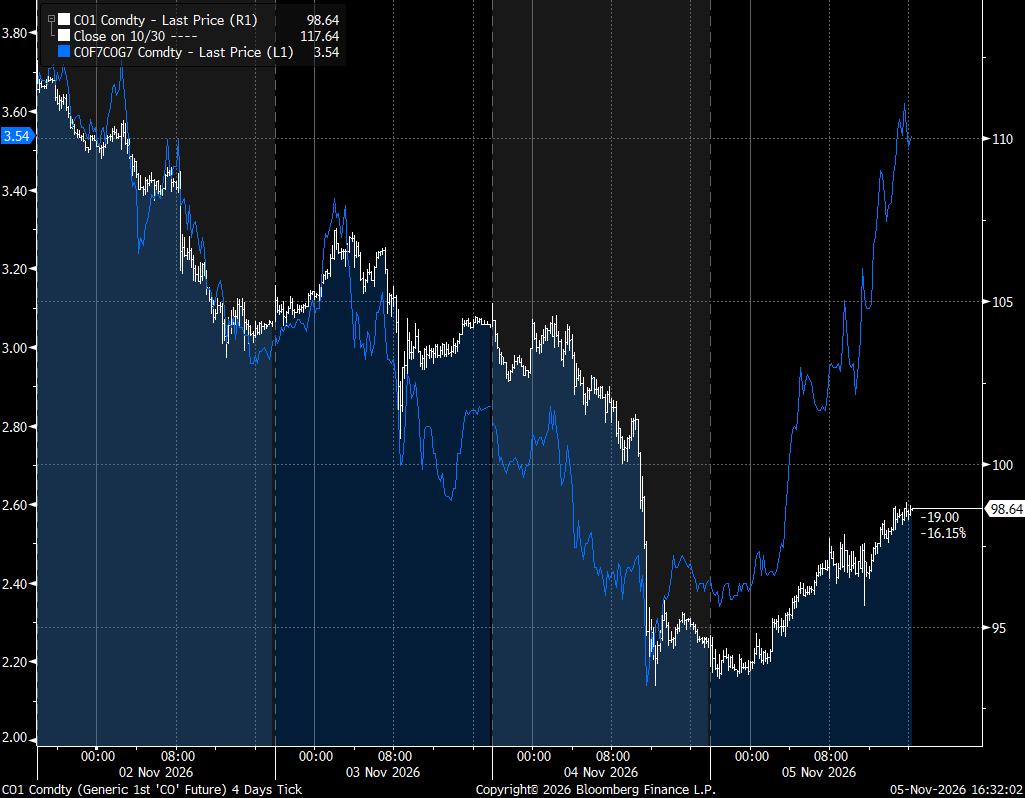
Brent crude flat price (white) and prompt timespread (blue), 4-day tick | Flat price clawed back about half of the prior day's drop; the prompt spread is back near Monday's high around 3.54
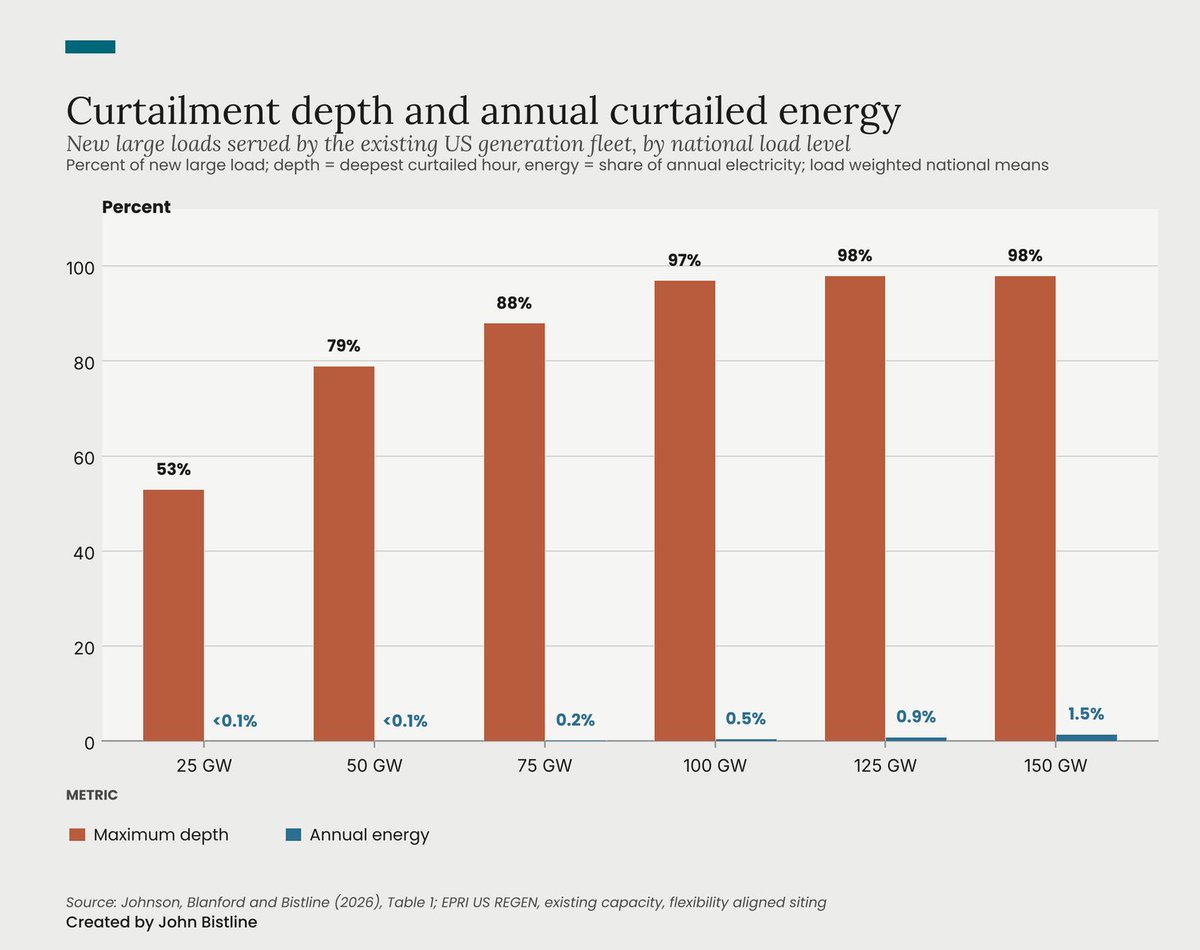
Curtailment depth and annual curtailed energy for new large loads on the existing US grid | At 50 GW the deepest hour needs a 79% cut, but under 0.1% of annual energy is curtailed
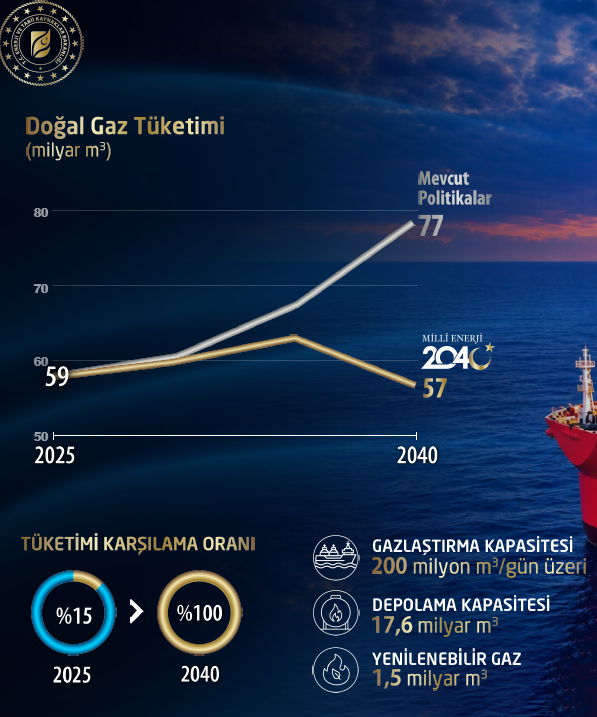
Turkey natural gas demand and self-sufficiency outlook | The 2040 target cuts demand to 57 bcm and lifts self-sufficiency from 15% to 100%
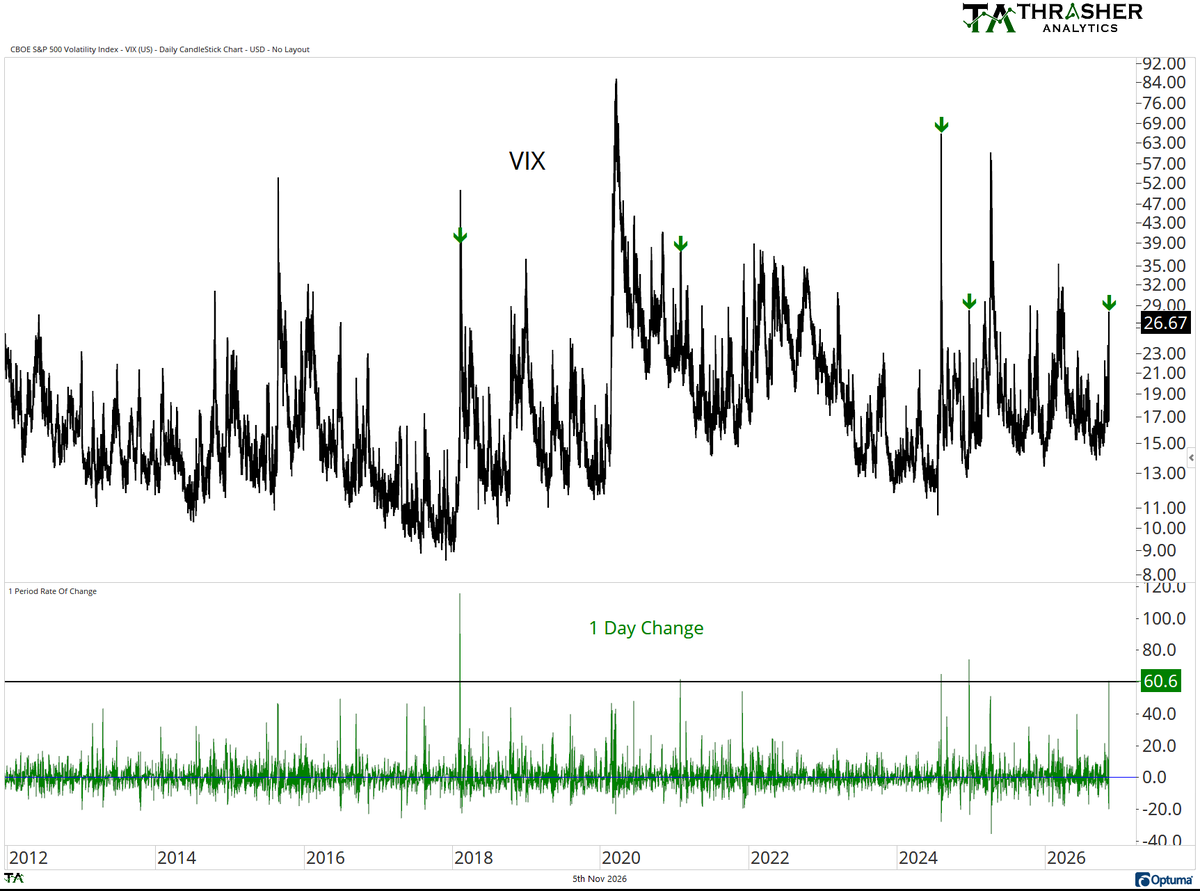
CBOE VIX daily with 1-day rate of change, 2012-2026 | Latest one-day jump of 60.6% to 26.67, a rare single-day surge
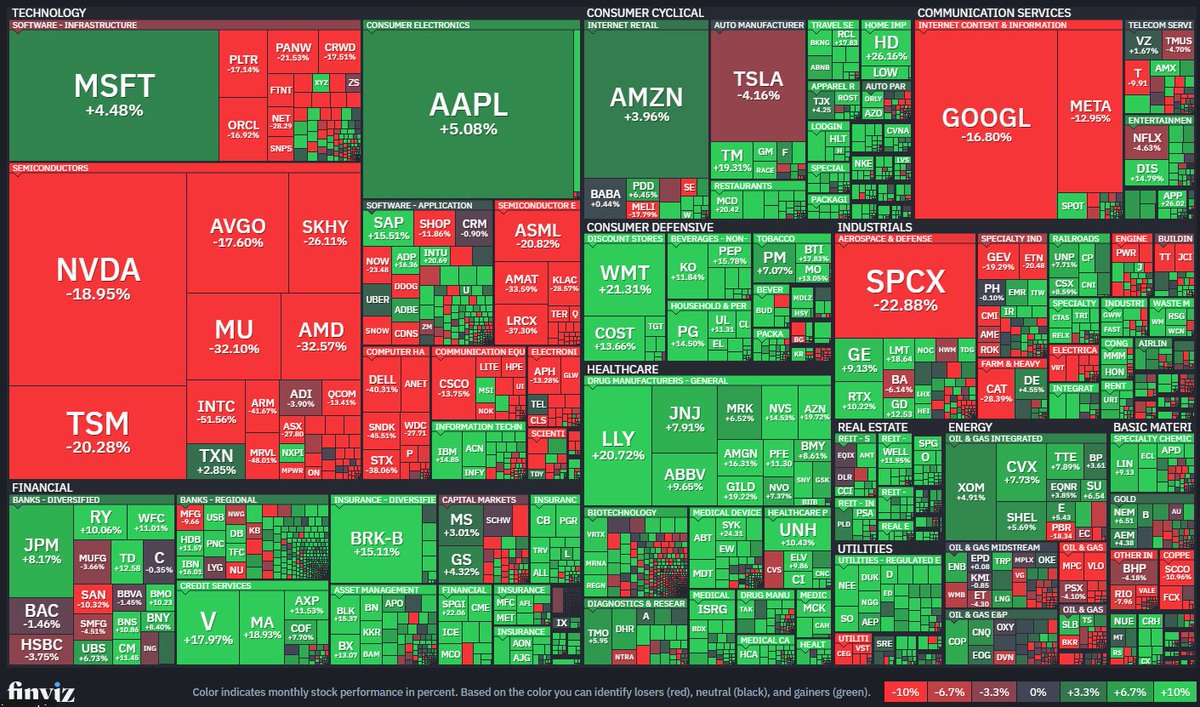
Monthly performance heatmap of US stocks (finviz; red down, green up) | INTC -52% and NVDA -19%, while HD +26% and WMT +21%
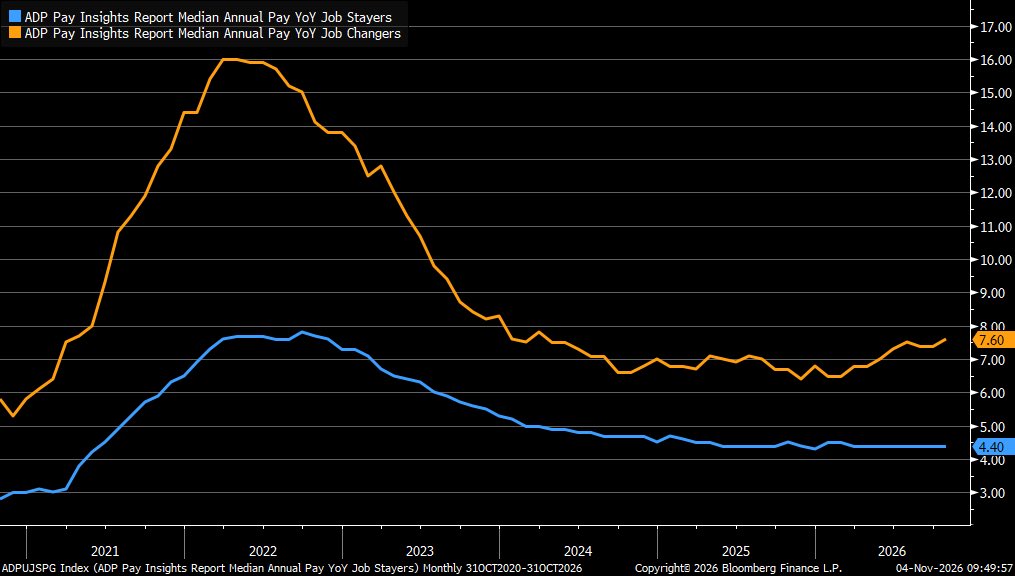
ADP median annual pay YoY, job changers vs stayers | Changers up 7.6% in October vs 4.4% for stayers, a widening gap
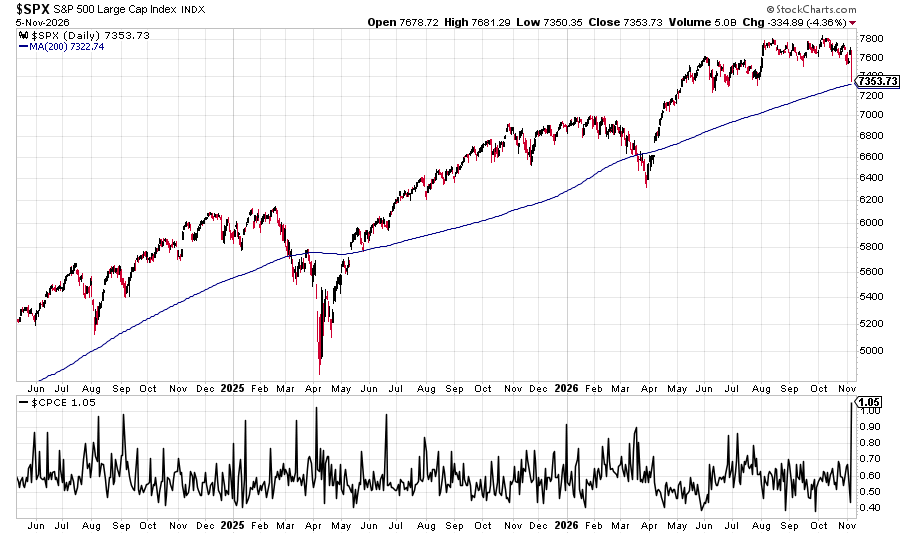
S&P 500 (top) and equity put/call ratio (bottom), 2024-2026 | The ratio hit 1.05 today, above its level during April's selloff
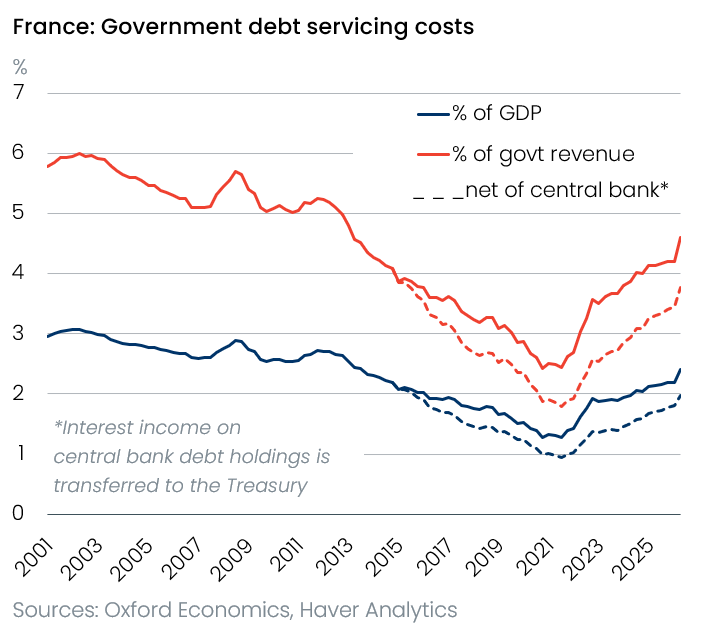
France government debt-servicing costs, % of GDP and of revenue, 2001-2025 | Now about 4.6% of revenue and 2.4% of GDP, up sharply from the 2021 low
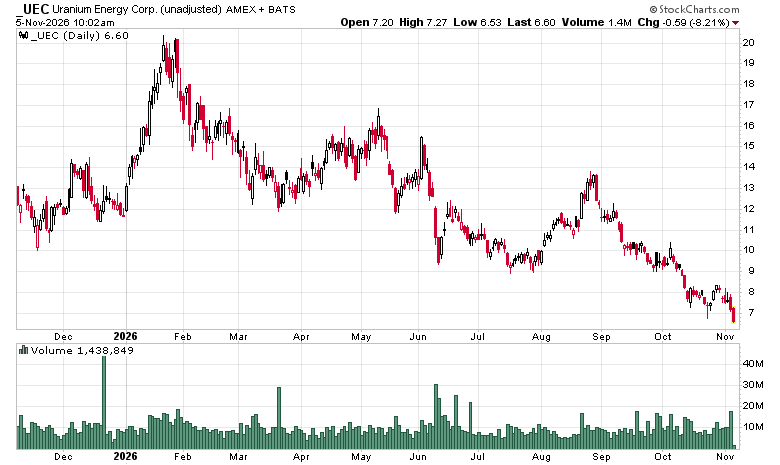
Uranium Energy (UEC) daily price | Last $6.60, down about 70% from its February high near $20
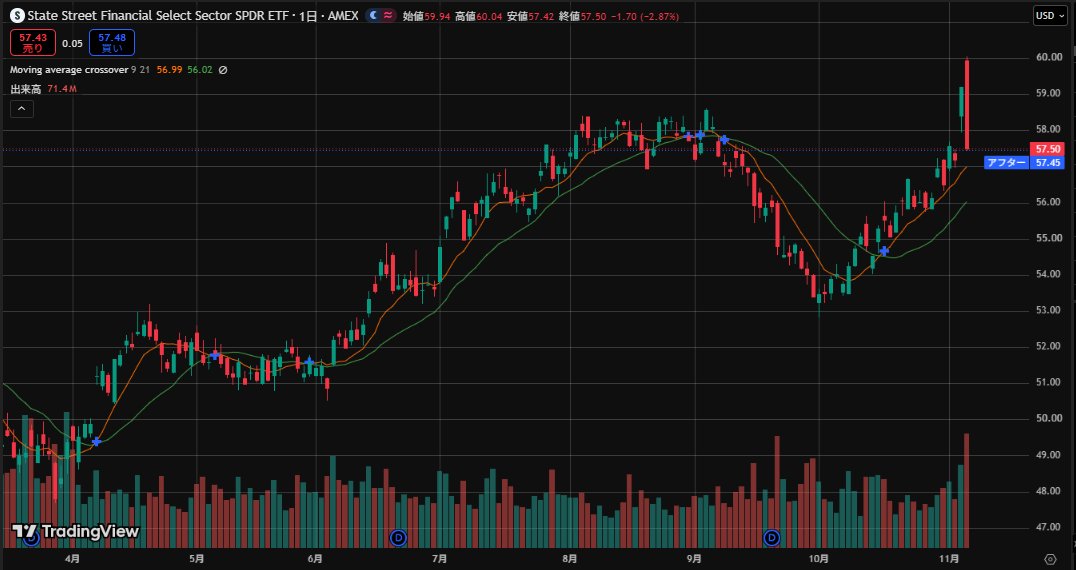
XLF daily price, USD | Last $57.50, -2.87% on the day, slipping again after rebounding from the October low near 54
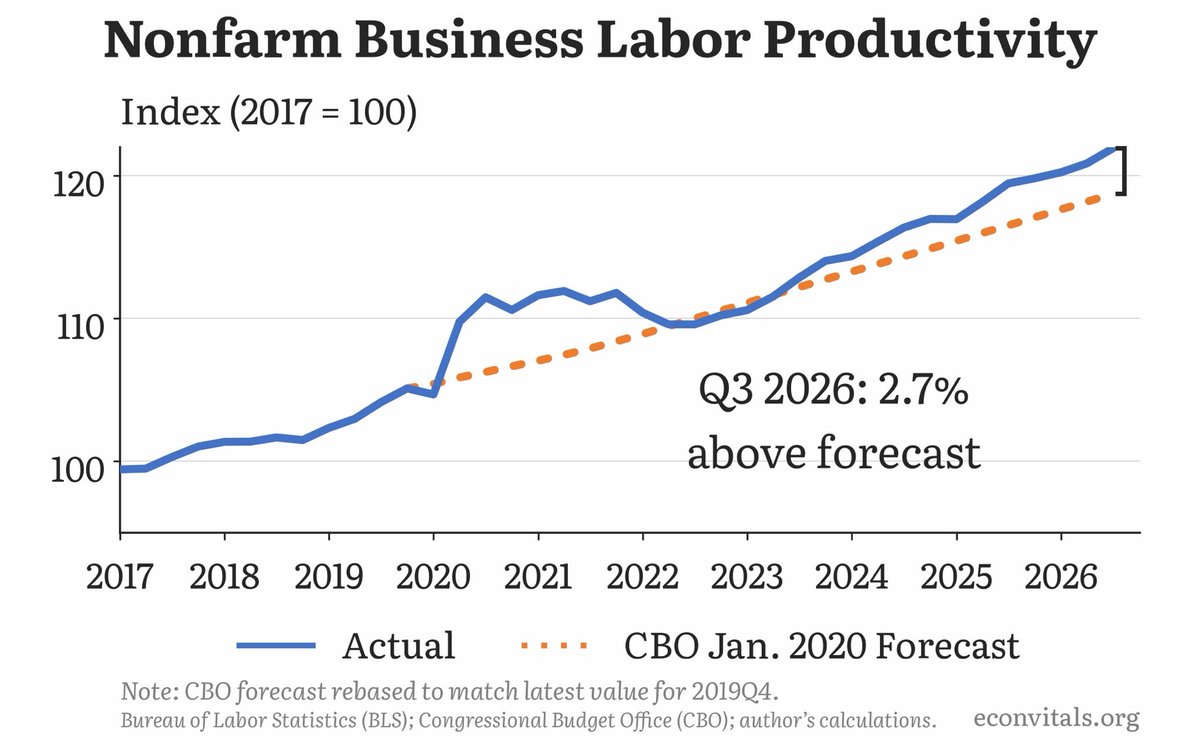
US nonfarm business labor productivity index (2017=100), actual vs CBO's Jan 2020 forecast | Q3 2026 sits 2.7% above the pre-pandemic path
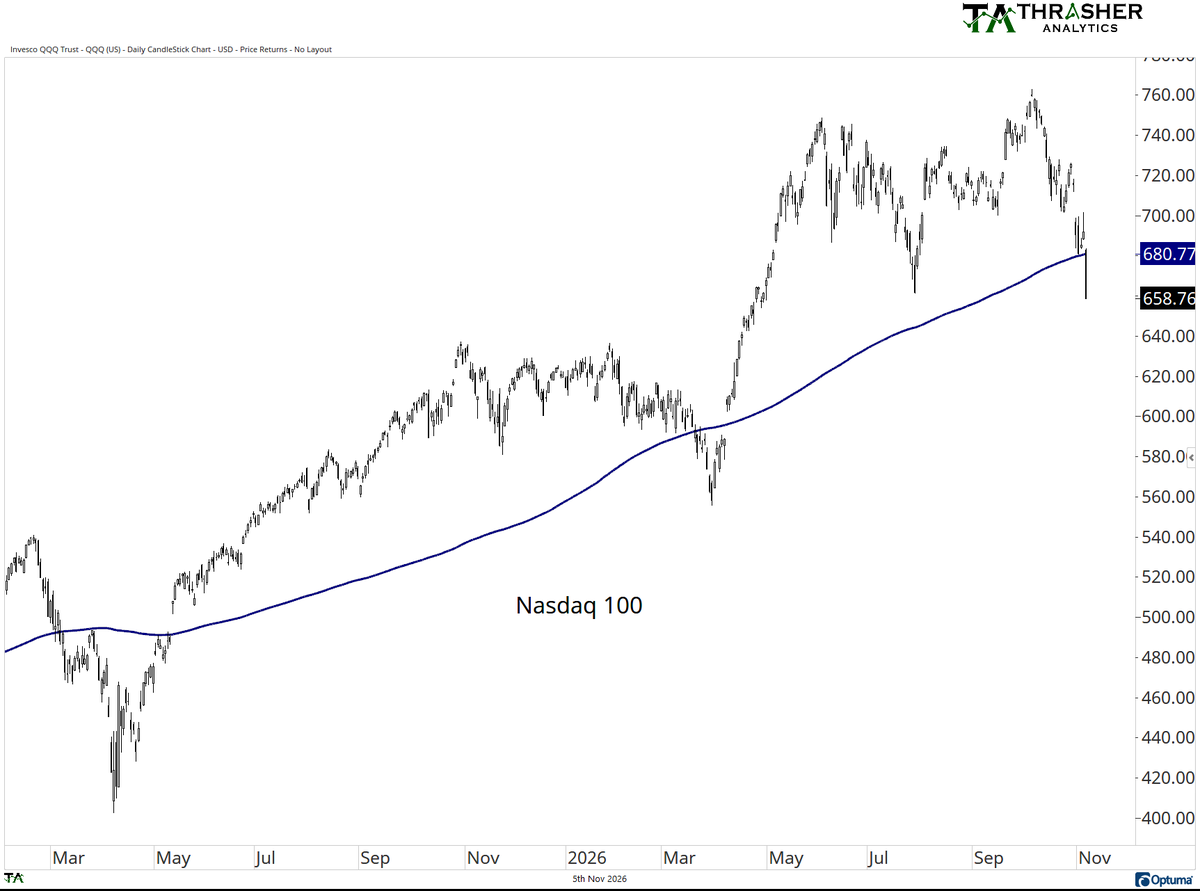
Nasdaq 100 daily price with 200-day moving average | First move under the 200-day since March, closing near 680.77
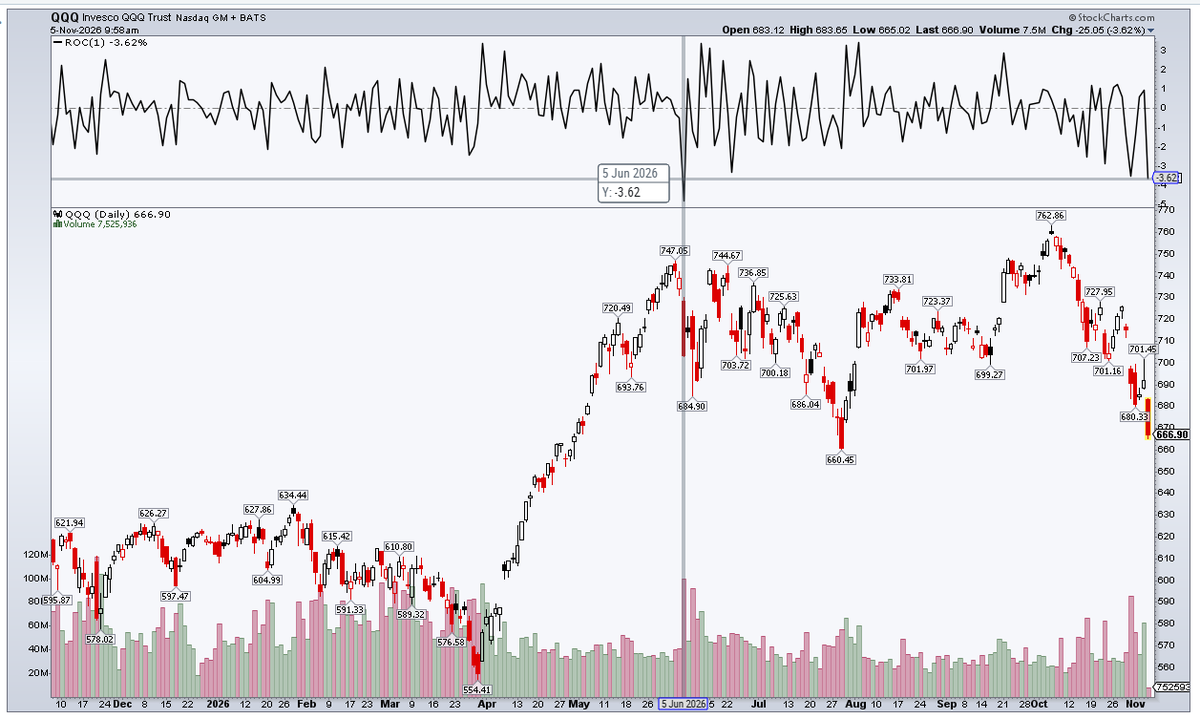
Invesco QQQ daily with 1-day rate-of-change and volume | Down 3.62% on the day to 666.90, the biggest drop since June 5
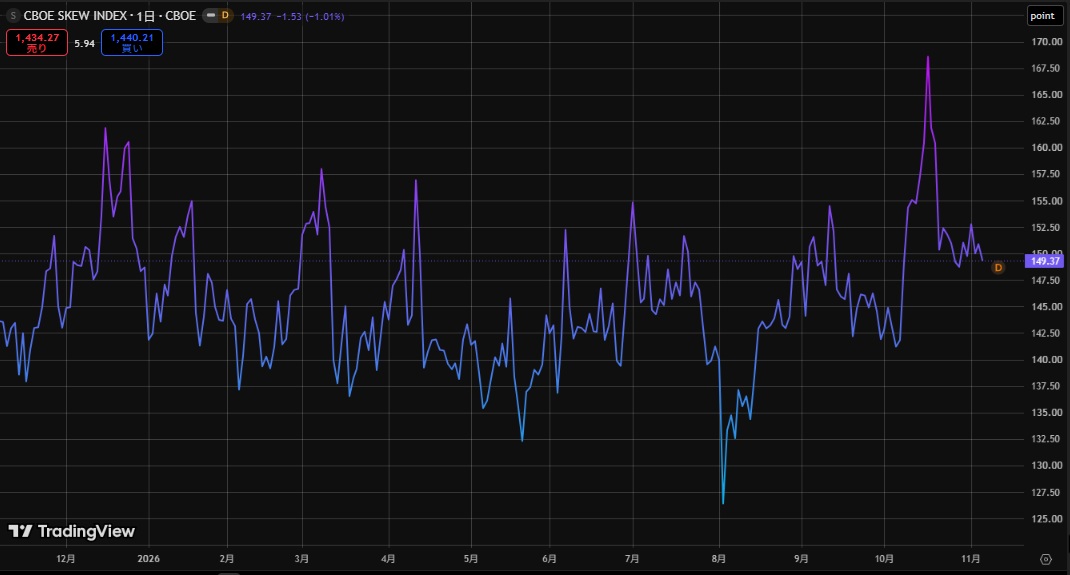
Cboe SKEW index, daily | Now at 149.37, down 1.01% on the day and below the mid-October peak above 168
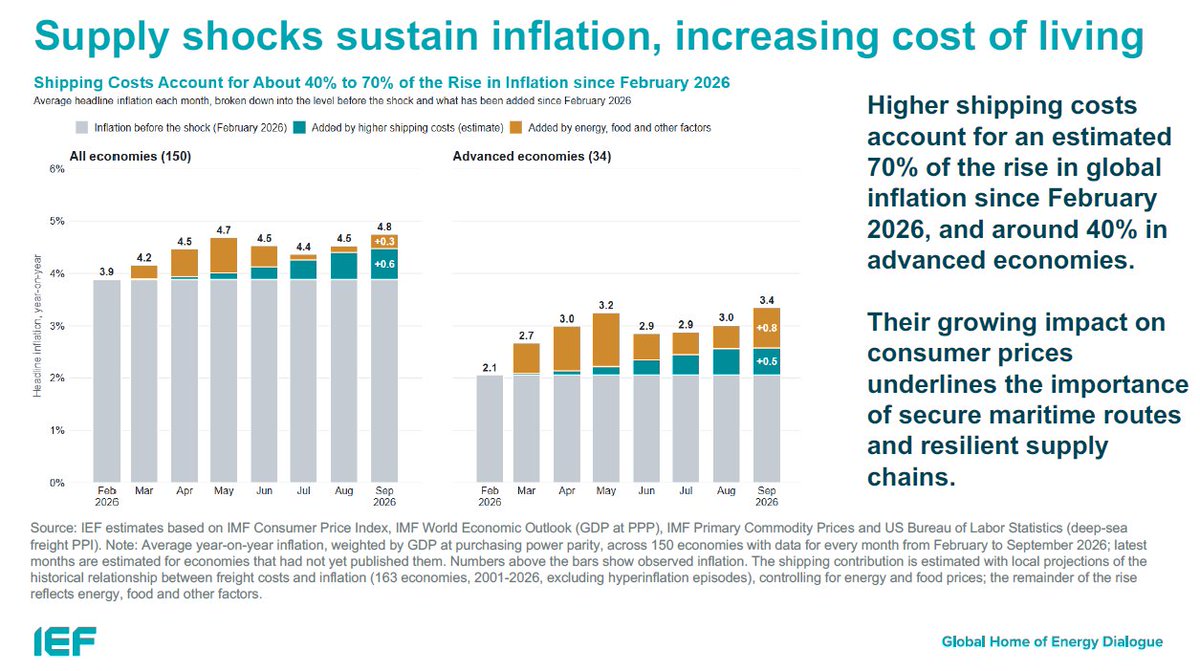
IEF decomposition of headline inflation, 150 economies and 34 advanced economies, Feb-Sep 2026 | Shipping costs account for about 70% of the rise since February globally and around 40% in advanced economies
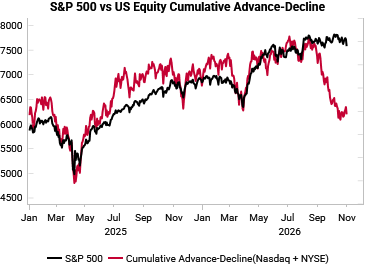
S&P 500 vs cumulative advance-decline line, NYSE+Nasdaq, 2025-2026 | Index near highs while the A-D line has rolled over since September, a clear breadth divergence
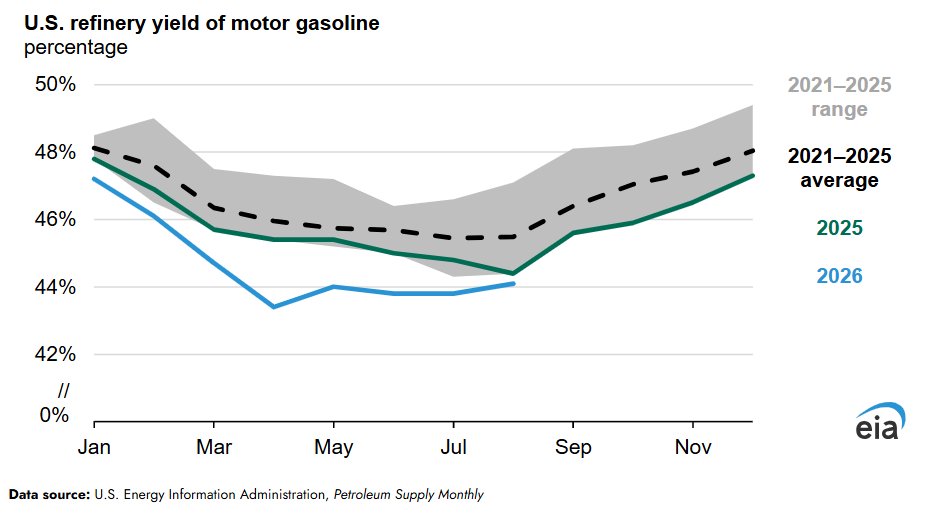
U.S. refinery yield of motor gasoline, %, seasonal, 2026 vs history | 2026 near 44% for much of the year, below the 2021-25 average of ~46% and the historical range
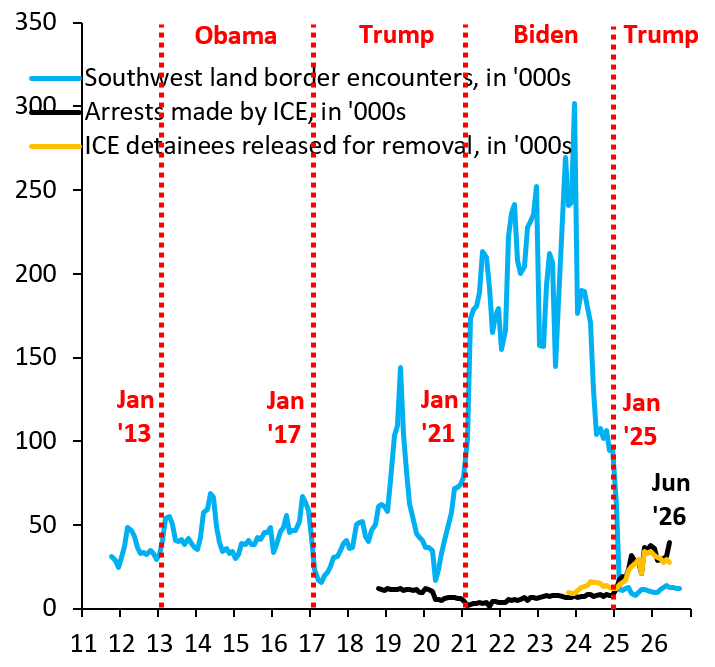
US southwest border encounters, ICE arrests and detainees released for removal, in thousands, 2011-2026 | Encounters fell from a 2024 peak above 300k to roughly 10-15k, while ICE arrests rose to about 40k by June 2026
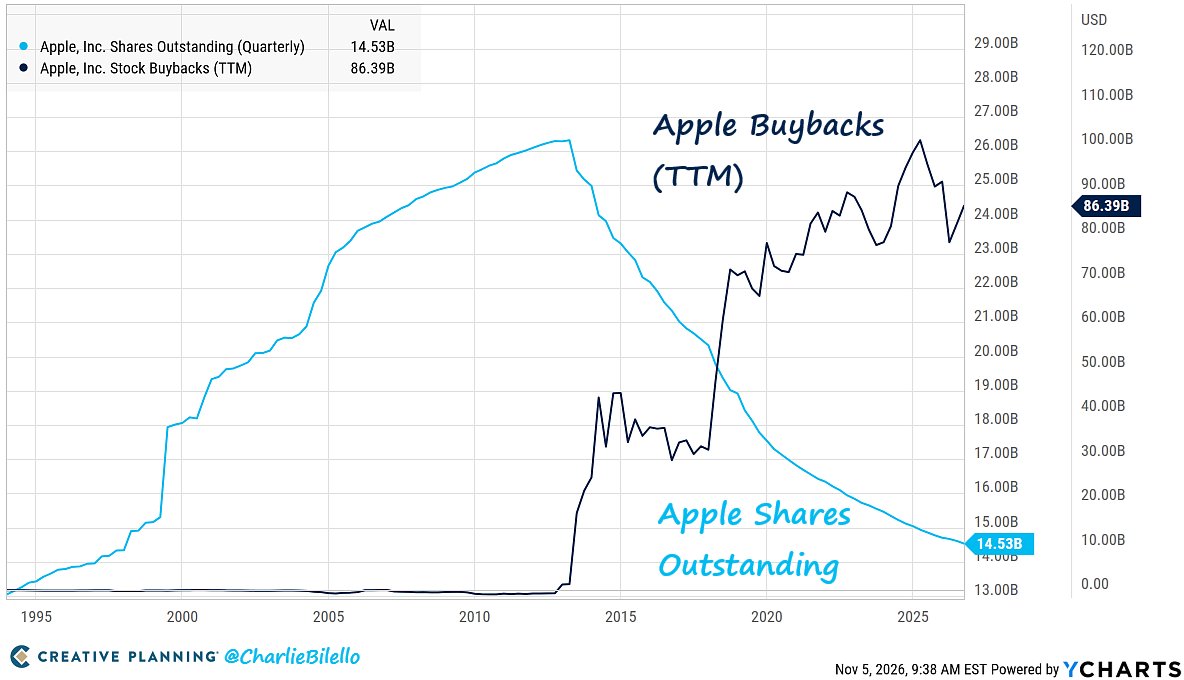
Apple shares outstanding (quarterly) and stock buybacks (TTM), 1995-2026 | Share count is down to 14.53B from a ~26B peak around 2013, with TTM buybacks of $86.39B
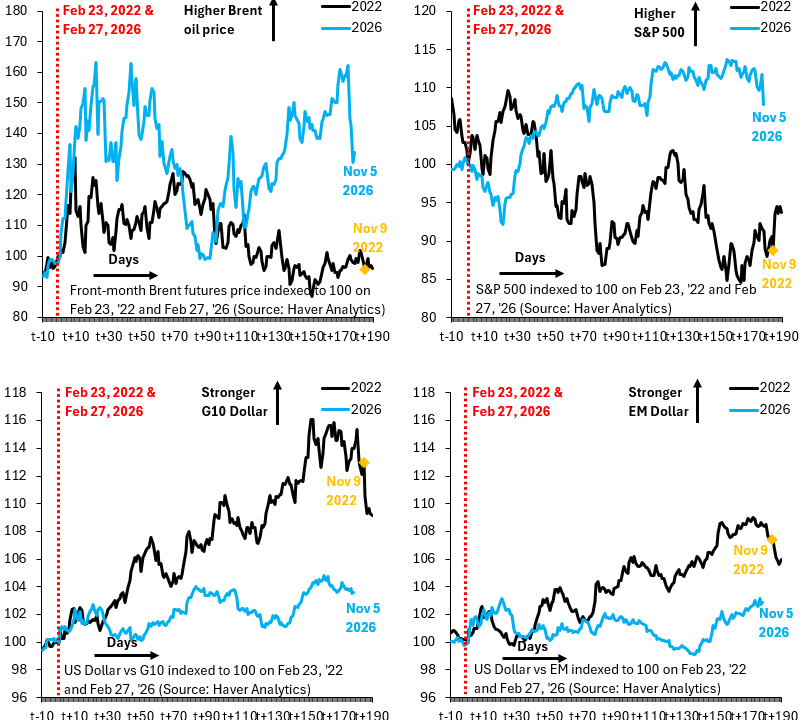
Brent, S&P 500 and the dollar indexed to 100 on Feb 23 '22 and Feb 27 '26 | By Nov 5, 2026 Brent and the S&P 500 sit higher than in 2022 while the dollar is weaker
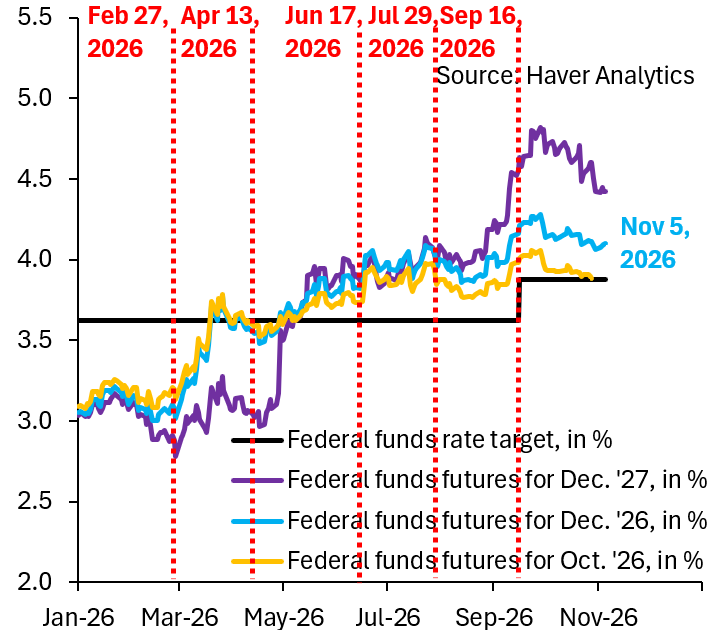
Fed funds rate target and futures (Dec '27 / Dec '26 / Oct '26), 2026 YTD | As of Nov 5, the Dec 2027 contract fell from ~4.8% to ~4.4%
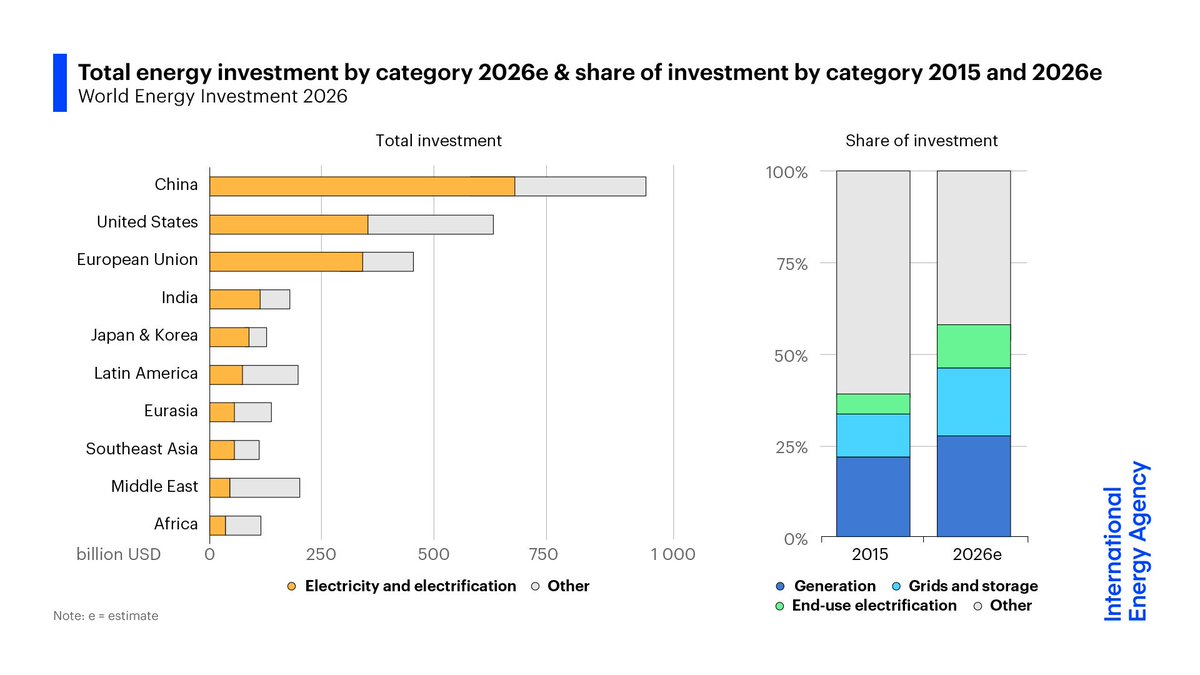
IEA energy investment by region and share by category, 2015 vs 2026e | Electricity-related investment climbs to about 60% of the total in 2026 from under 40% in 2015; China leads at roughly $950bn
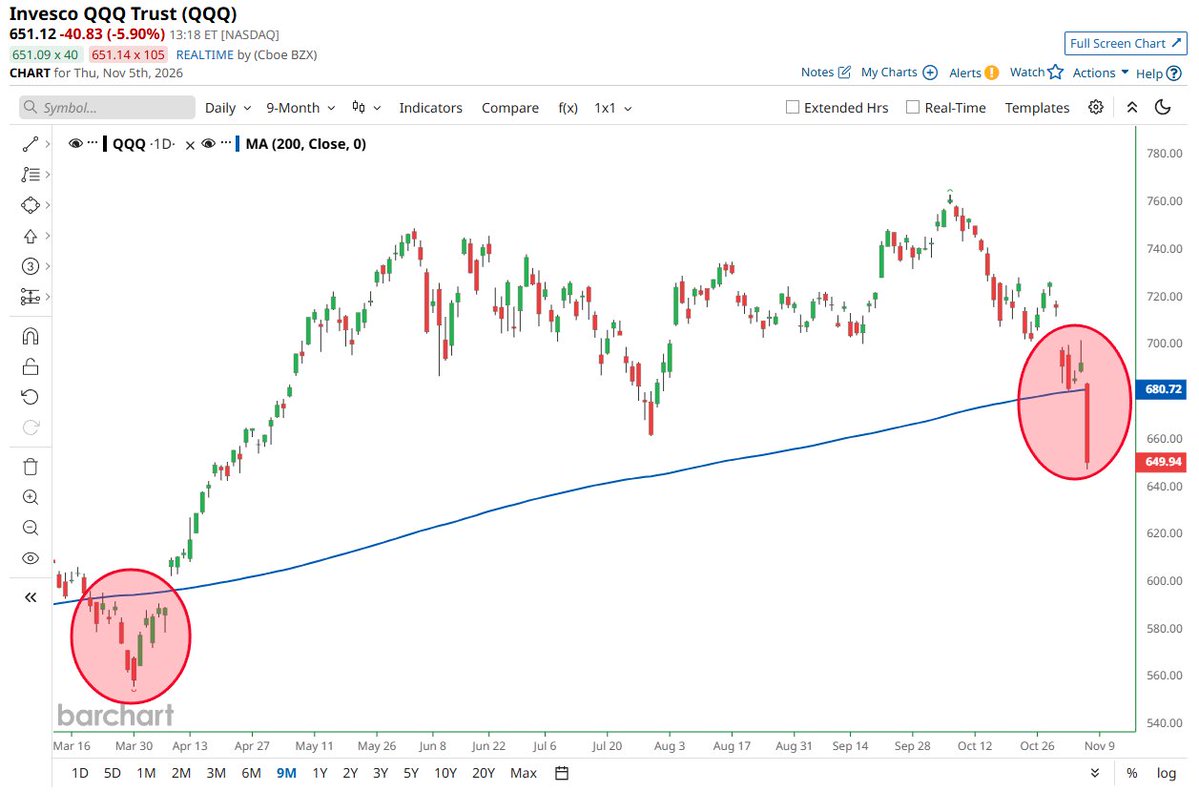
Invesco QQQ daily price with 200-day moving average | Last $651, down 5.9% on the day and now below its 200-day average
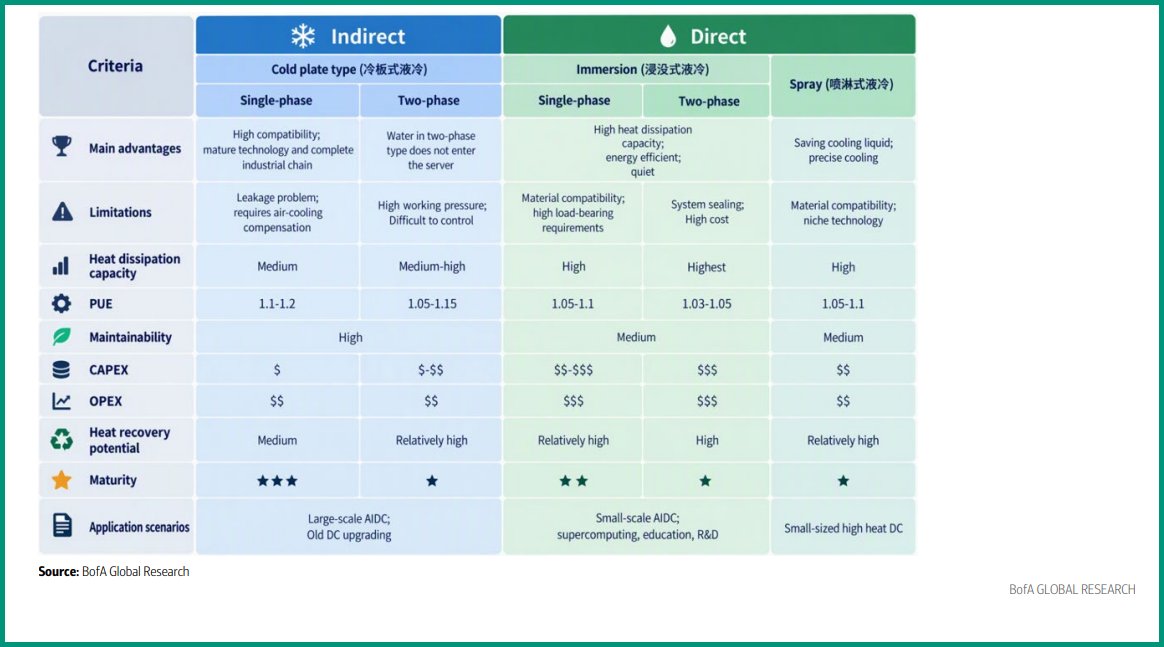
Cold-plate, immersion and spray liquid-cooling technologies compared | Two-phase immersion offers the highest heat dissipation and PUE as low as 1.03-1.05, while cold-plate has the most mature supply chain
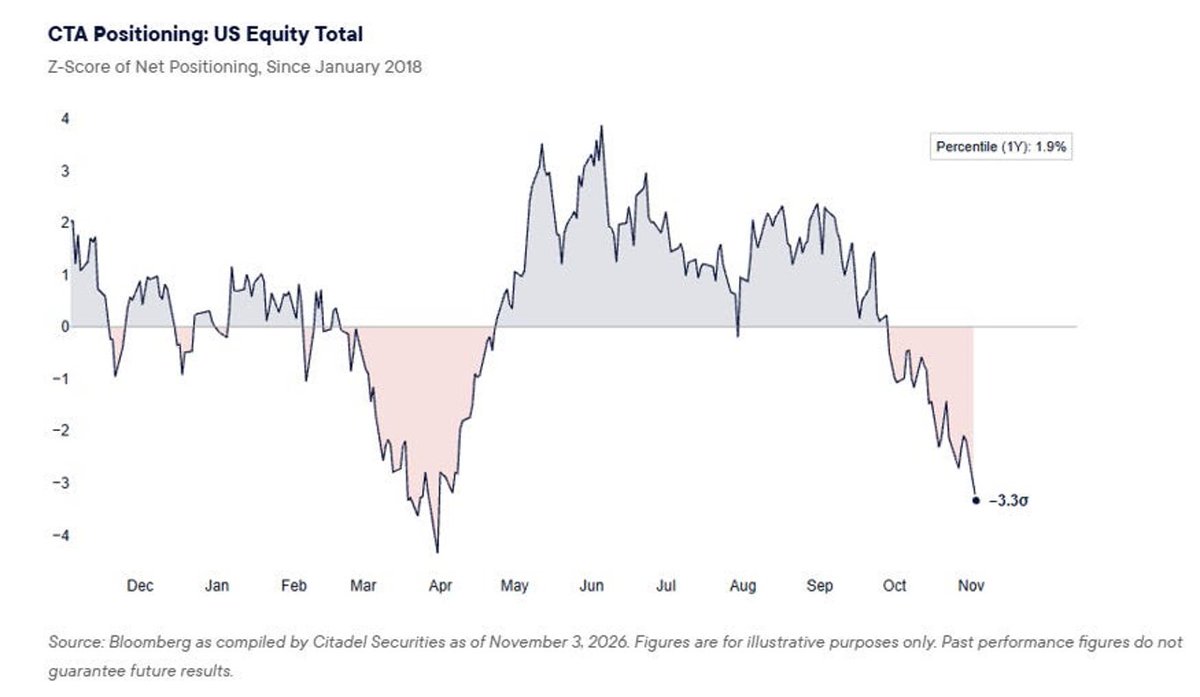
CTA net equity positioning Z-score since January 2018 | Now -3.3σ, in the 1.9th percentile over the past year and near the April low
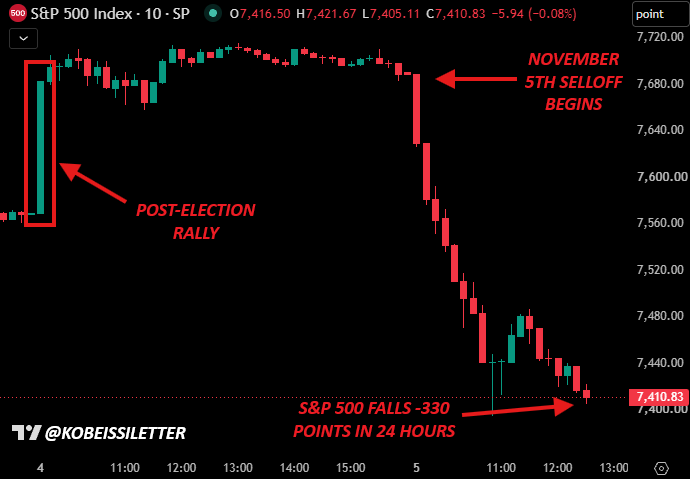
S&P 500 index, 10-minute candles | Down about 330 points to 7,410.83 in 24 hours, with the Nov 5 selloff wiping out the post-election rally
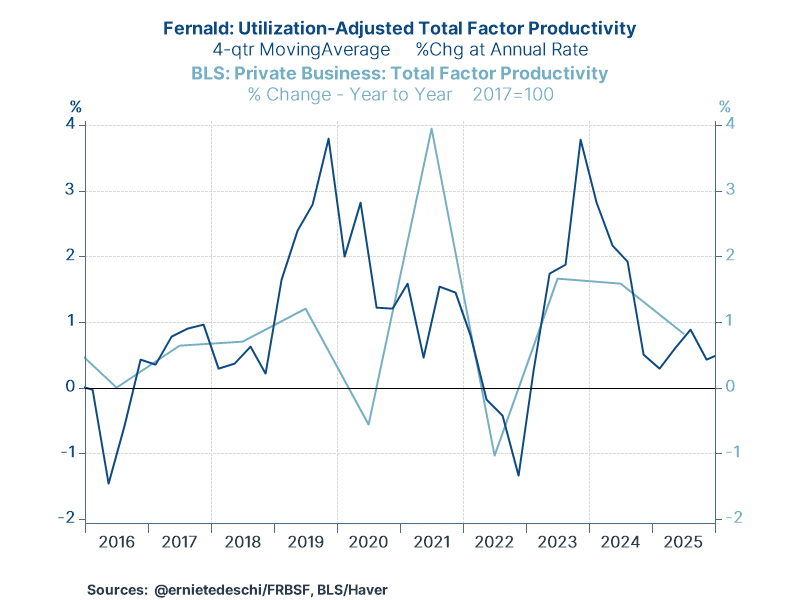
US total factor productivity growth, two estimates | Both the Fernald and BLS measures have eased recently to about 1% or below
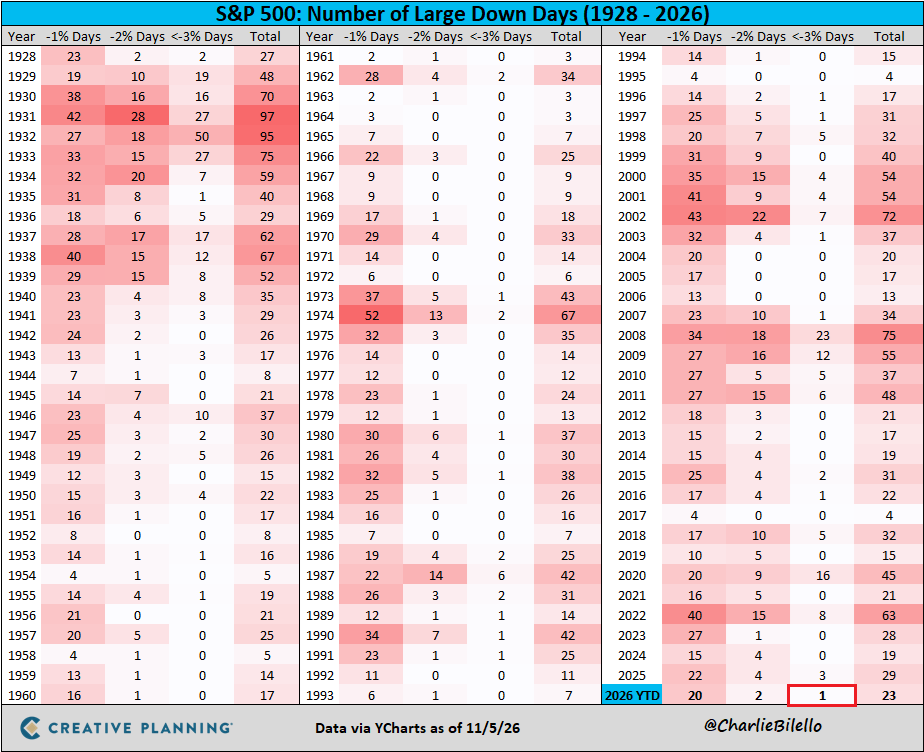
S&P 500 count of large down days by year, 1928-2026 | 2026 YTD has 20 days down 1%+ and just one down 3%+, 23 in total
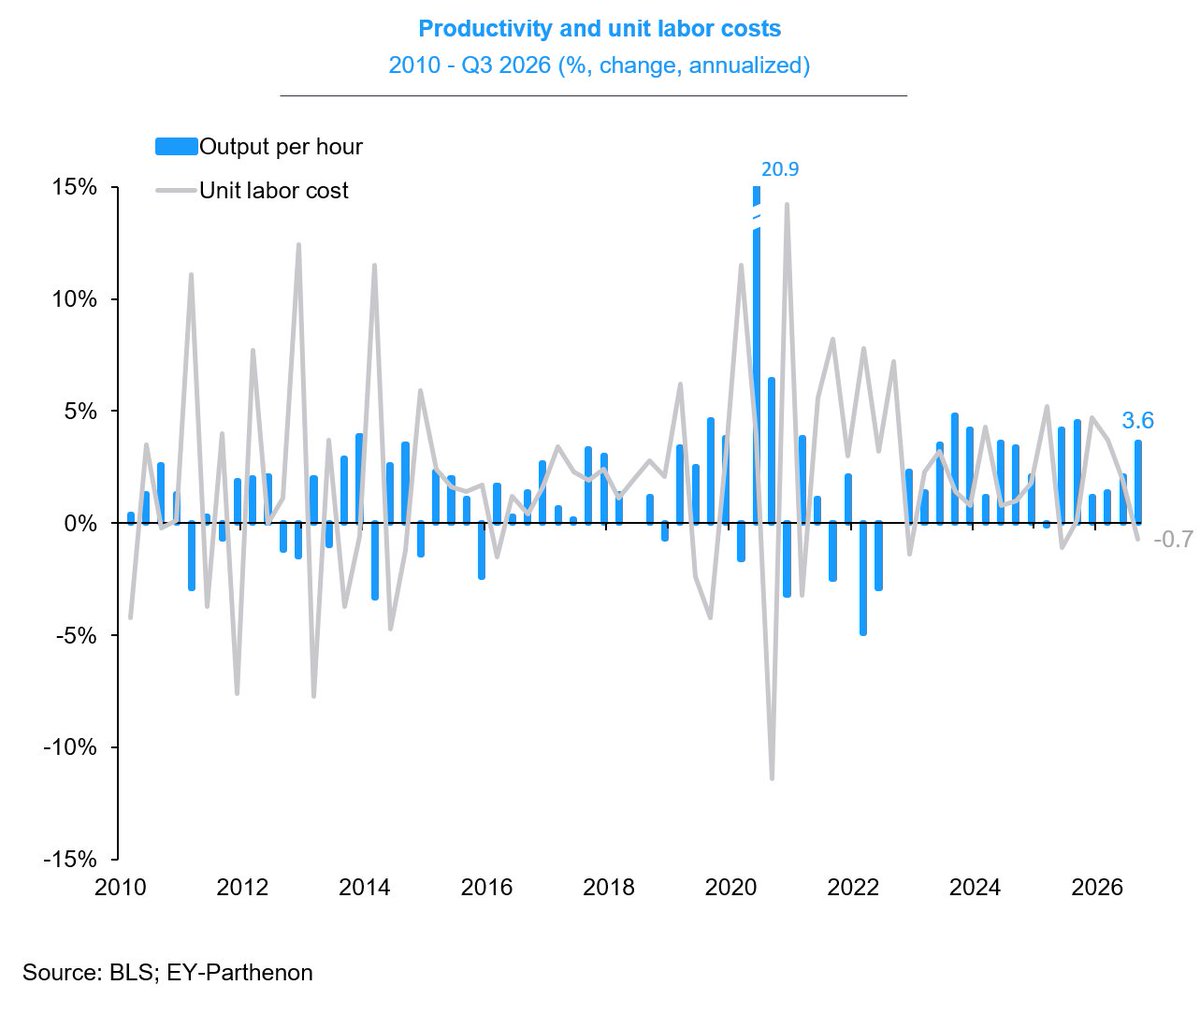
U.S. productivity and unit labor costs, SAAR, 2010-Q3 2026 | Q3 2026 output per hour +3.6% annualized as unit labor costs turned down 0.7%
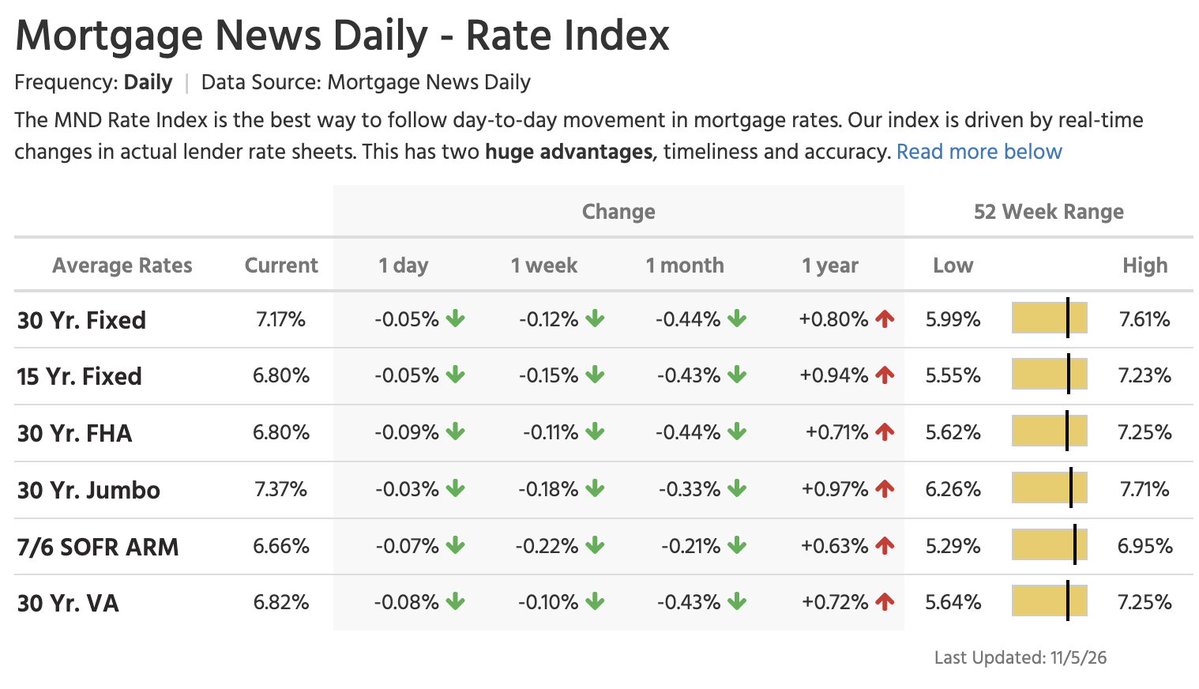
Average US mortgage rates by product with 52-week ranges (Mortgage News Daily) | 30-year fixed at 7.17%, down 0.44pp on the month but still 0.80pp above a year ago
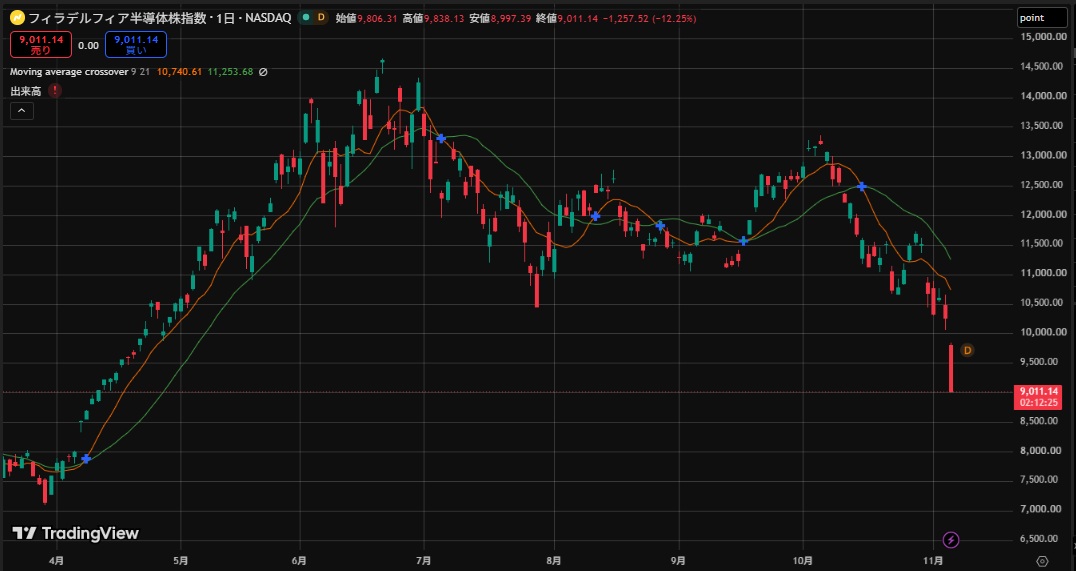
Philadelphia Semiconductor Index (SOX) daily chart | Closed at 9,011, down 1,257 points or about 12.25% on the day
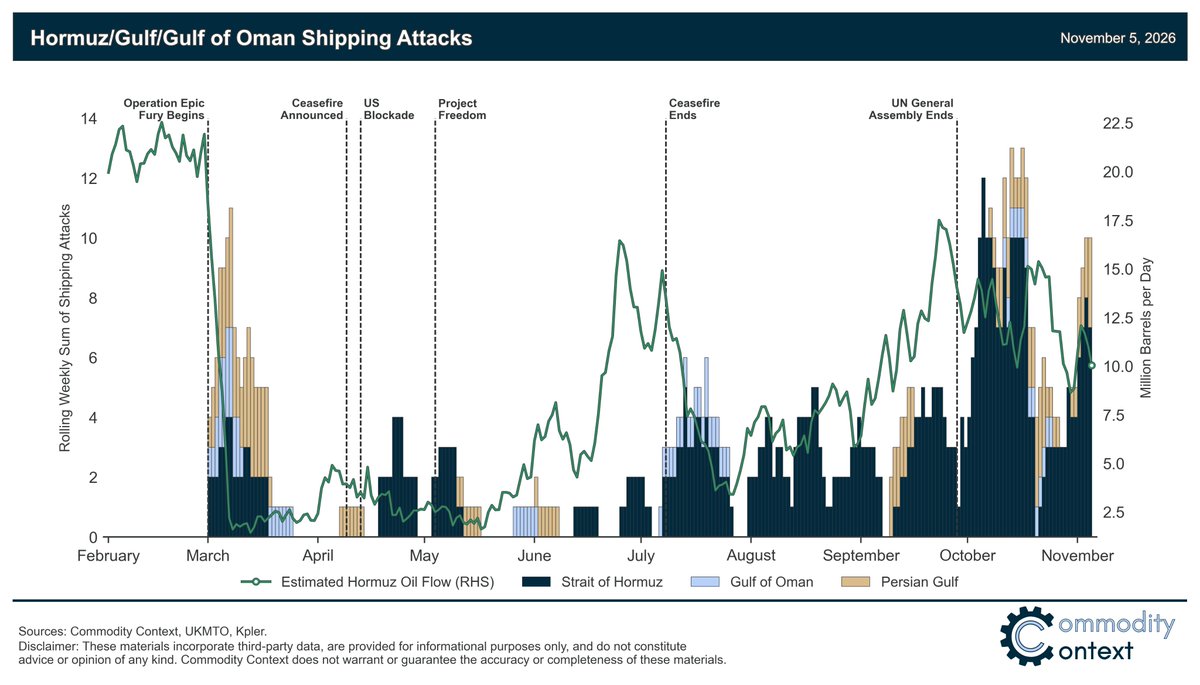
Hormuz/Gulf shipping attacks, rolling weekly sum, and estimated Hormuz oil flow, 2026 | Attacks re-escalated in October while estimated oil flow runs around 10 million barrels per day
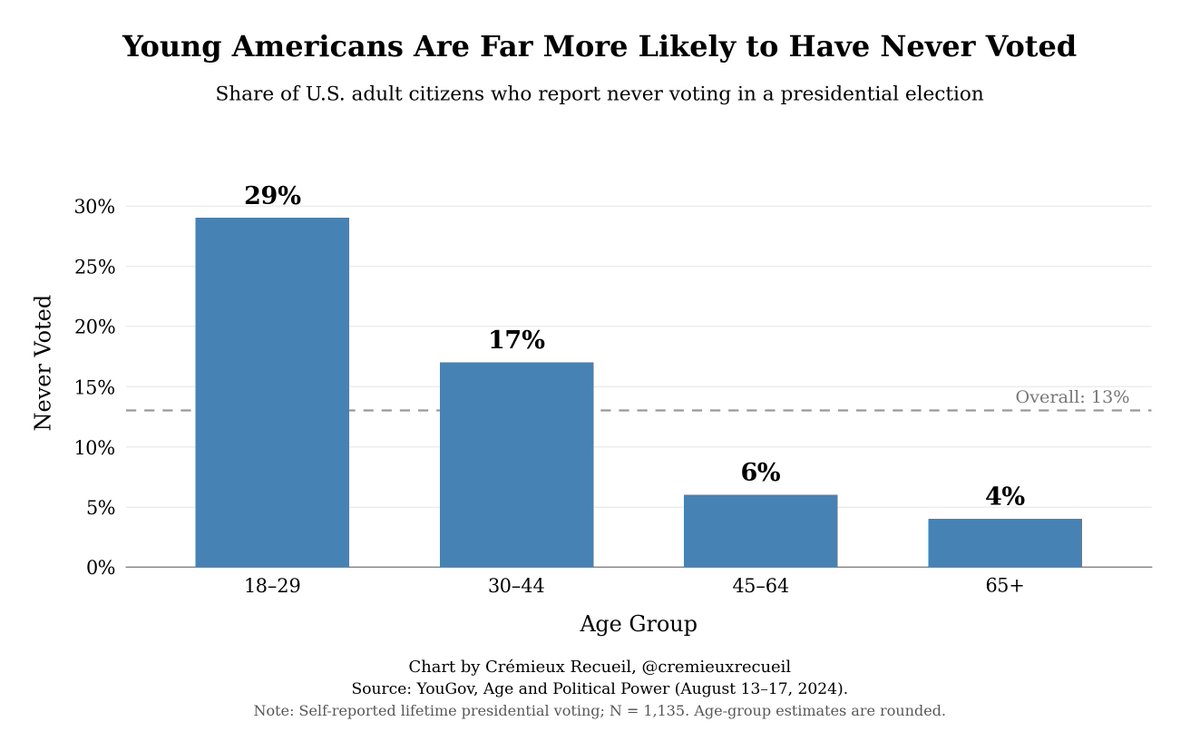
Share of US adult citizens who report never voting in a presidential election, by age | 29% among 18-29 vs 4% among 65+, with an overall rate of 13%
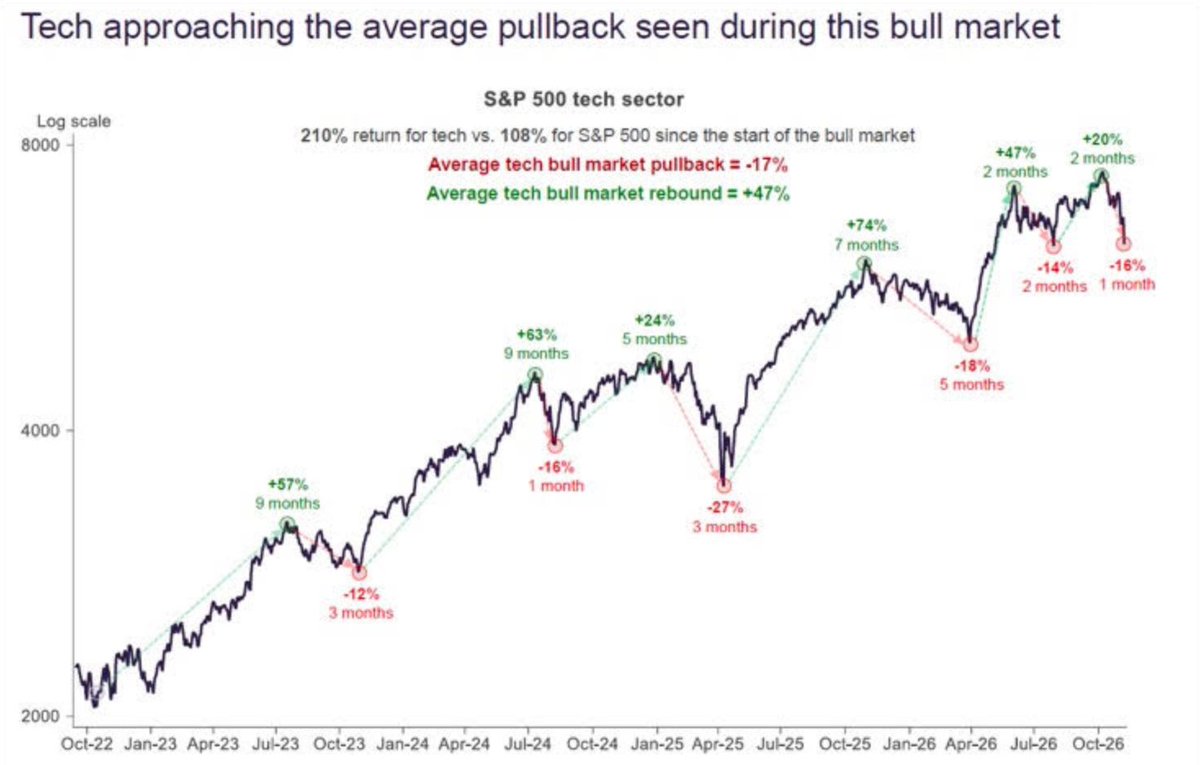
S&P 500 tech sector index, log scale, 2022-2026 | Current 16% drawdown over one month, close to the 17% average bull-market pullback
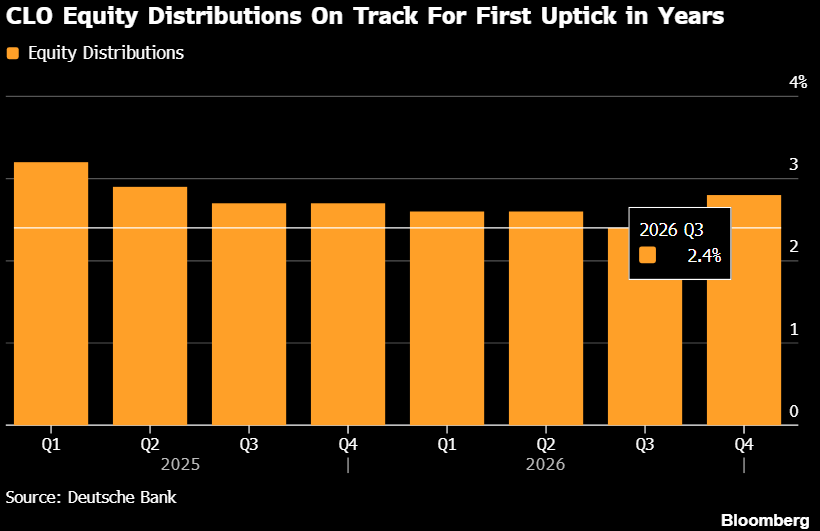
CLO equity distributions, quarterly %, 2025-2026 | Q3 2026 around 2.4% and Q4 up to about 2.7%, the first upturn in years
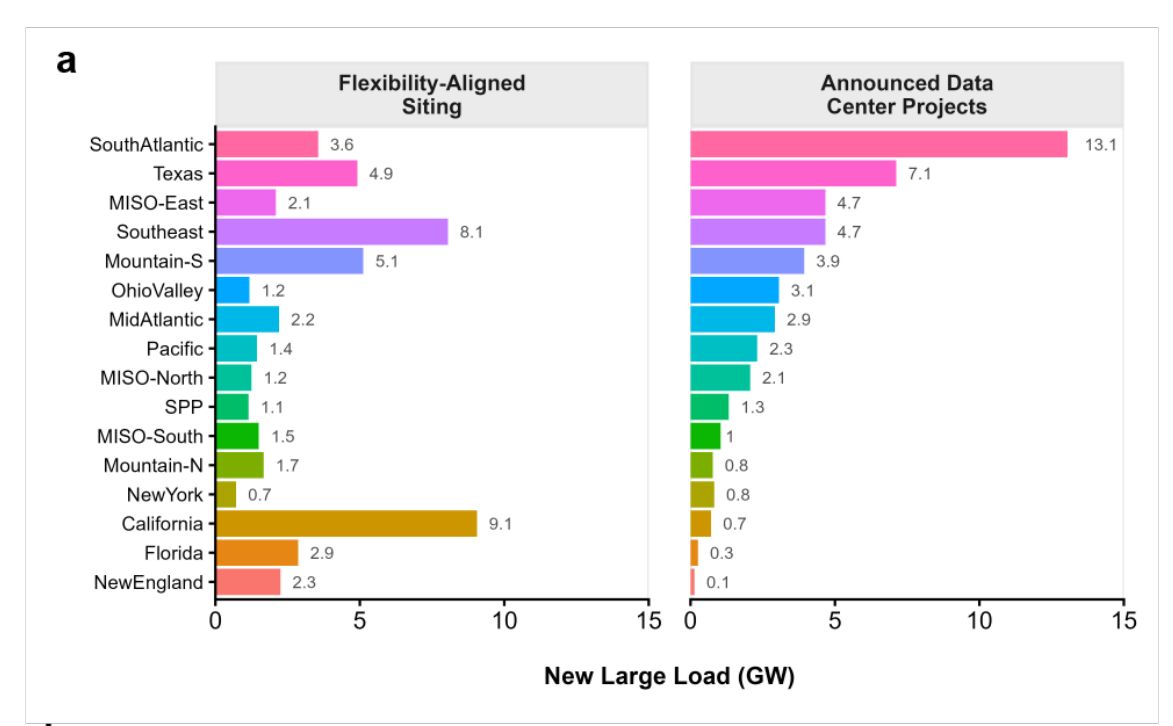
New large electricity load (GW) by region: headroom-aligned siting vs announced data centers | South Atlantic shows 13.1 GW announced but only 3.6 GW by headroom
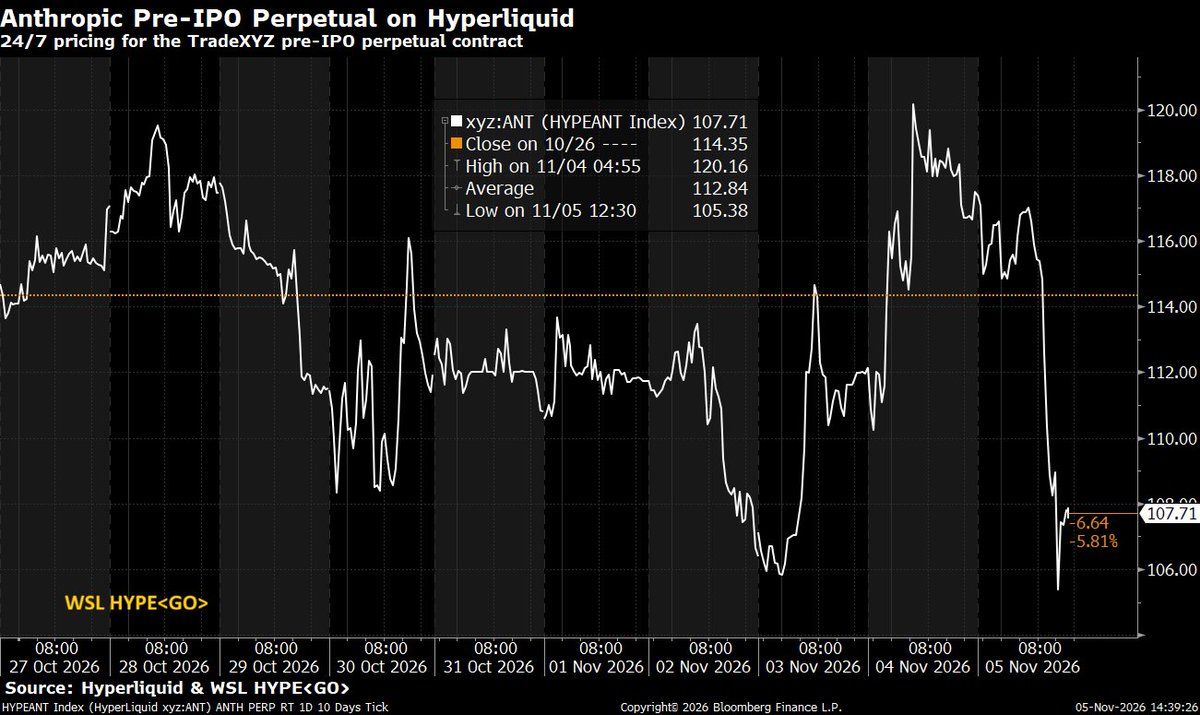
Anthropic pre-IPO perpetual price on Hyperliquid, 10-day tick | Now 107.71, down 5.81% on the day from a Nov 4 high of 120.16
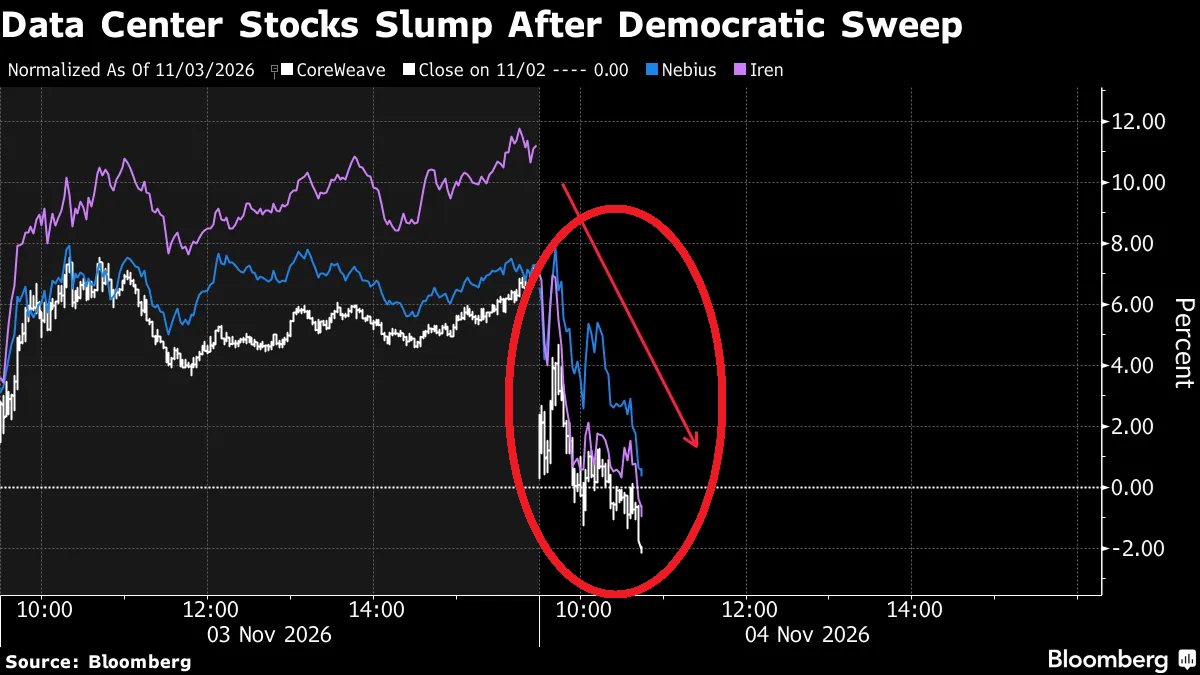
Data-center stocks normalized to the 11/02 close, 11/03-04 | CoreWeave, Nebius and Iren fell from intraday gains of +6% to +11% to about 0% to -2%
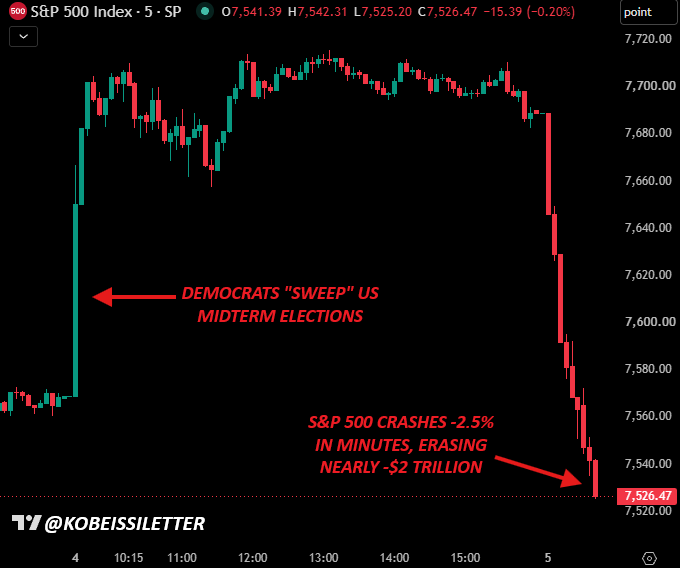
S&P 500, 5-minute chart | A late-session drop of ~2.5% in minutes wiped out nearly $2T, with the index closing around 7,526
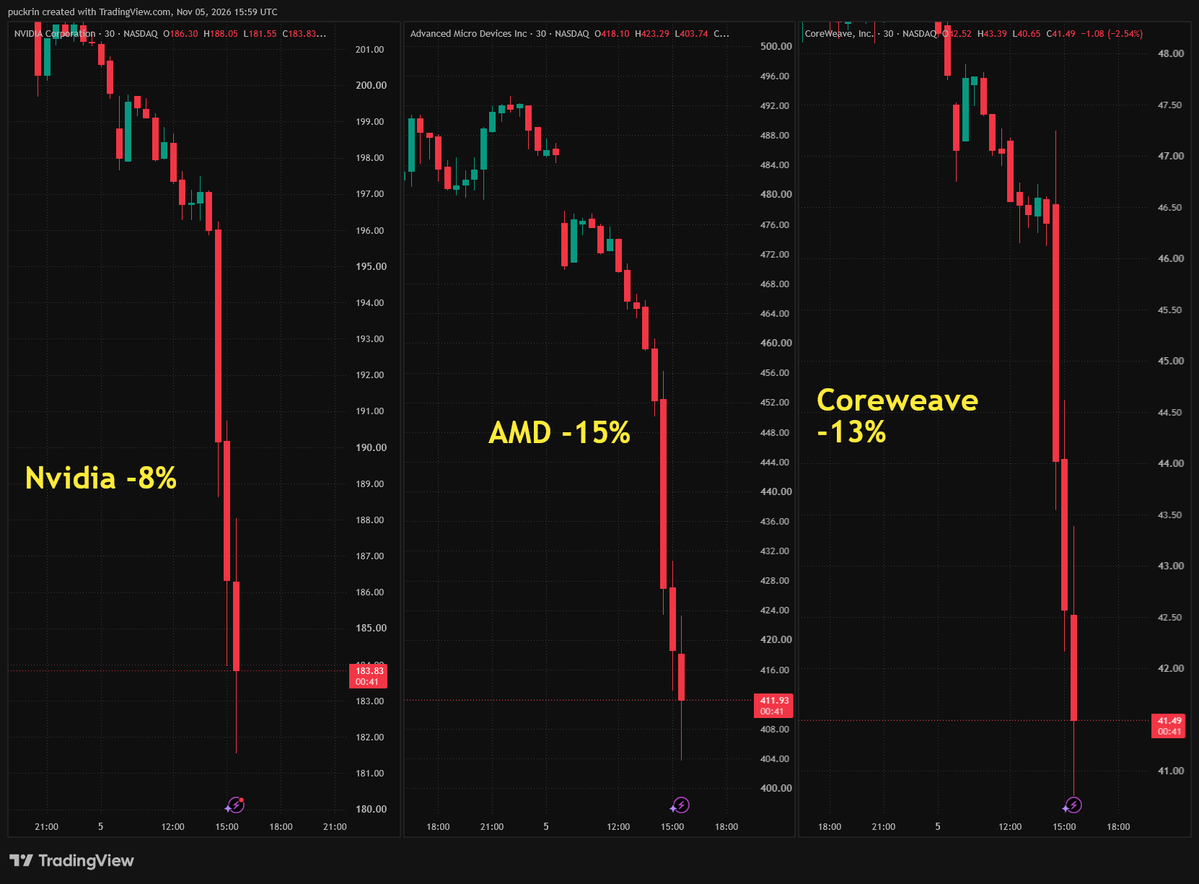
Nvidia, AMD and CoreWeave 30-minute charts, three panels | On the day Nvidia -8% to 183.83, AMD -15% to 411.93, CoreWeave -13% to 41.49
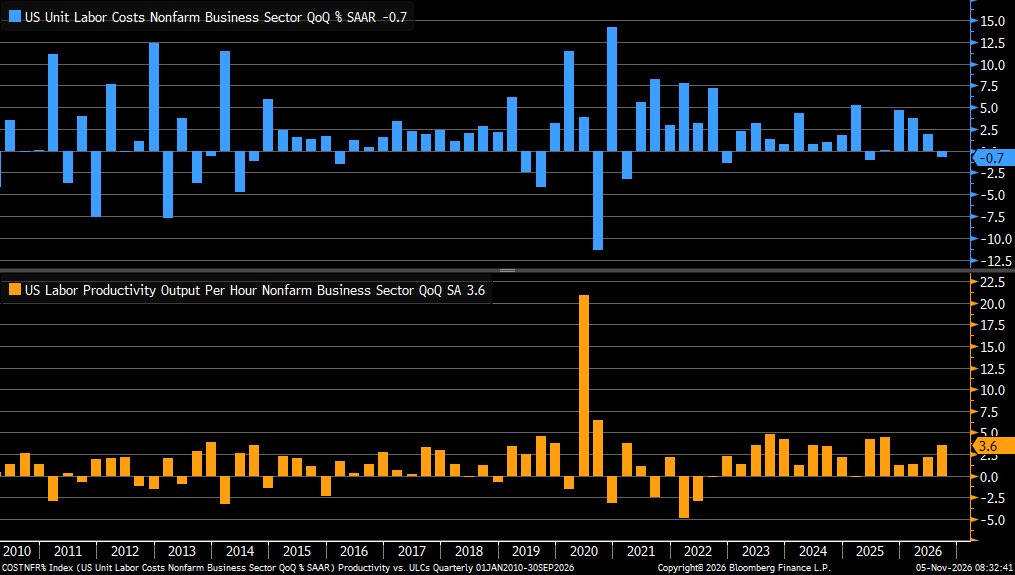
US unit labor costs (top) and nonfarm productivity (bottom), QoQ annualized, 2010-2026 | Q3 unit labor costs -0.7% (prior +1.9%), productivity +3.6% (prior +2.1%)
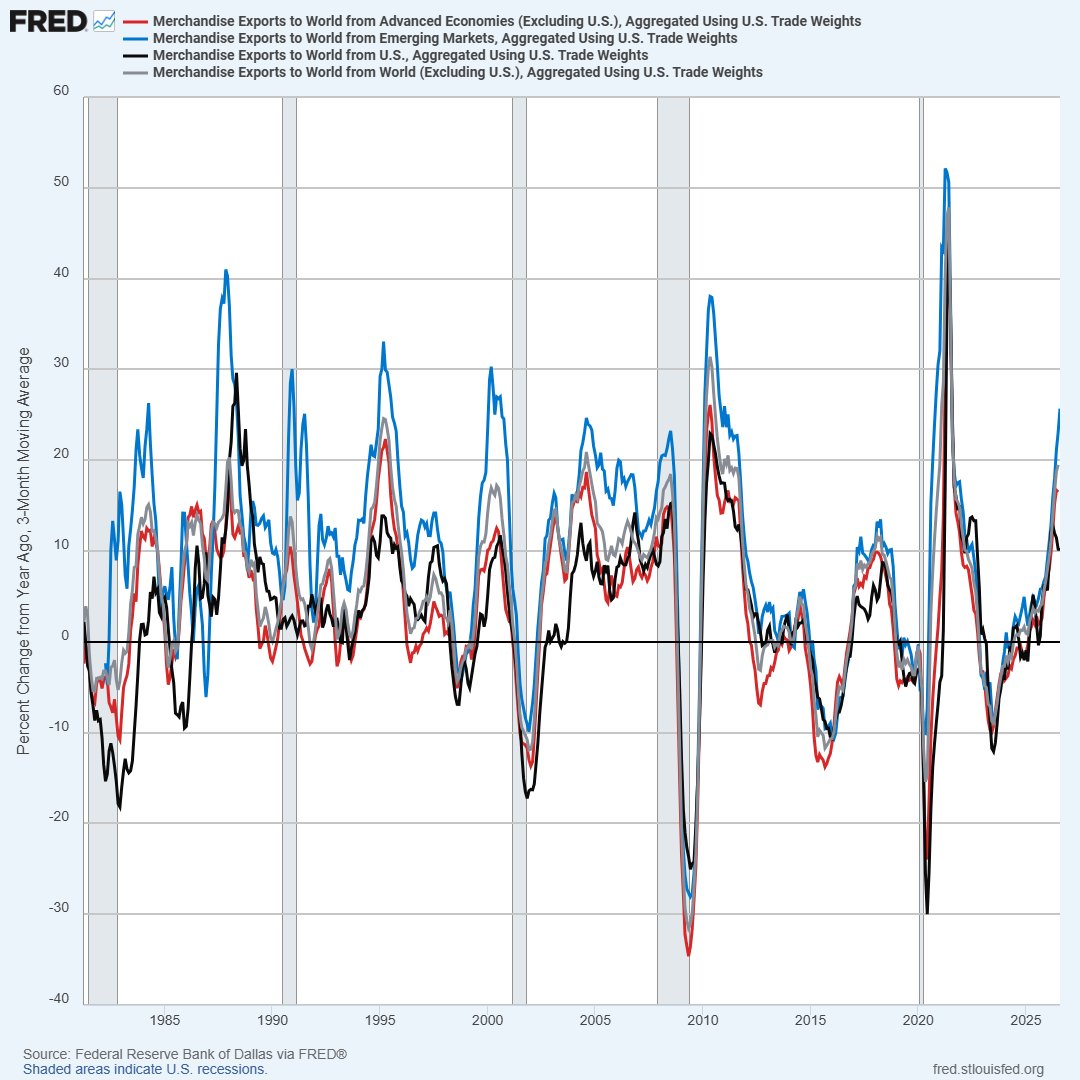
Merchandise export growth, YoY 3-month MA by region, 1982-2026 | Emerging-market exports up ~25% YoY, ahead of advanced economies, the U.S. and the world
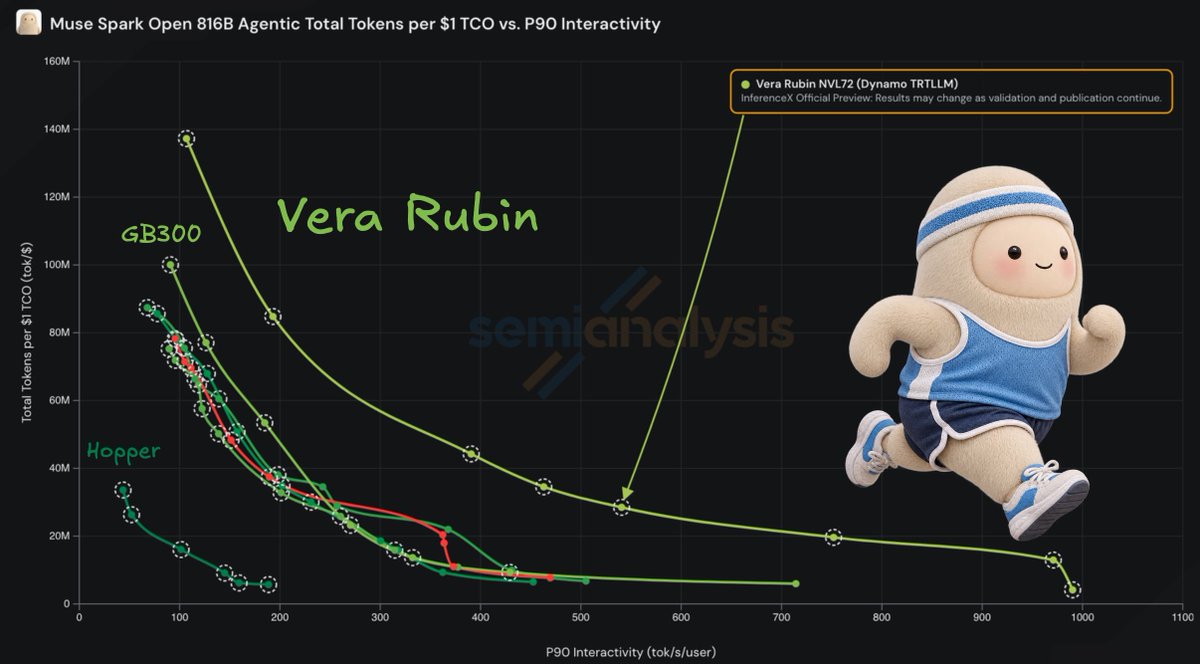
AI inference tokens per $1 TCO vs. P90 interactivity | The Vera Rubin curve sits above GB300 and Hopper, peaking near 137M tokens per $1 at low interactivity
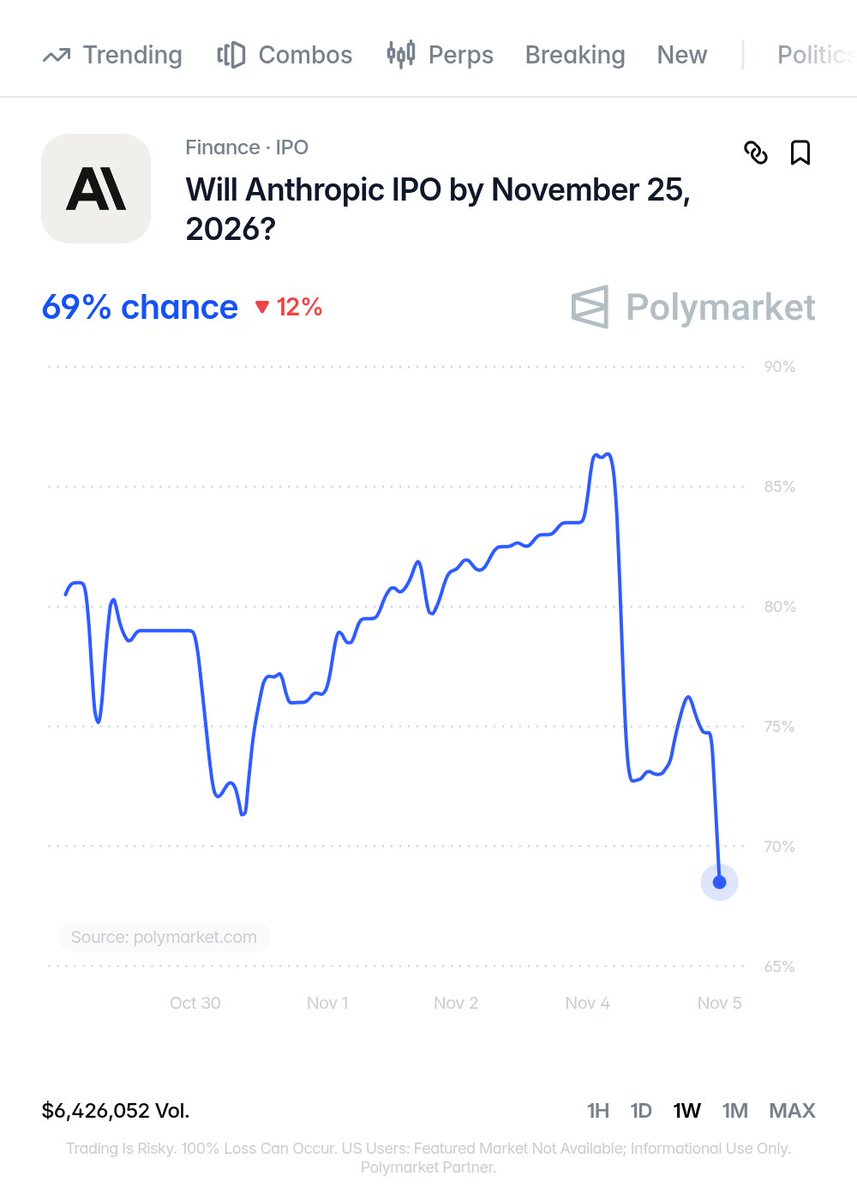
Polymarket-implied odds Anthropic IPOs before 2026-11-25 | Now 69%, down sharply from a ~87% high on Nov 4
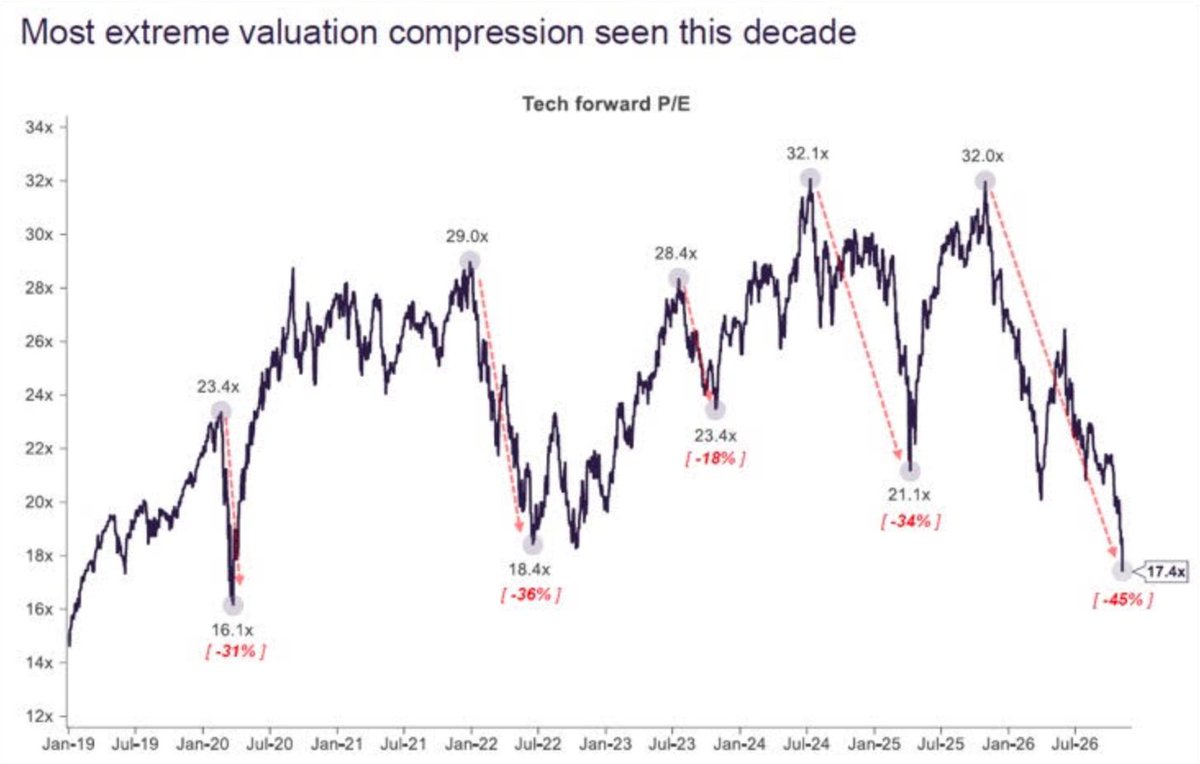
Tech sector forward P/E, 2019-2026 | Now 17.4x, a 45% compression from the 32.0x peak and the steepest of the decade
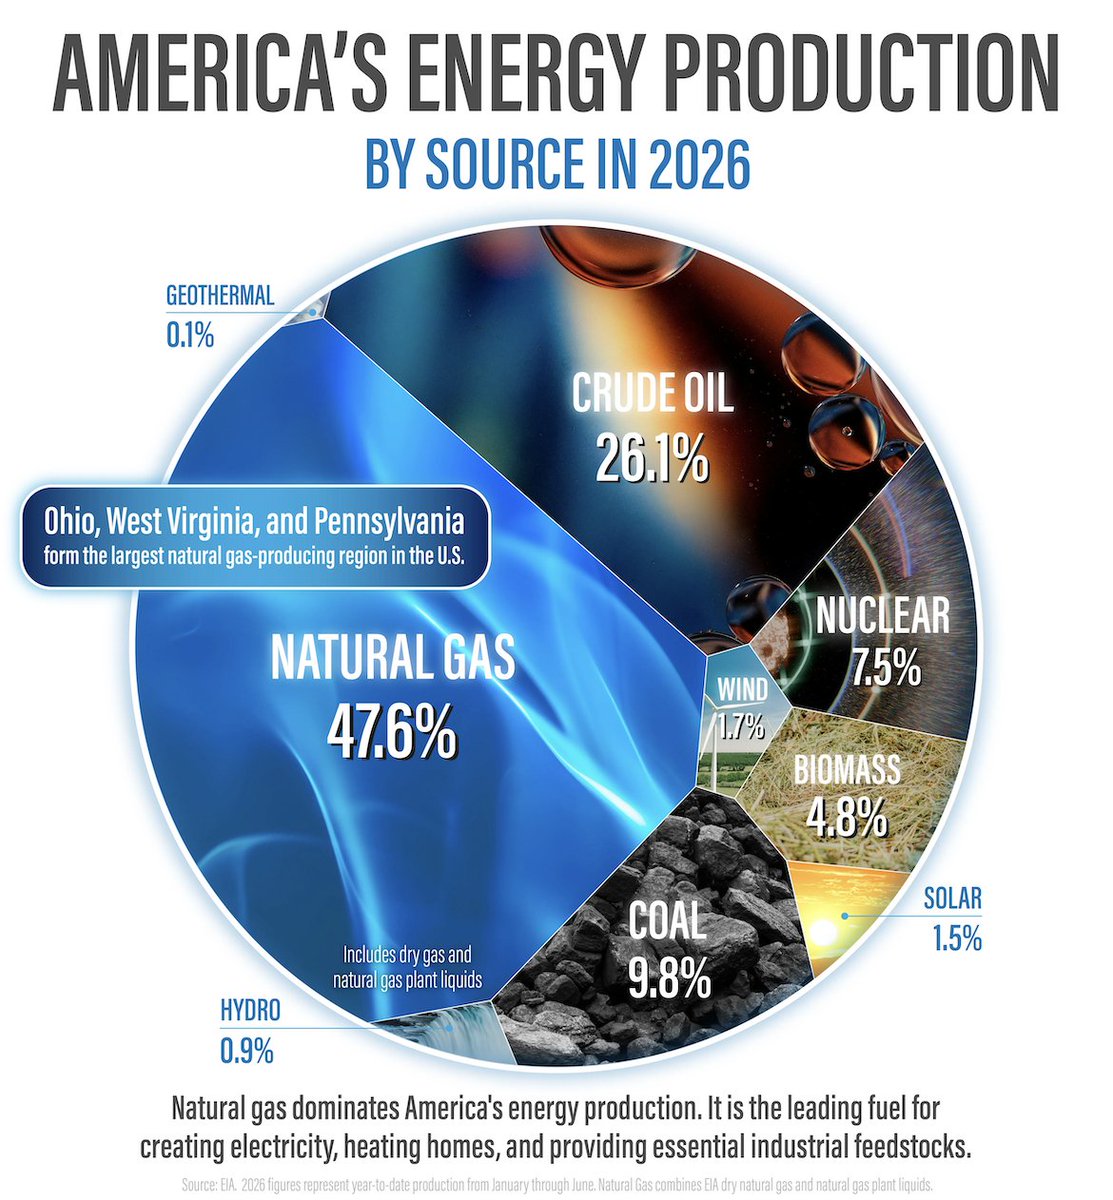
Share of U.S. energy production by source, %, H1 2026 | Natural gas 47.6% and crude oil 26.1%, together nearly three-quarters of the total
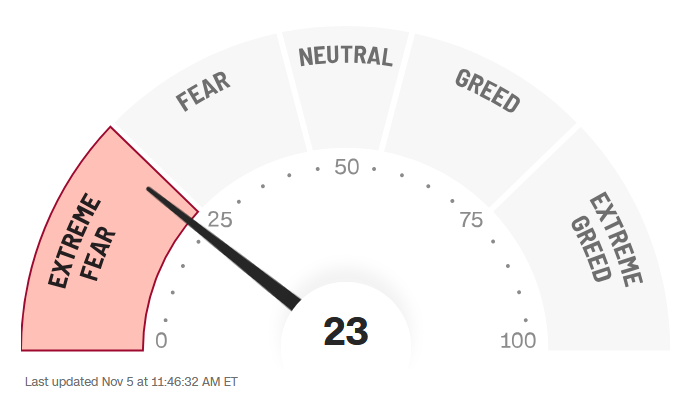
CNN Fear & Greed Index (0-100), live reading | Now 23, within the 'Extreme Fear' zone (0-25), signaling weaker sentiment
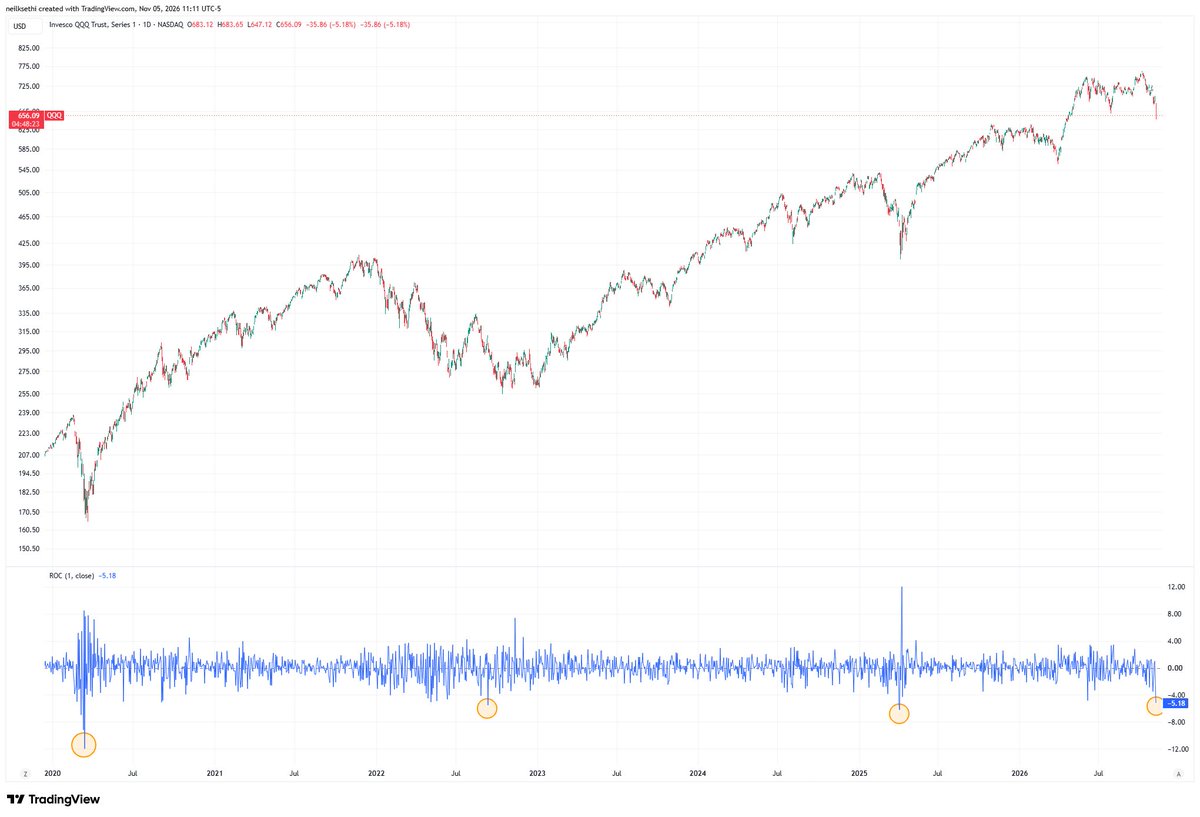
Invesco QQQ (Nasdaq-100) daily price and 1-day rate of change, 2020-2026 | Down ~5% today, the largest since April, on par with 2020 and 2022
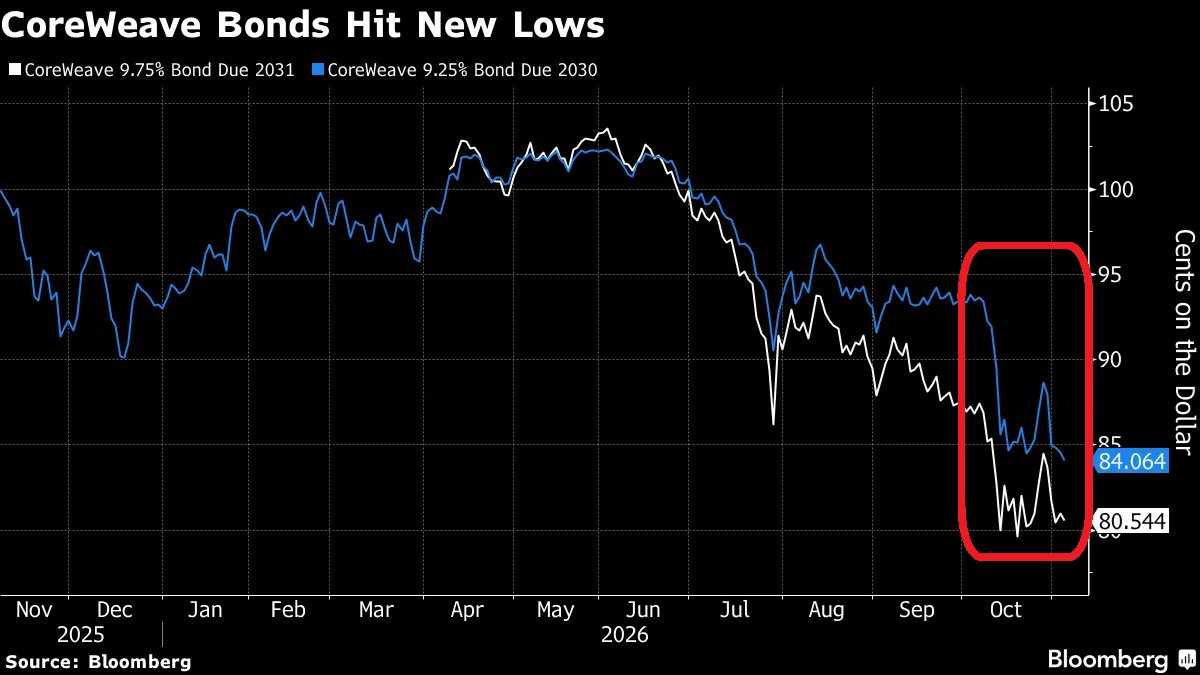
CoreWeave corporate bonds, cents on the dollar, 2025-2026 | The 9.75% 2031 note has dropped to 80.544 and the 9.25% 2030 note to 84.064, both at new lows
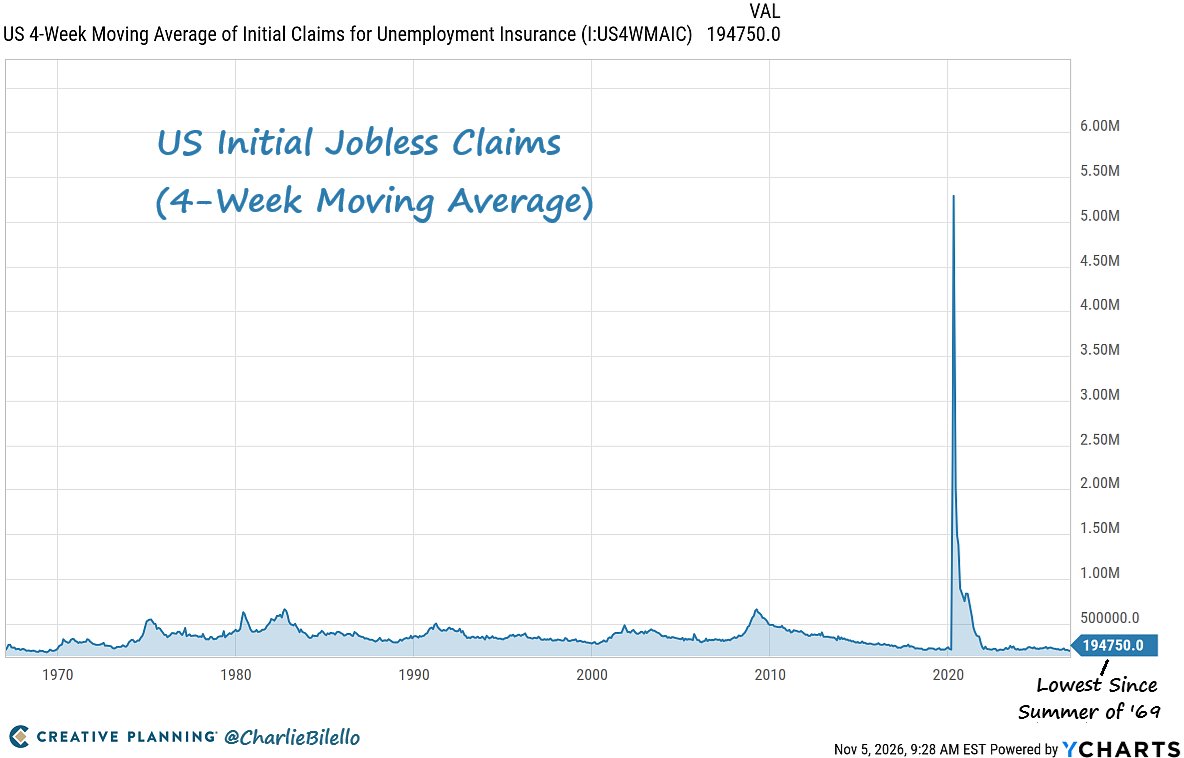
US initial jobless claims, 4-week moving average, 1970-2026, YCharts | Latest 194,750, the lowest since summer 1969, far from the 5M+ spike of 2020
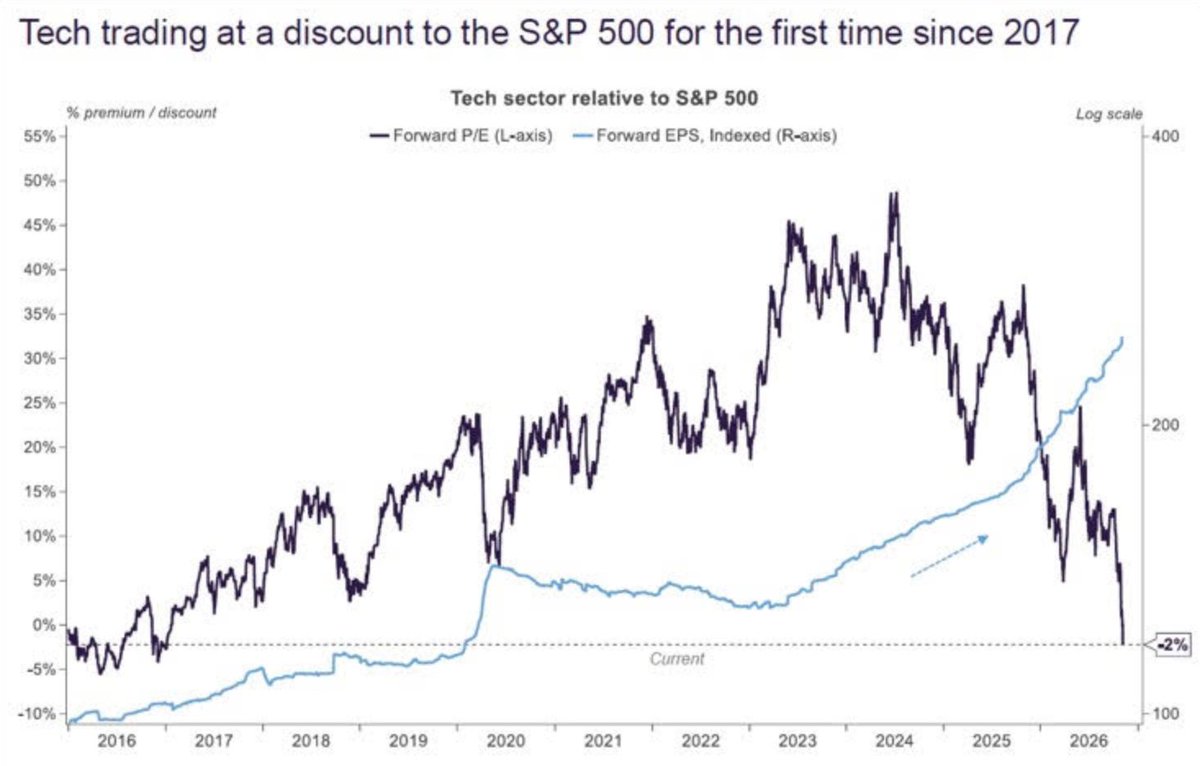
Tech sector relative to the S&P 500, forward P/E premium/discount and indexed forward EPS, 2016-2026 | The forward P/E is now a 2% discount, the first since 2017, while forward EPS keeps hitting new highs
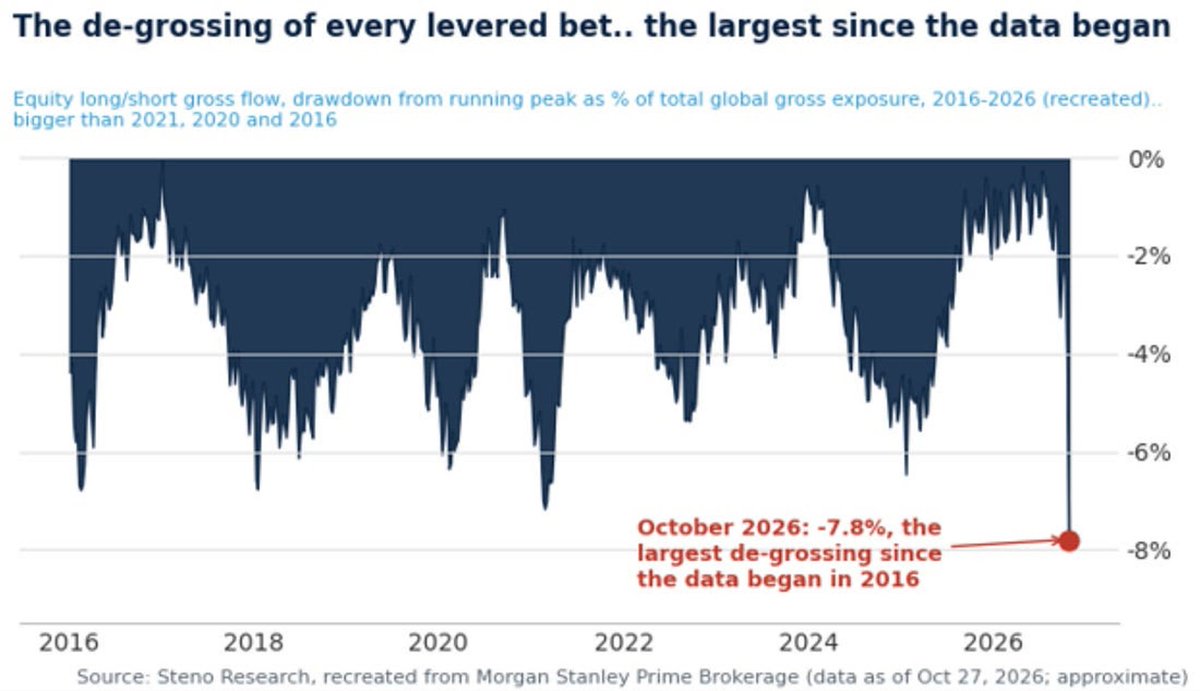
Equity L/S gross-exposure drawdown from peak, %, 2016-2026 | October 2026 drawdown of 7.8%, the biggest de-grossing since the data started in 2016
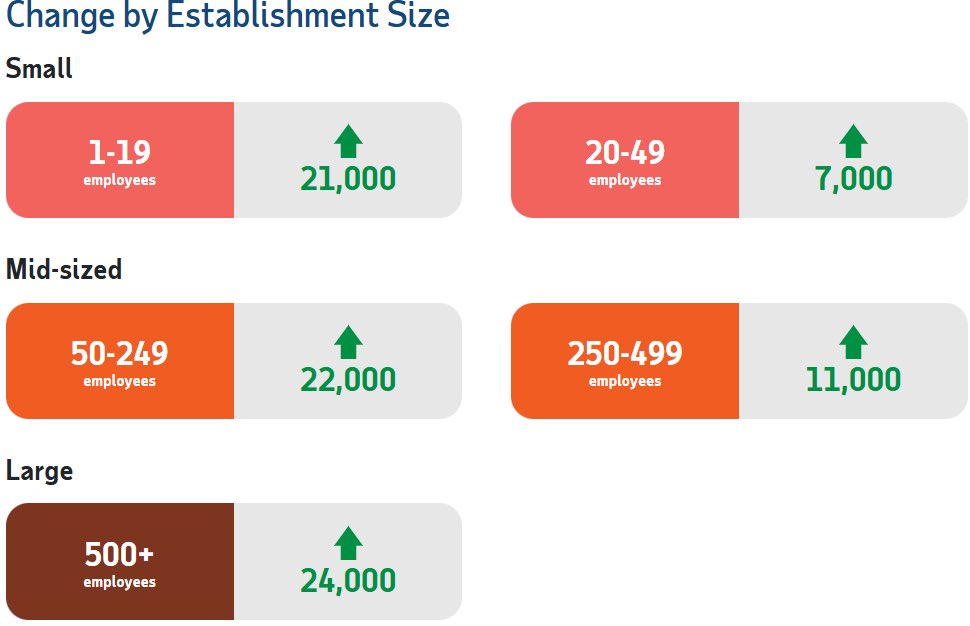
ADP private employment change by establishment size, October | Gains across the board: +24,000 at 500+ firms, +22,000 at 50-249, and +7,000 at 20-49
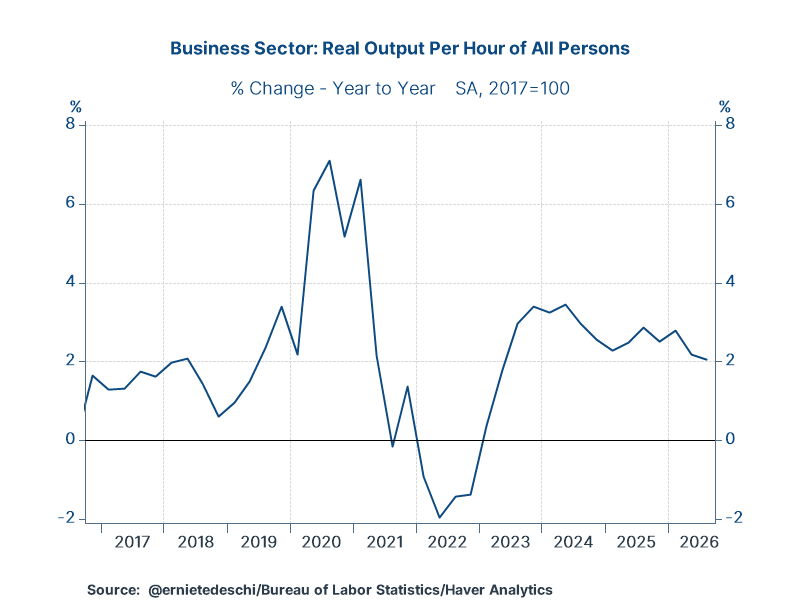
Business-sector real output per hour, YoY % change, 2017-2026 | Latest about 2.1%, down from the 7%+ pandemic peak and back near the long-run average
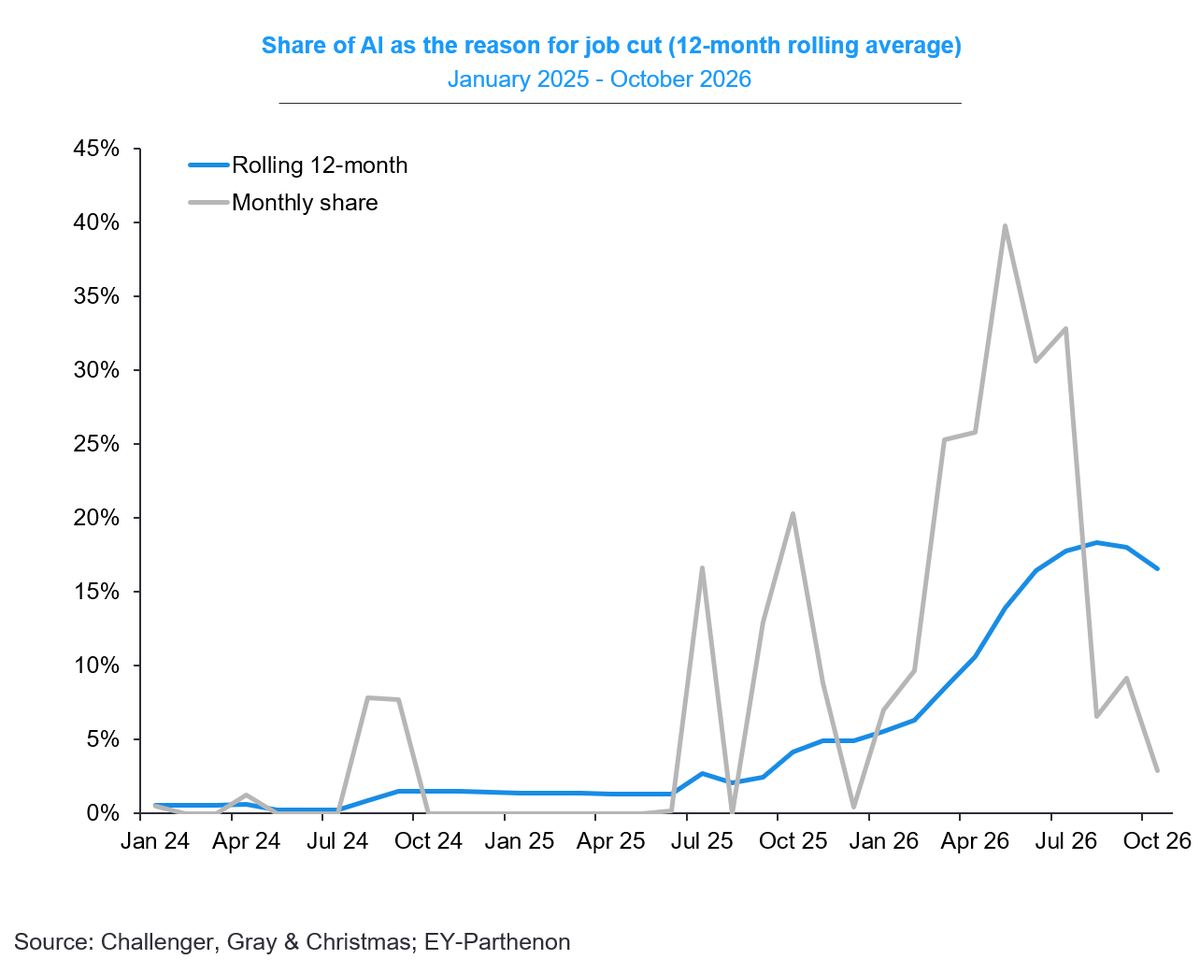
Share of job cuts citing AI, 12-month rolling average | The rolling share has climbed to about 18%, with the monthly figure peaking near 40%
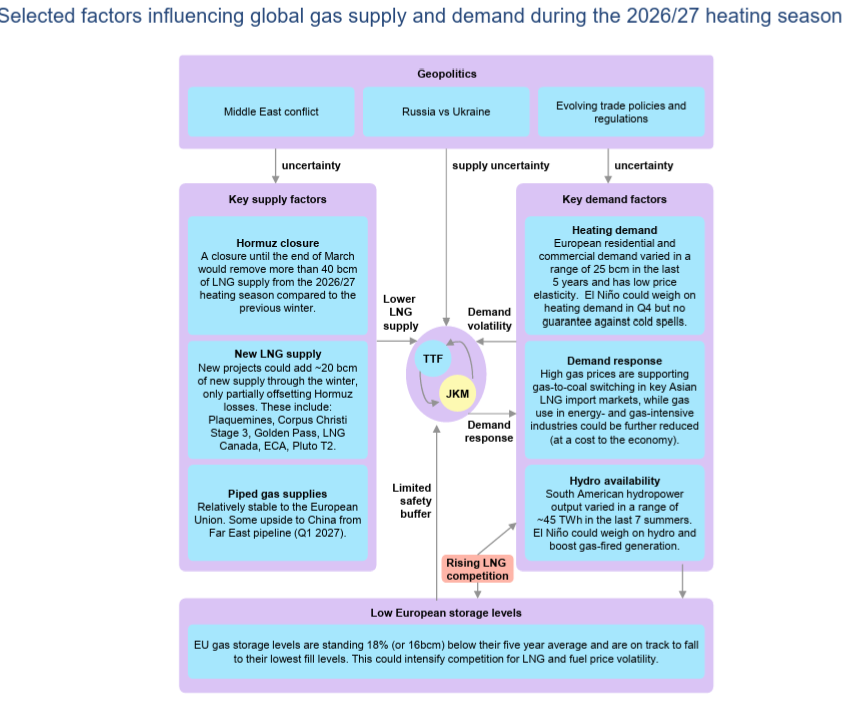
IEA framework of factors driving gas supply and demand in the 2026/27 heating season | A Hormuz closure could remove 40+ bcm of LNG, with EU storage ~18% below its five-year average
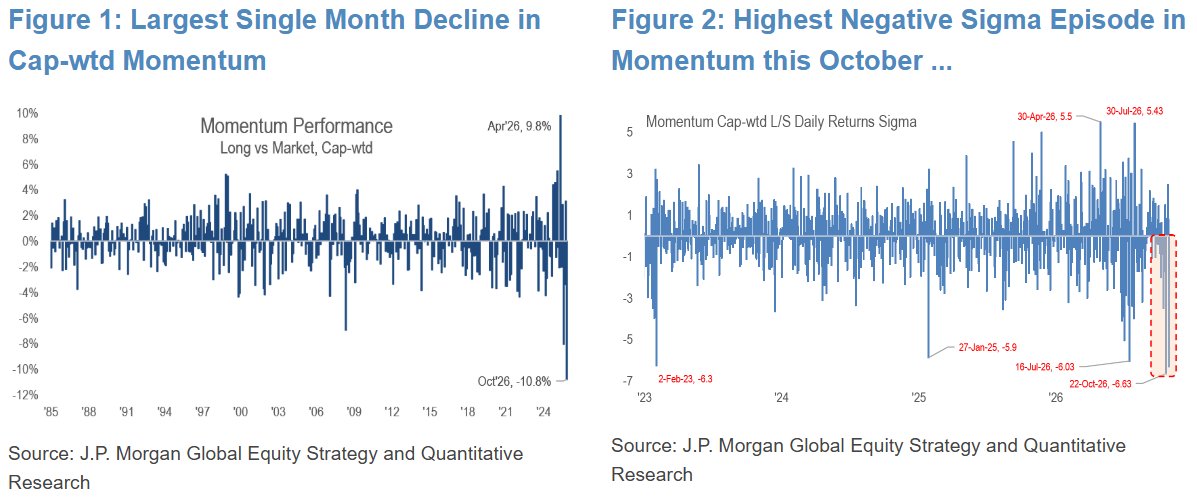
Momentum vs market, monthly return and daily-return sigma, two exhibits | October 2026 at -10.8%, the worst month since 1985; -6.63 sigma on Oct 22
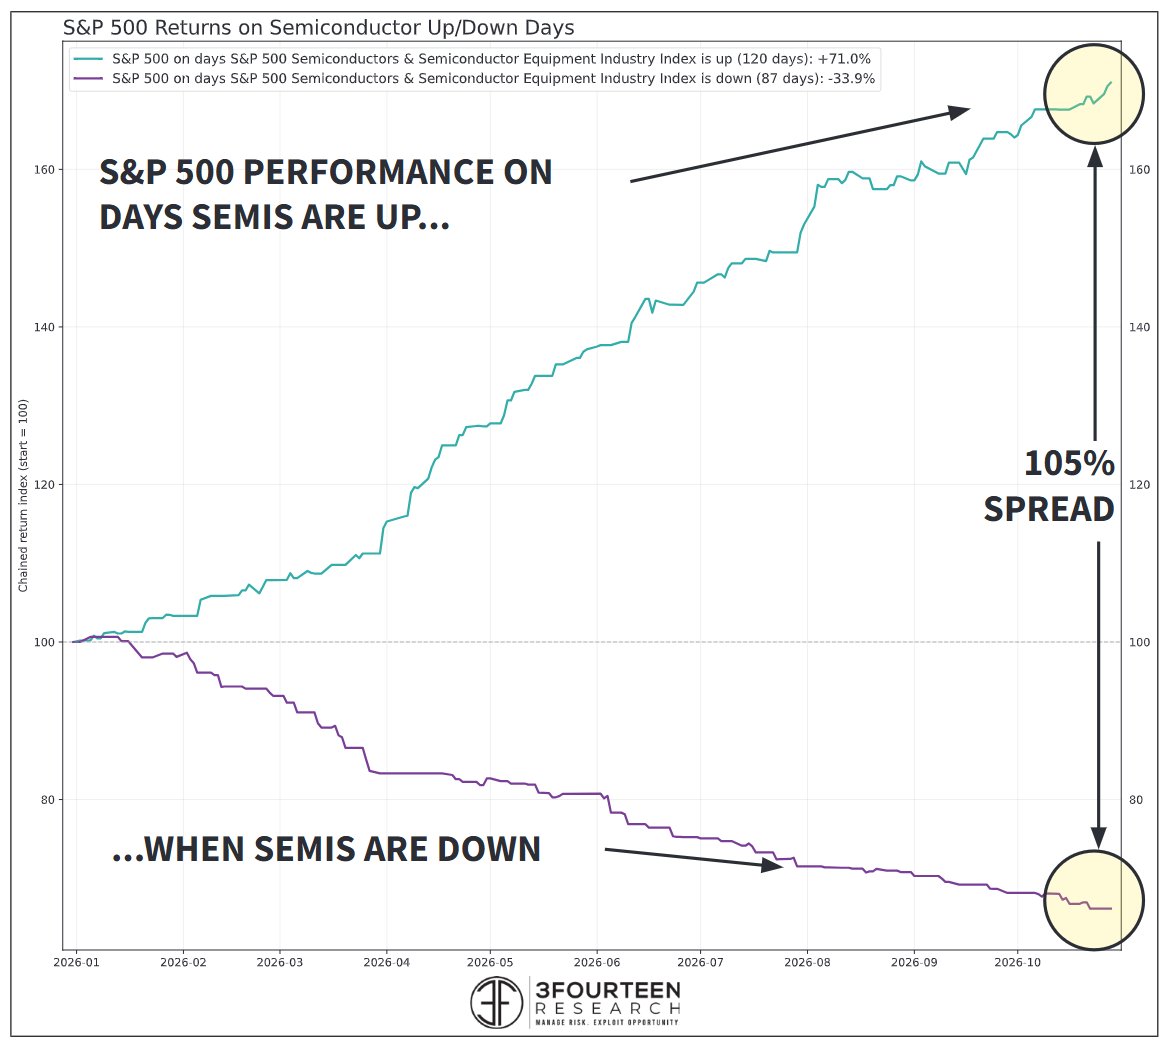
S&P 500 chained return split by semiconductor up/down days, 2026 | +71% on semis-up days vs -34% on semis-down days, a 105% spread
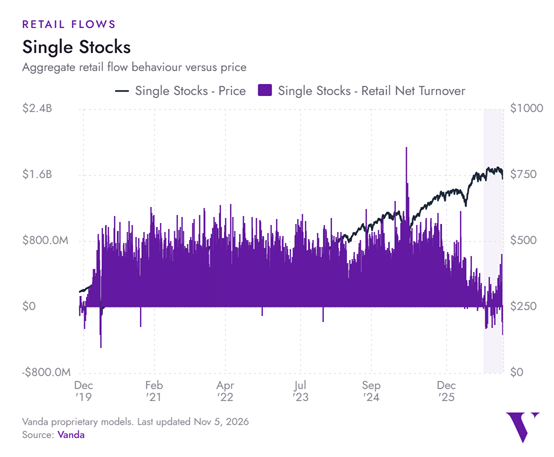
Retail net turnover vs price in single stocks, 2019-2026, Vanda | Recent single-day net selling is the largest since the 2020 COVID plunge
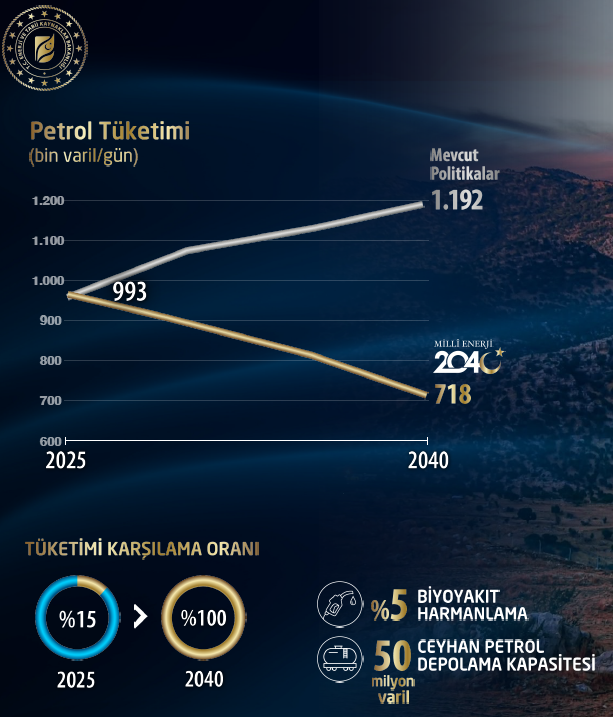
Türkiye oil consumption (thousand b/d), current policy vs 2040 national energy target | From 993k in 2025 to 1.192M under current policy or 718k under the target
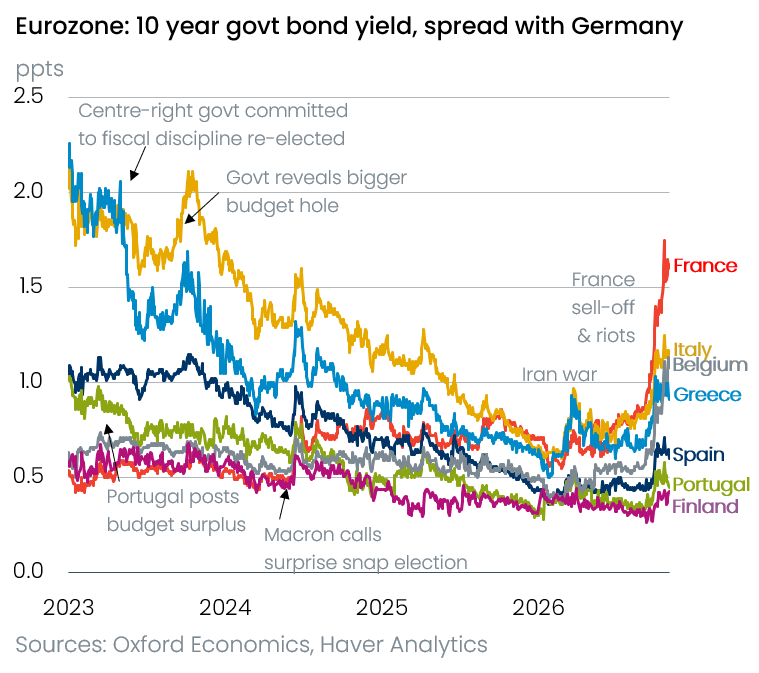
Eurozone 10-year government bond yield spreads over Germany | France widens to about 1.75 ppts, overtaking Italy to lead the bloc
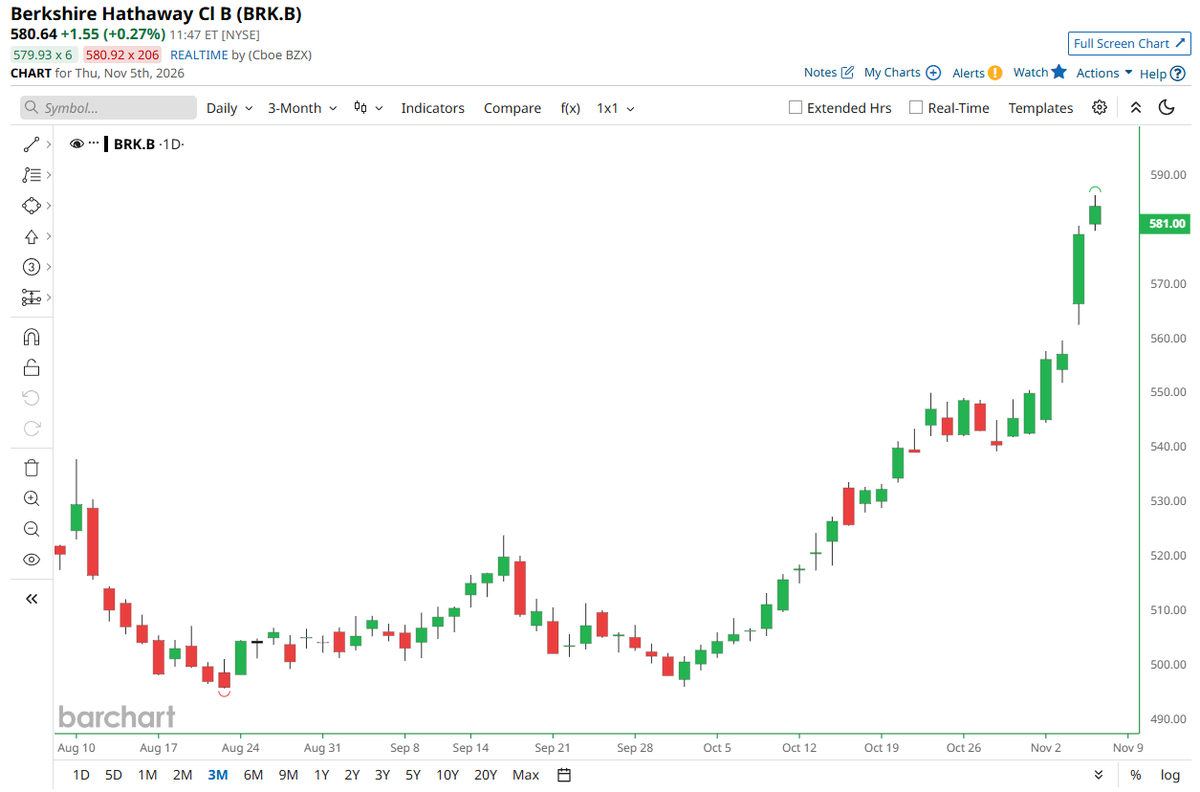
Berkshire Hathaway Class B (BRK.B) daily, past three months | Last around $581, +0.27%, up strongly to new highs from the late-September low near $500
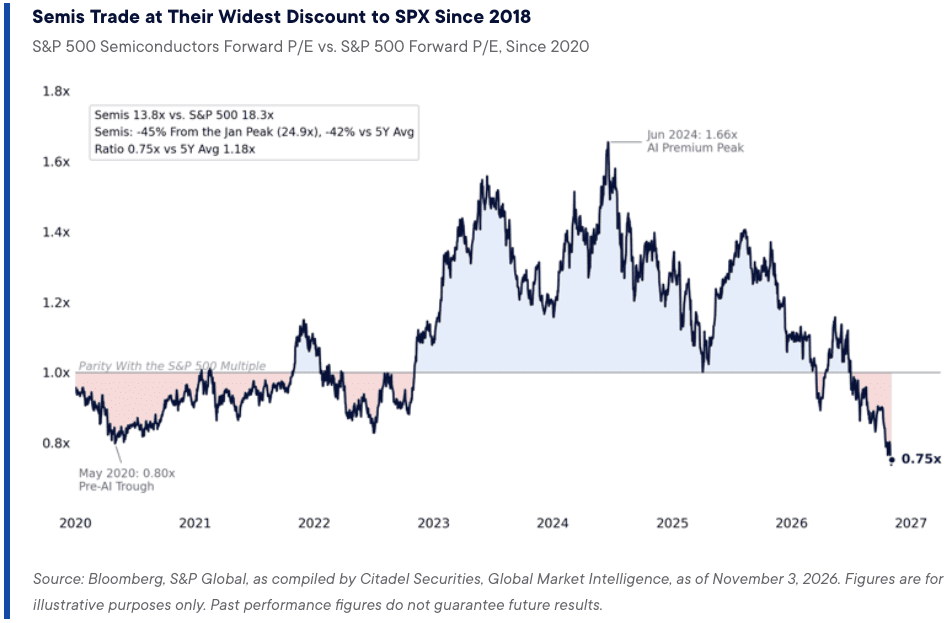
S&P 500 semiconductors forward P/E relative to the S&P 500, since 2020 | Now 0.75x (13.8x vs 18.3x), 45% below the January peak and under the 1.18x 5-year average
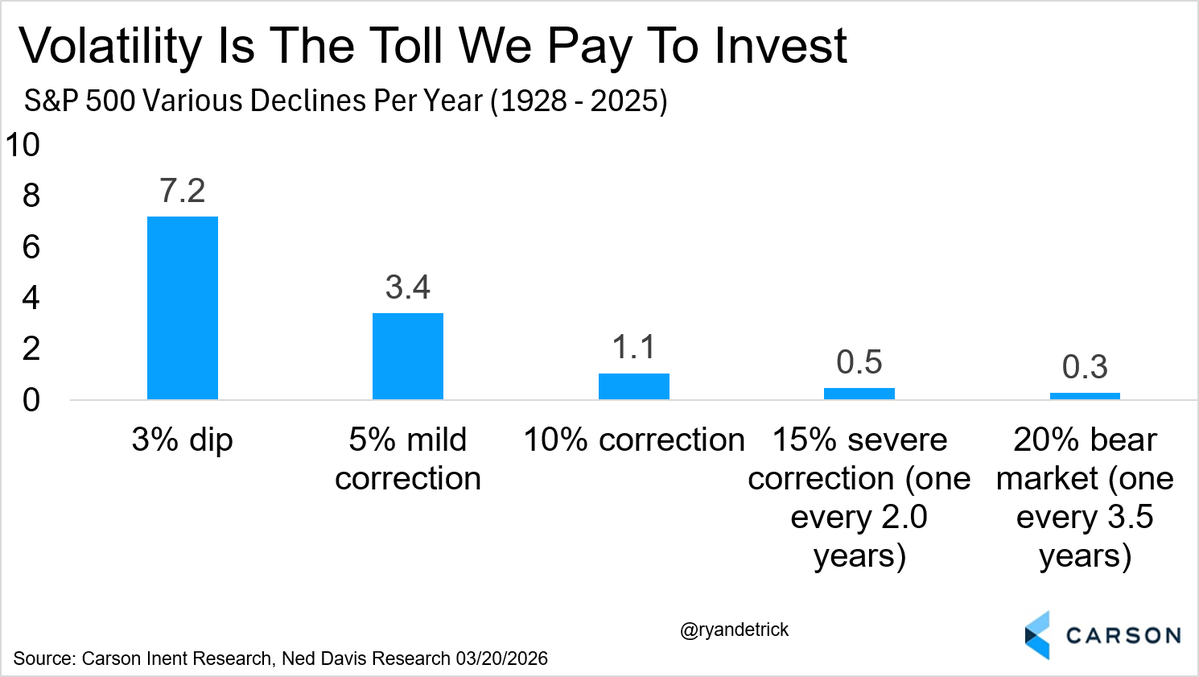
S&P 500 pullback frequency per year, 1928-2025 | 3% dips average 7.2 a year; a 20% bear market roughly once every 3.5 years
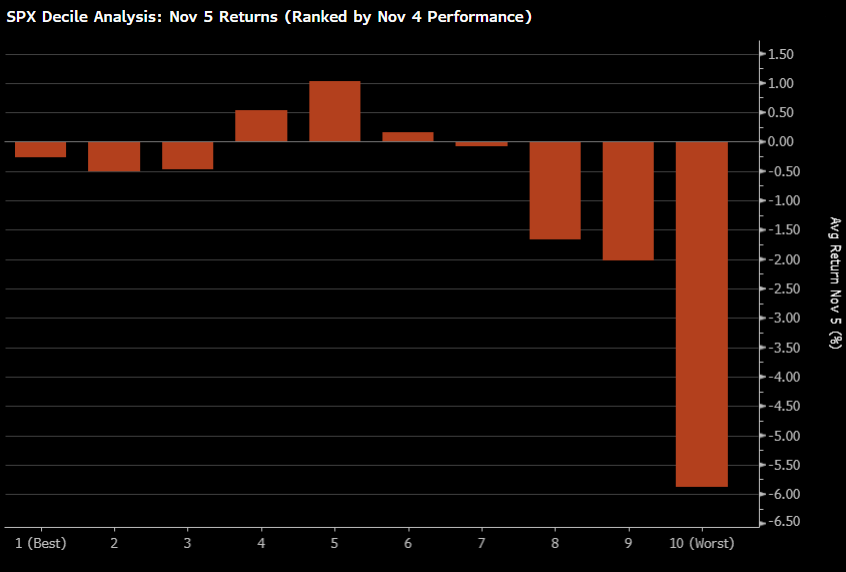
SPX stocks by decile of Nov 4 performance, average Nov 5 return | The worst decile fell about 5.8% the next day; the best decile only slightly lower
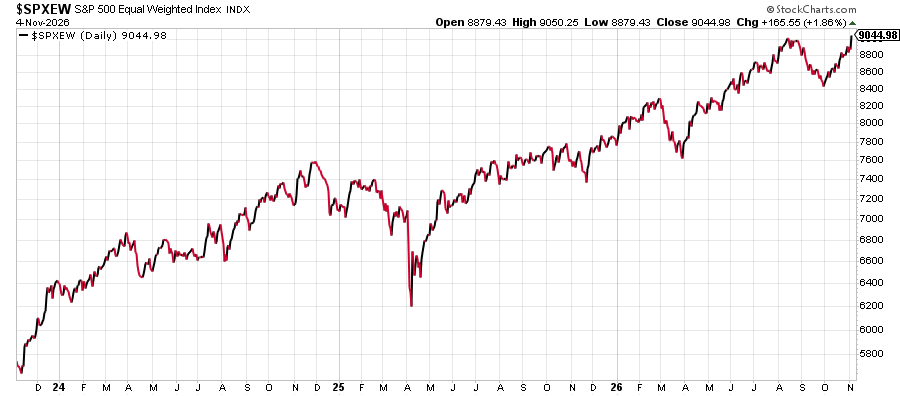
S&P 500 equal-weighted index, daily, 2024-2026 | Closed at 9,044.98, up 1.86% on the day, at an all-time high
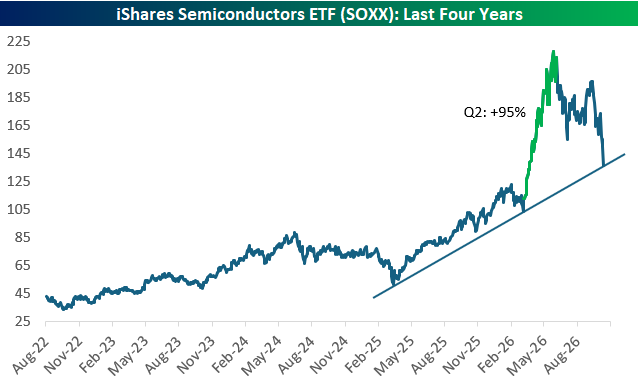
iShares Semiconductors ETF (SOXX), last four years, with uptrend line | Ignoring Q2's ~95% parabola, price just retested the rising trendline
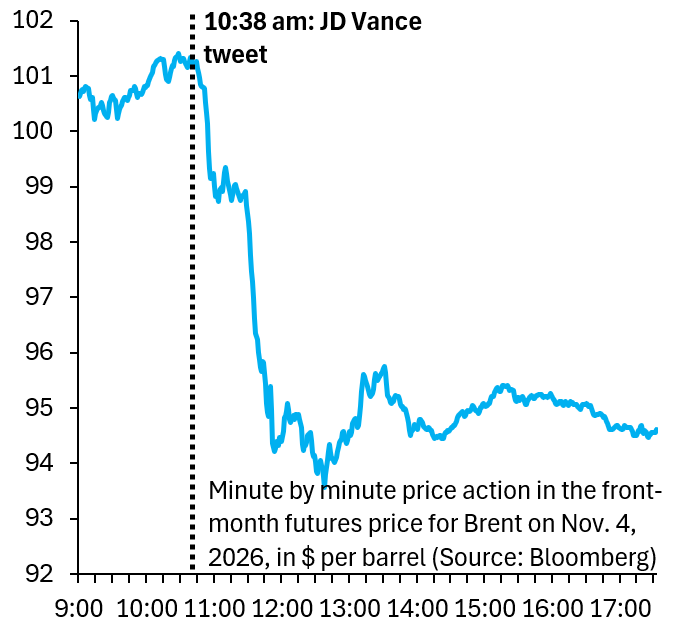
Brent front-month futures, minute-by-minute, $/barrel, Nov 4 2026 | Dropped from about $101 to roughly $94.5, accelerating after a late-morning post
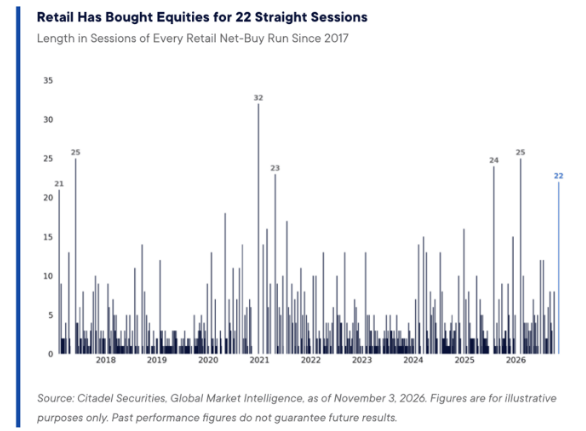
Length of every retail net-buy run since 2017 | Current streak of 22 sessions, behind only a few records like 32 and 25
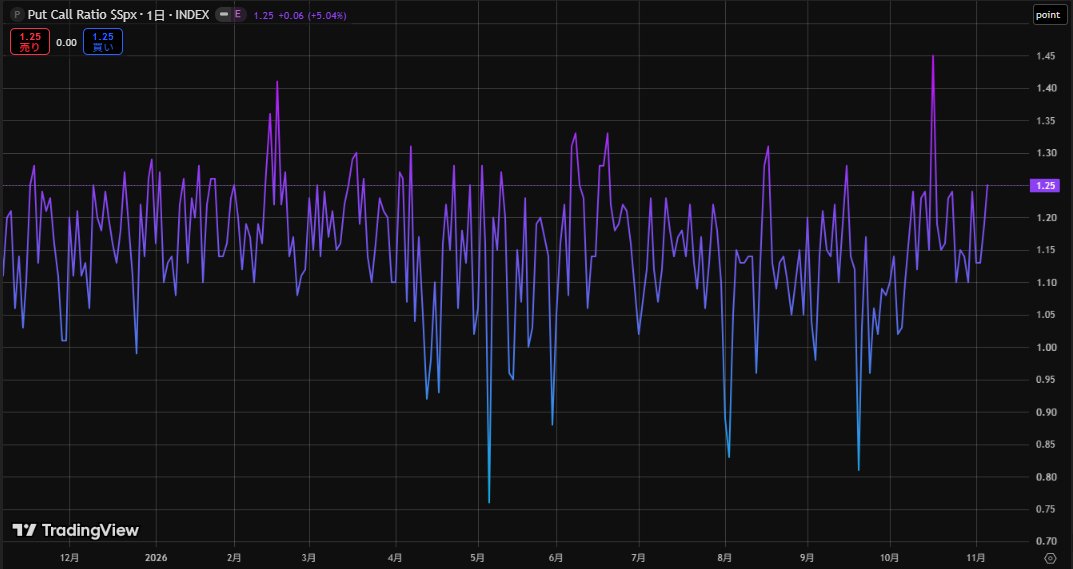
S&P 500 put/call ratio, daily, 2025–2026 | Latest 1.25, up 5.04% on the day, tilted toward hedging