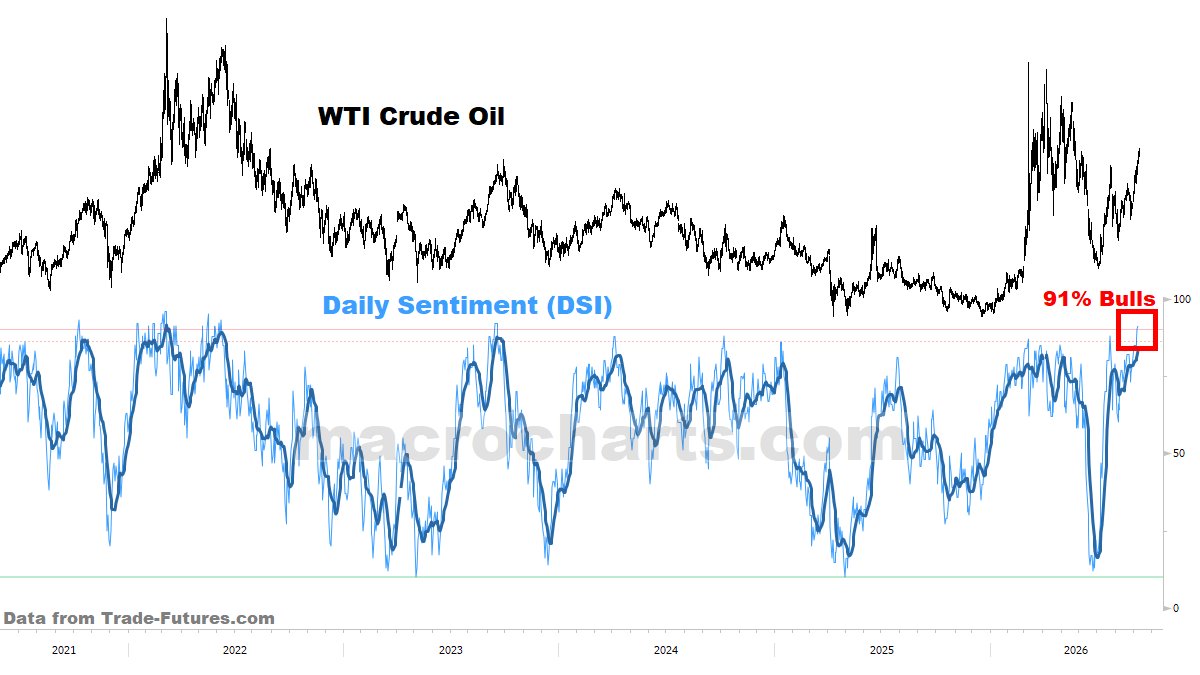
WTI Crude Daily Sentiment Index Climbs to 91% Bulls as Oil Rebounds
WTI crude price and Daily Sentiment Index (since 2021) | DSI latest at 91% bulls, rising alongside oil's rebound off the lows
English financial charts and market context published in 2026-09, page 32.
WTI crude price and Daily Sentiment Index (since 2021) | DSI latest at 91% bulls, rising alongside oil's rebound off the lows
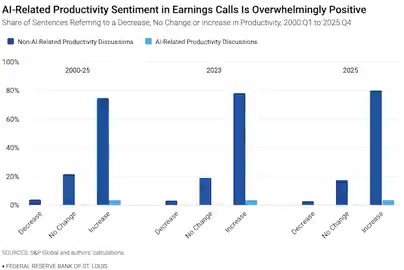
Share of earnings-call sentences citing a decrease, no change, or increase in productivity | "Increase" tops 70% and rises to ~80% by 2025, with AI-related mentions the most upbeat
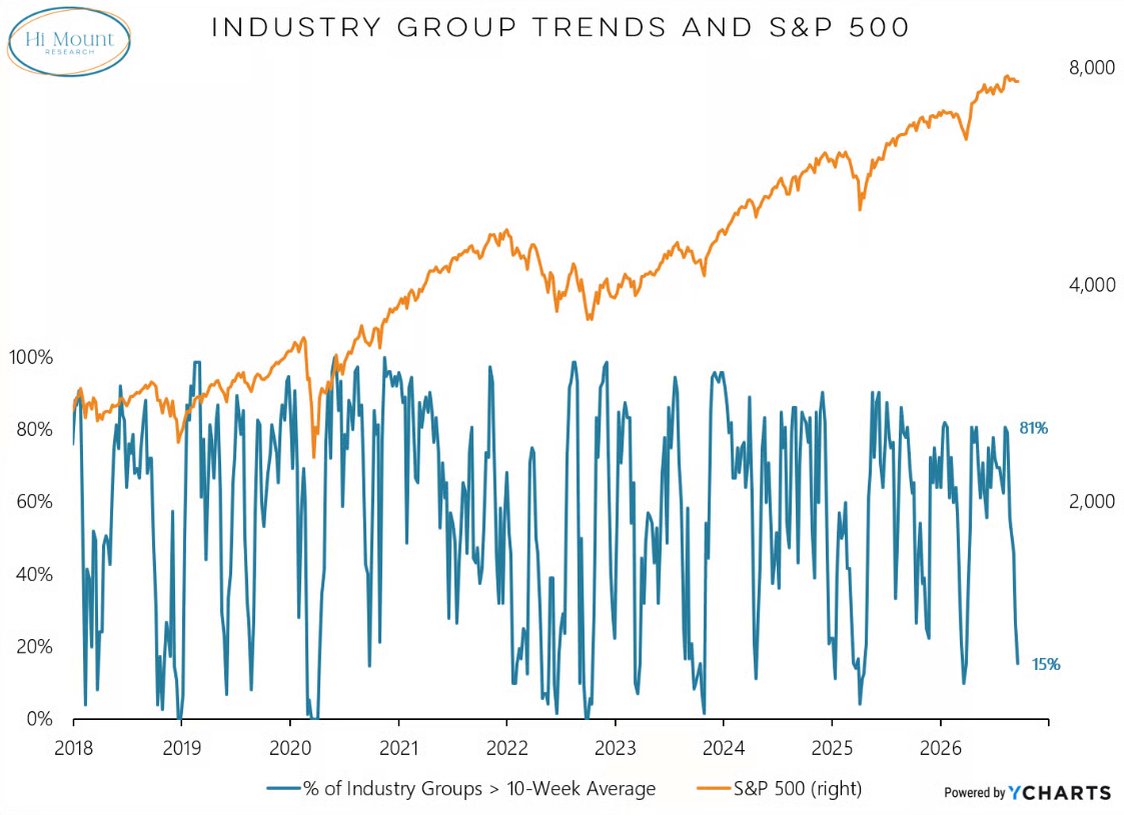
Percent of industry groups above their 10-week average vs the S&P 500 (since 2018) | Breadth fell from 81% to 15% even as the S&P 500 holds near 7,900
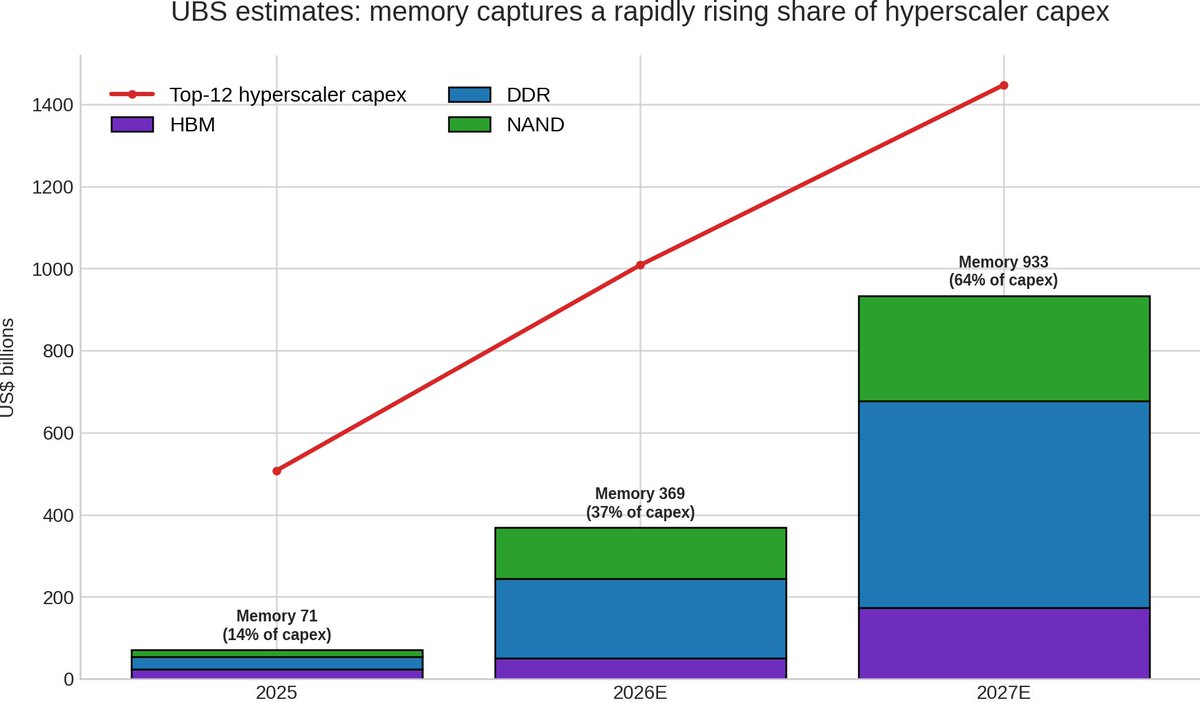
Top-12 hyperscaler capex and memory spend (US$ billions) | Memory spend rises from $71B (14% of capex) in 2025 to an estimated $933B (64%) in 2027
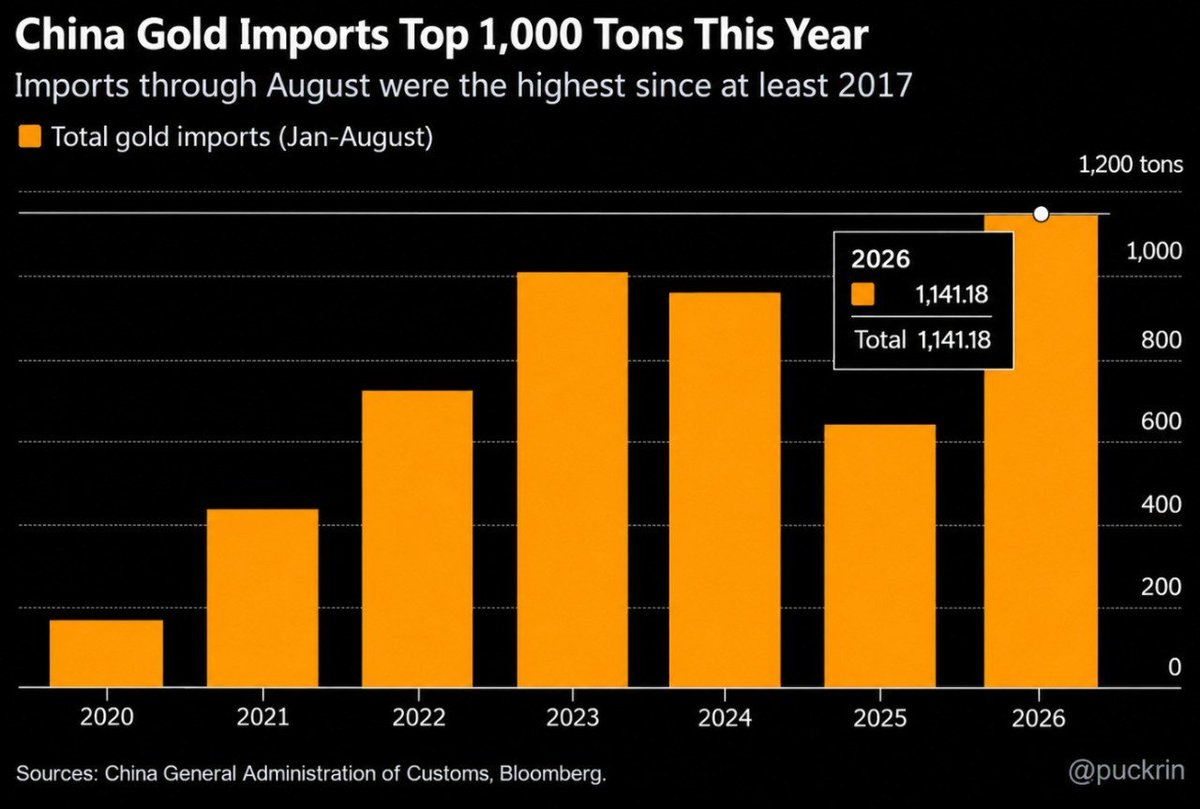
China gold imports (January-August, tonnes), 2020-2026 | 1,141 tonnes through August 2026, the highest since at least 2017
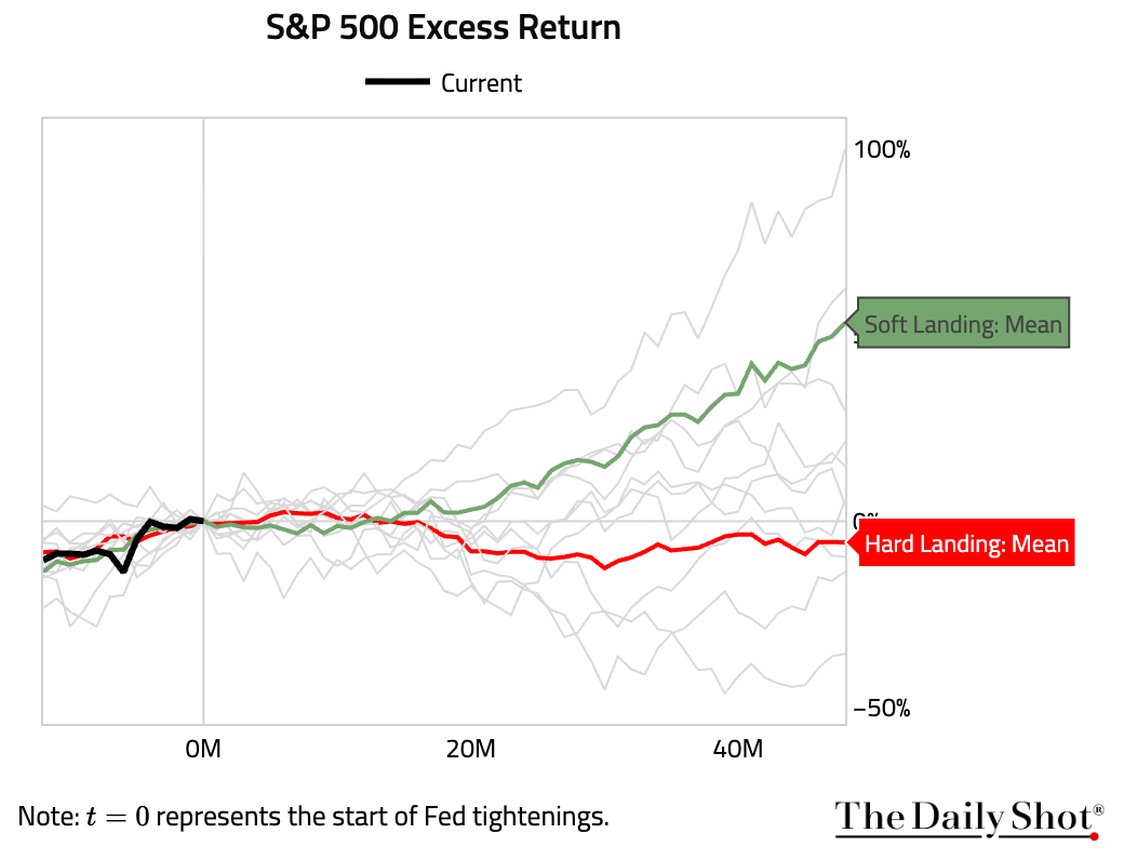
S&P 500 excess return, months from start of Fed tightening (t=0) | About 40 months out, the soft-landing mean is up roughly 50% while the recession mean sits near zero to negative
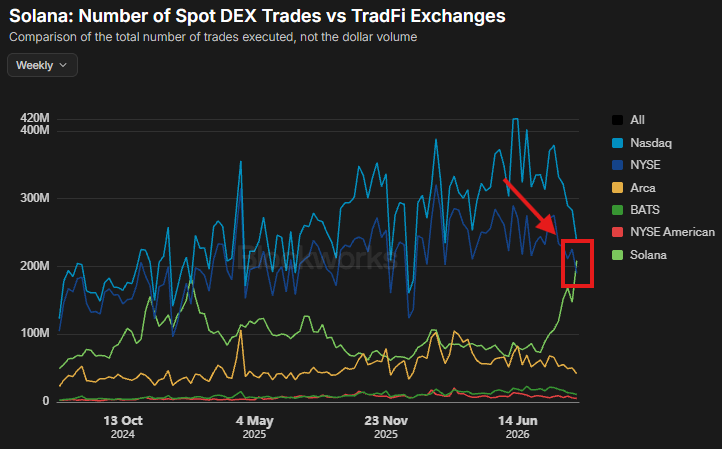
Solana spot DEX trades vs TradFi exchanges, weekly trade counts | Solana about 208M edged past the NYSE's about 190M, a first on record
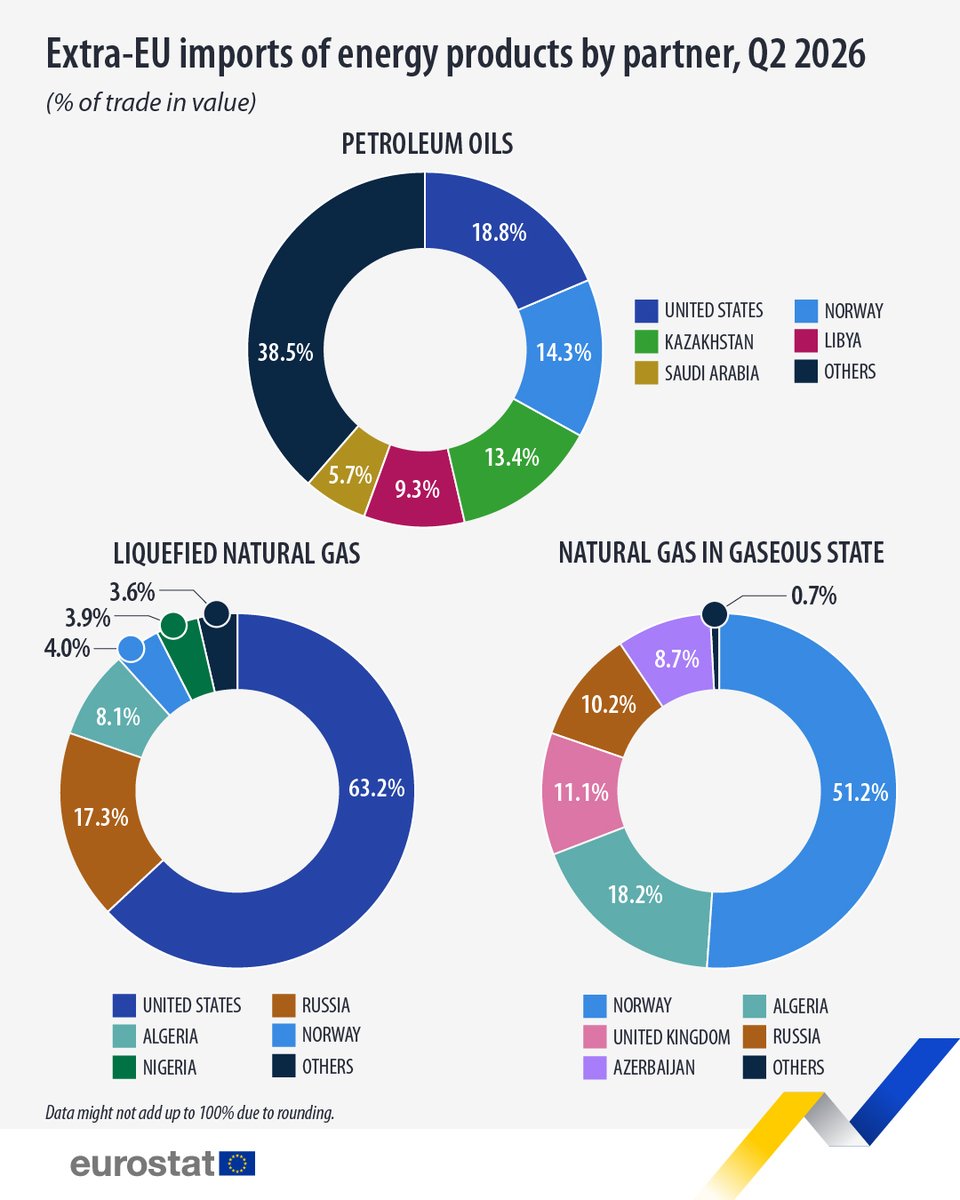
Extra-EU energy imports by partner, Q2 2026 (% of trade value) | US at 18.8% of petroleum oils and 63.2% of LNG, while Norway supplies 51.2% of pipeline gas
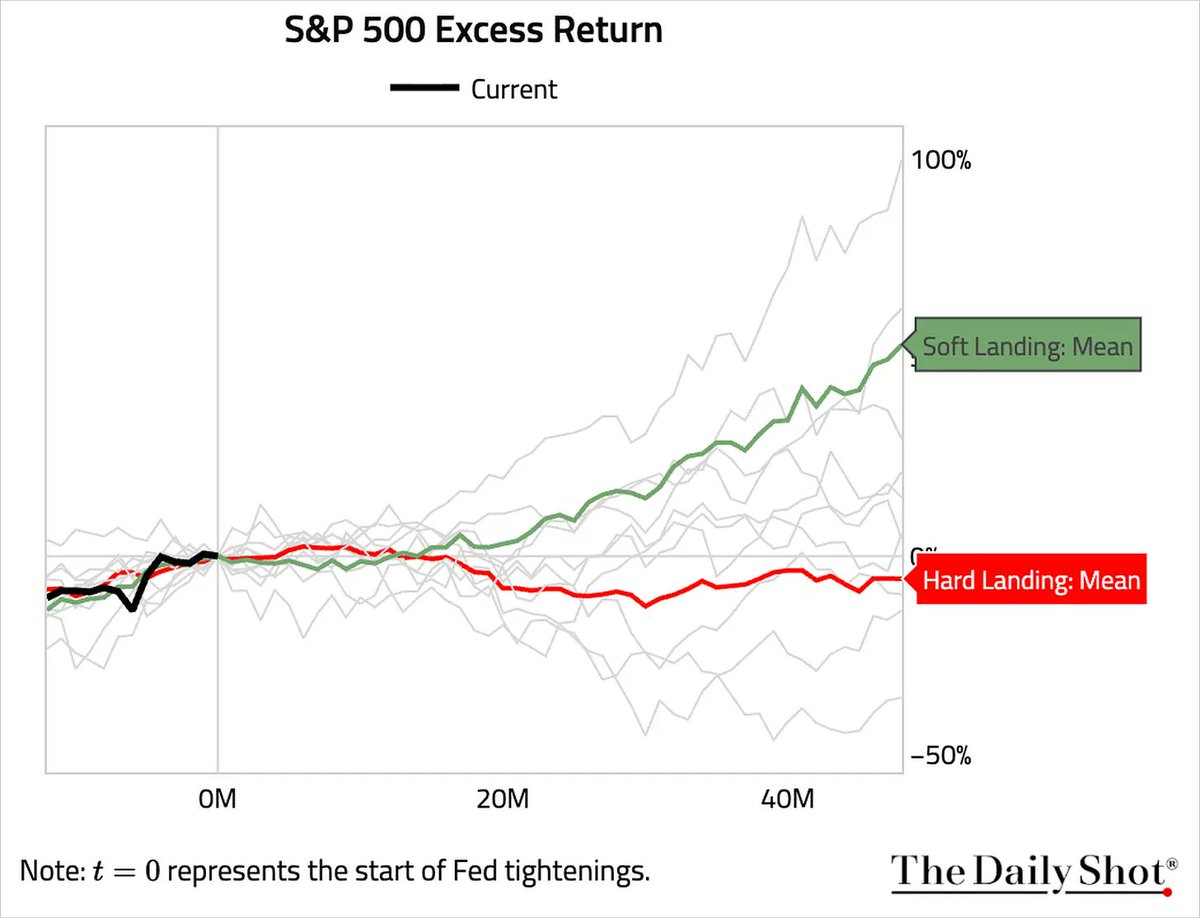
S&P 500 excess return around Fed tightening cycles since the 1960s | The soft-landing mean climbs ~80% later on while the hard-landing mean stalls near zero
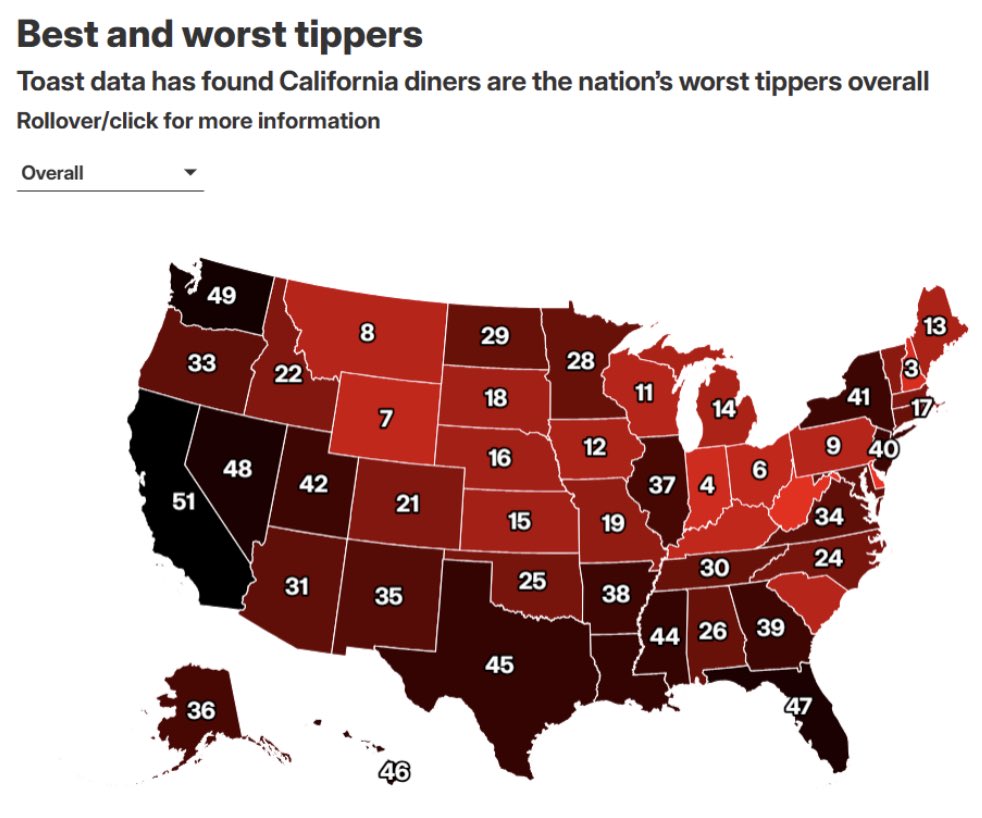
US states ranked by restaurant tipping generosity (Toast; numbers are ranks) | California ranks 51st, the lowest, with red states generally near the top
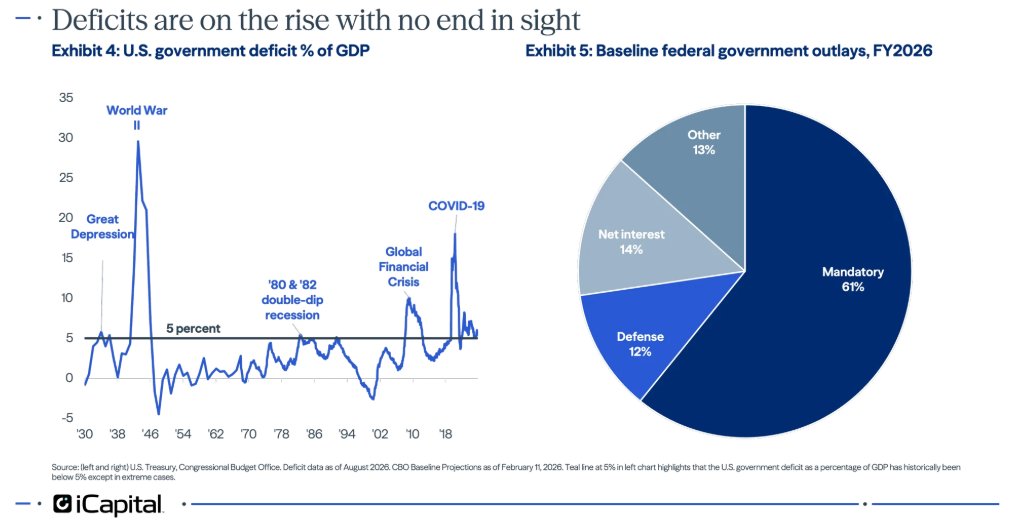
US government deficit as a share of GDP and the FY2026 federal outlay mix | The deficit exceeds 5% of GDP, rare outside wars and recessions, while mandatory spending is 61% of outlays and net interest 14%
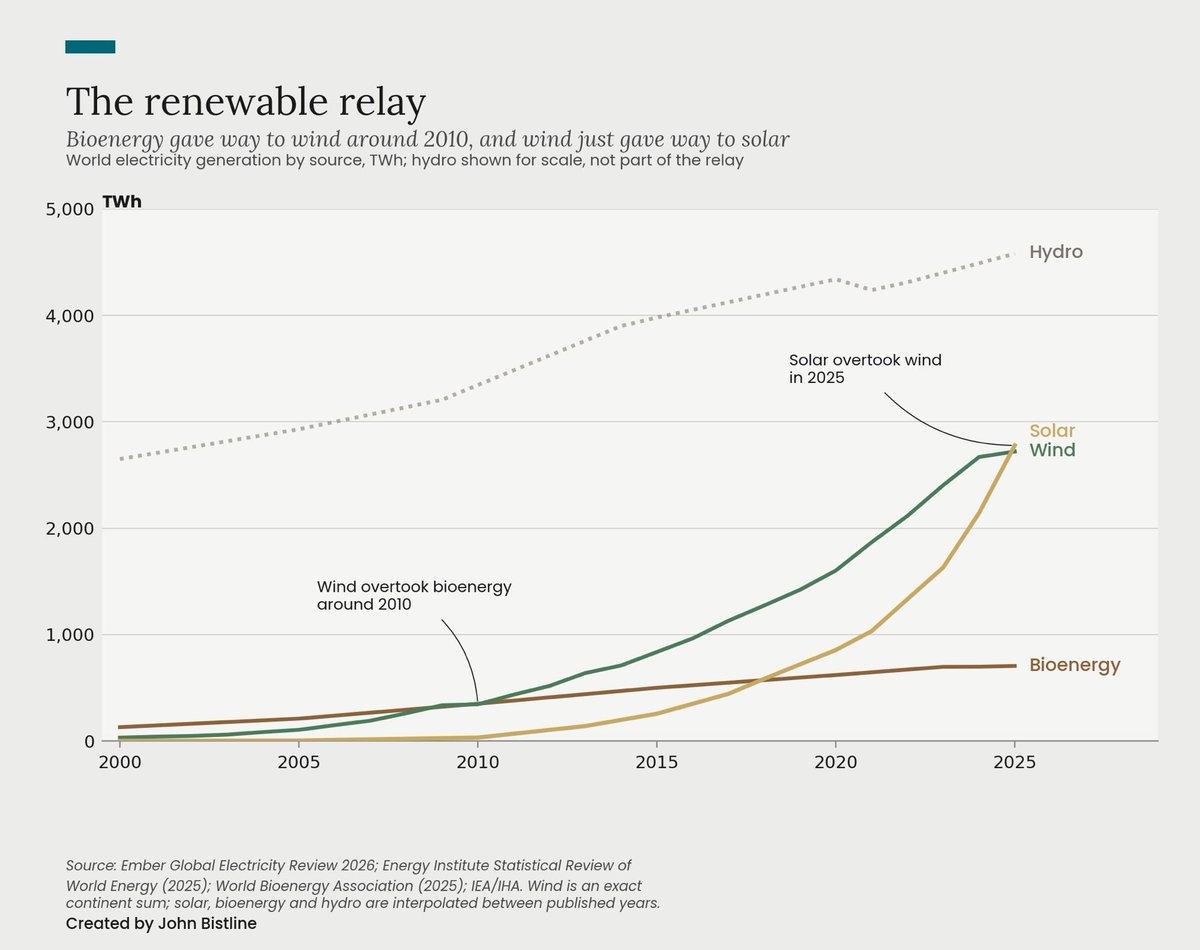
World electricity generation by renewable source (TWh), 2000-2025 | Solar passed wind in 2025 at ~2,700 TWh each, after wind overtook bioenergy around 2010
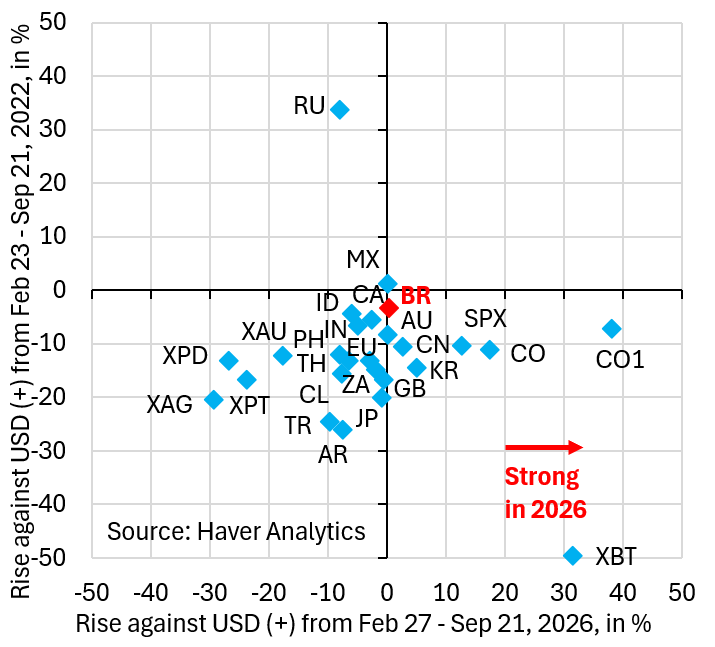
Currency moves vs USD, 2022 vs Feb-Sep 2026 (%) | Most EM currencies sit weaker (left) in 2026 while Brazil's real is roughly flat, and Colombia and bitcoin lead gains
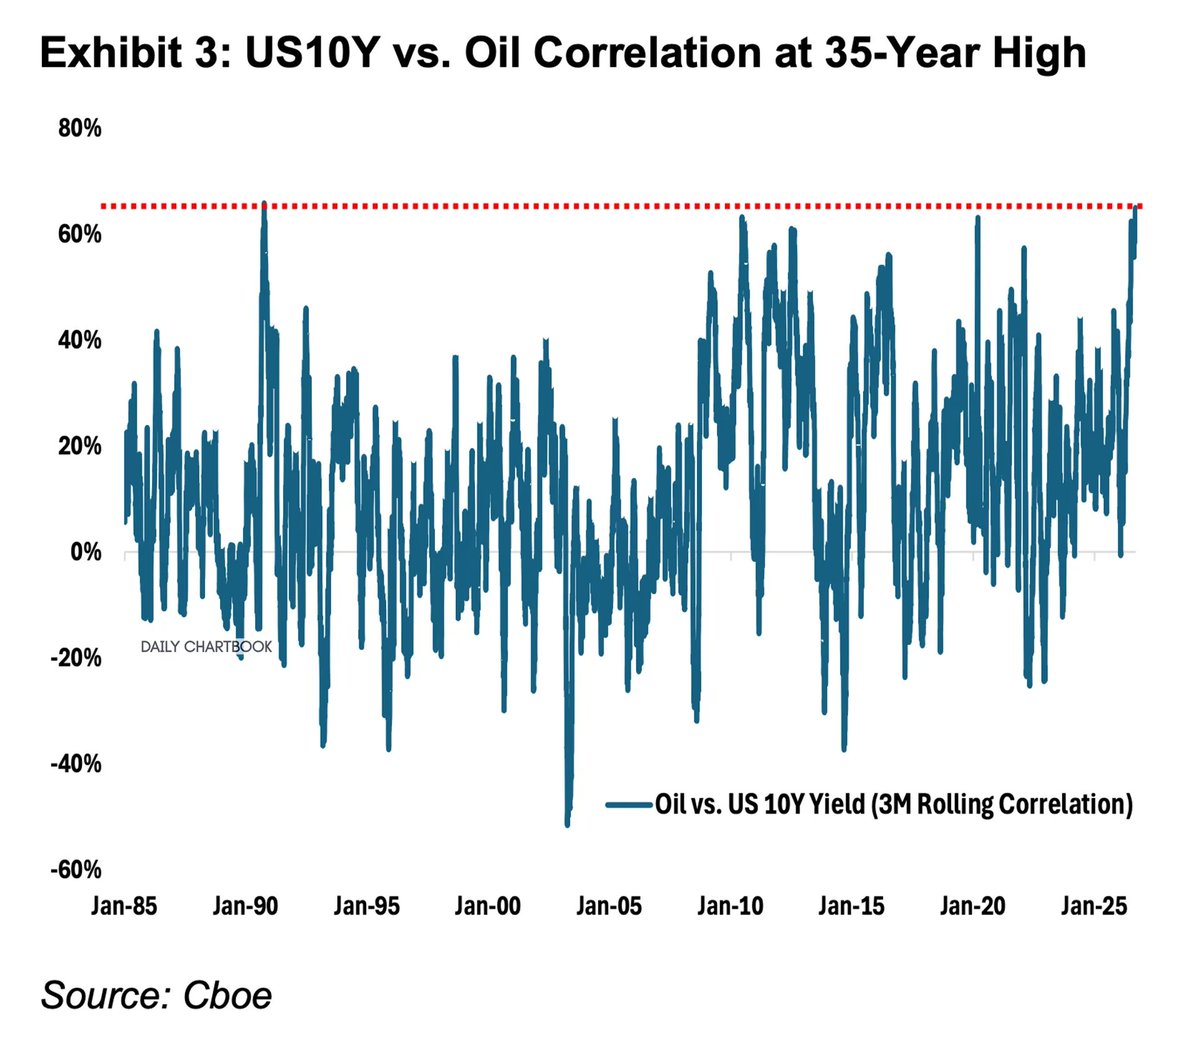
Oil vs. US 10Y yield, 3-month rolling correlation (since 1985) | Latest about +65%, the highest since 1990
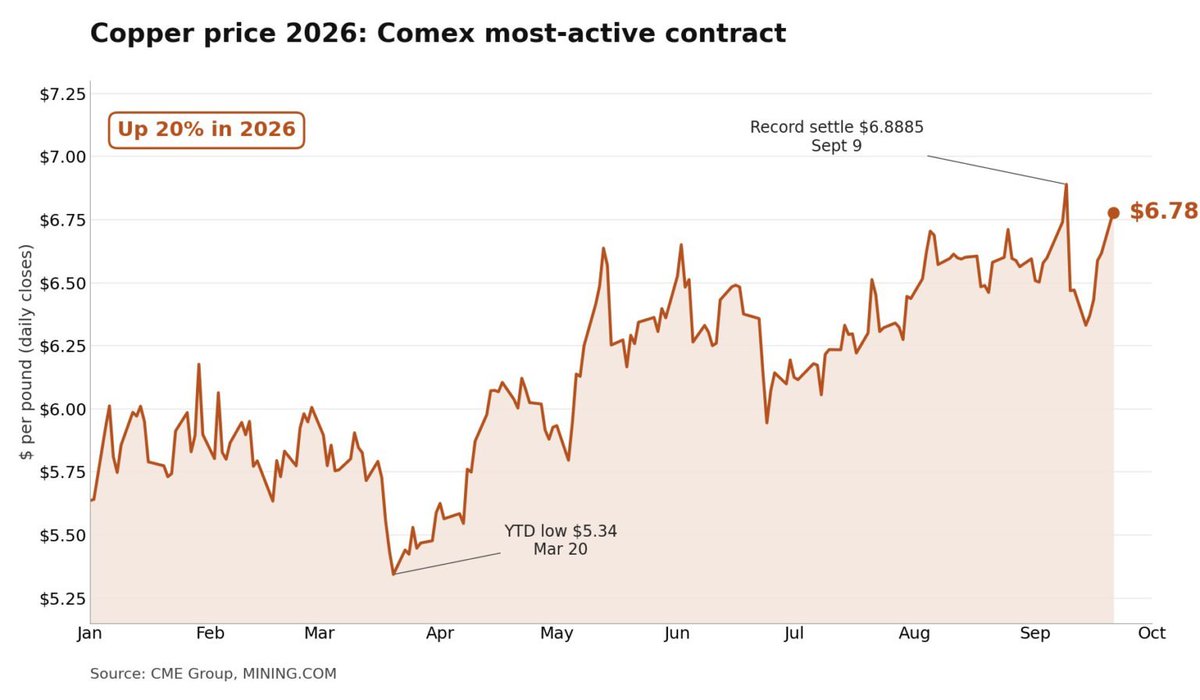
Comex most-active copper price in 2026 ($/lb) | Now $6.78 and up about 20% YTD, just off the record settle of $6.8885 on September 9
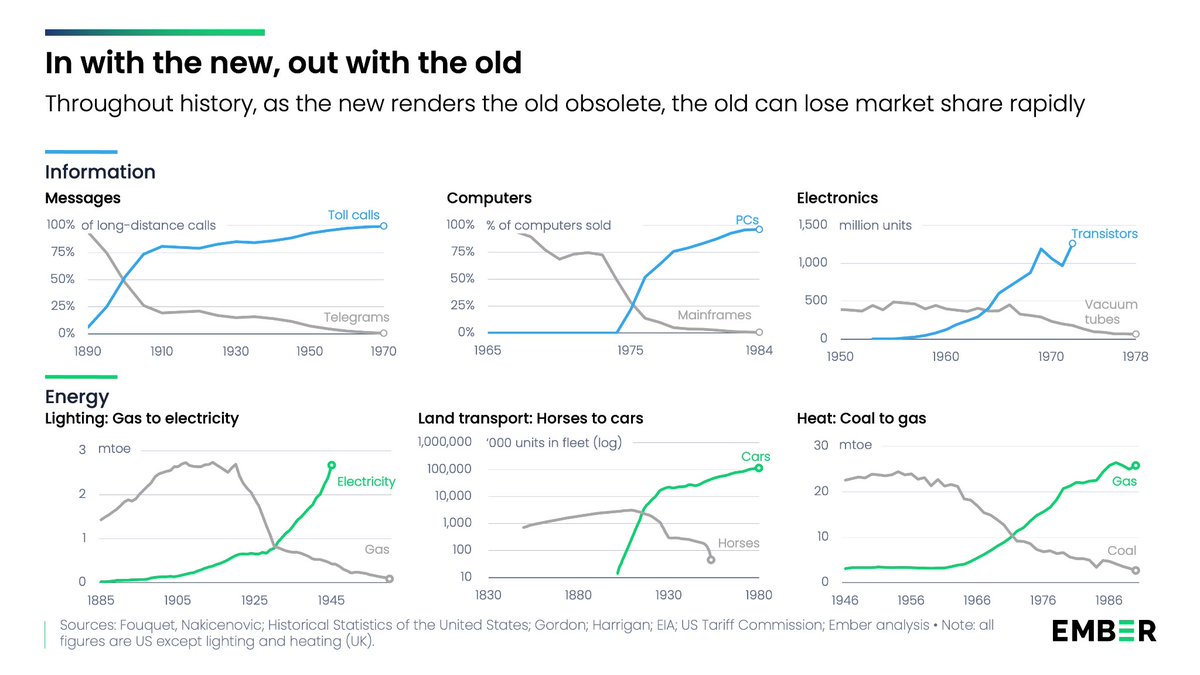
Six new-vs-old technology transition curves (messages, computers, electronics, lighting, transport, heat) | Cars, PCs, electricity and gas each rapidly displaced telegrams, mainframes, horses and coal once they broke through
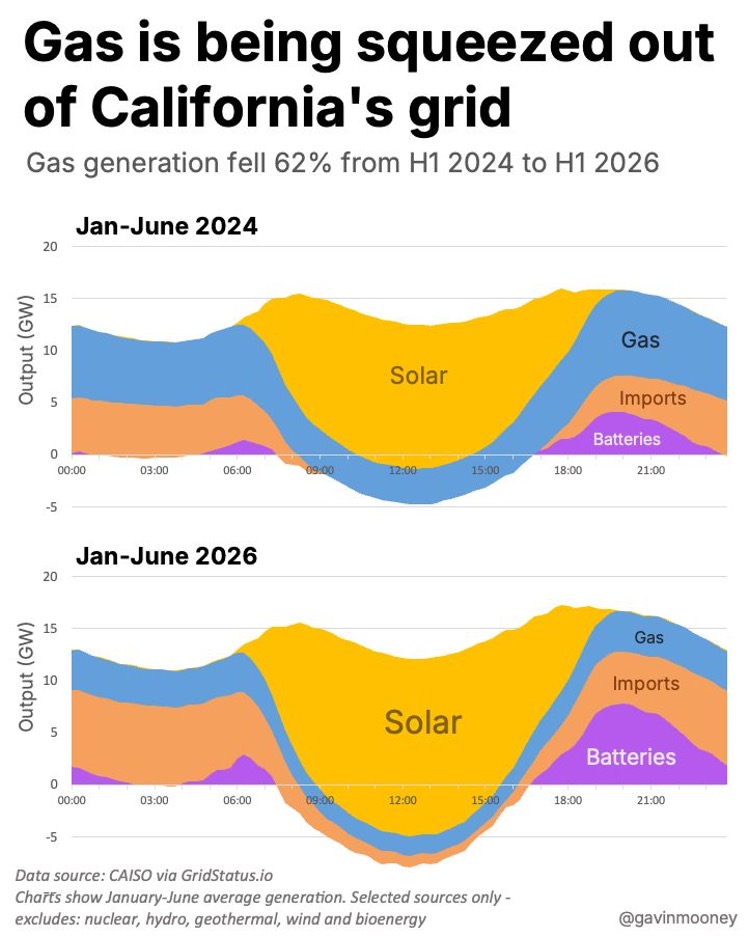
California grid intraday generation mix, H1 2024 vs H1 2026 (GW) | Gas generation down 62% from H1 2024 to H1 2026, with batteries and imports filling the evening ramp
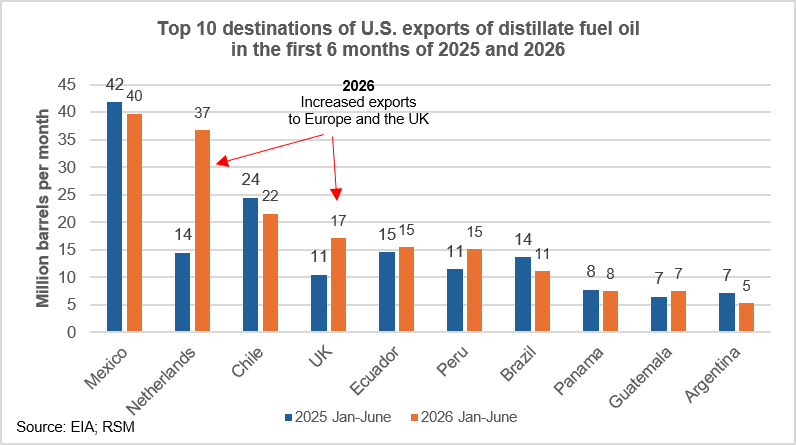
Top 10 destinations for US distillate fuel oil exports, H1 2025 vs H1 2026 (million barrels/month) | Netherlands rose from 14M to 37M and the UK from 11M to 17M barrels a month
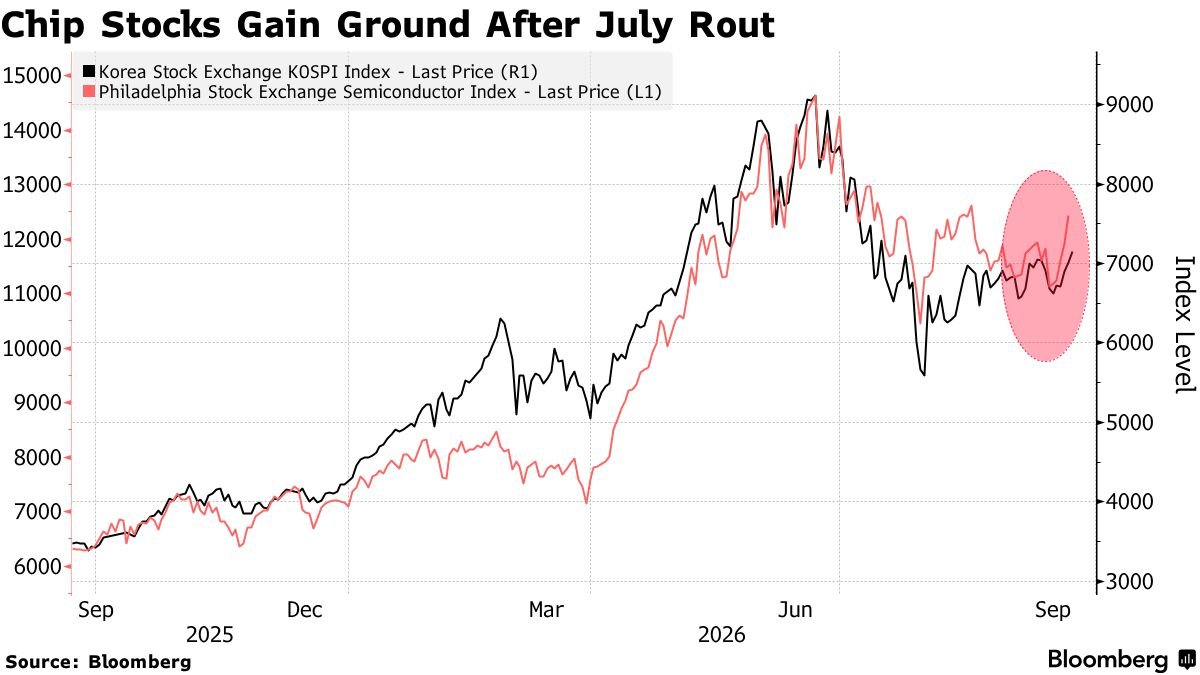
Korea's KOSPI and the Philadelphia Semiconductor Index (Sep 2025-Sep 2026) | Both rebounded after the July pullback, with the KOSPI near 11,500 and the SOX around 7,000
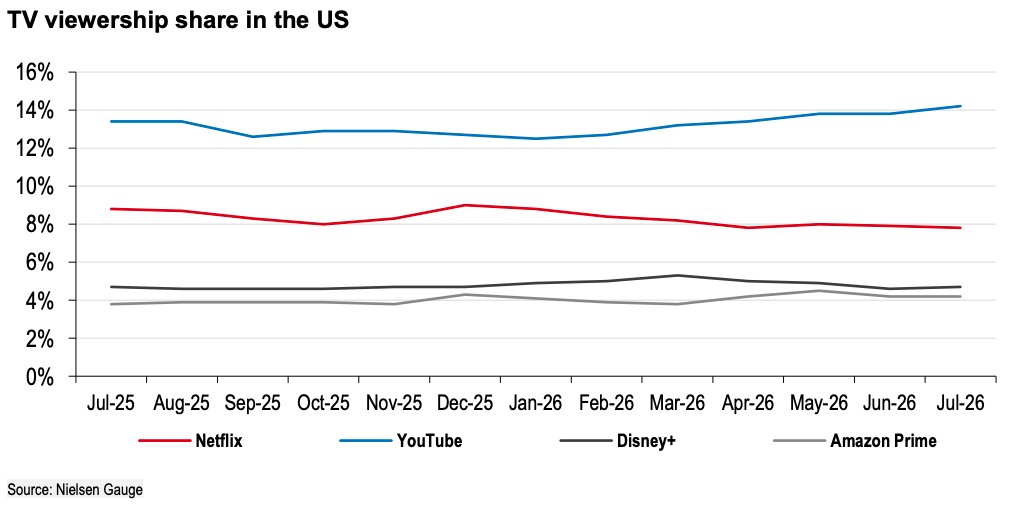
US TV viewership share, Nielsen Gauge (Jul-2025 to Jul-2026) | July 2026: YouTube about 14.2% and rising, Netflix down to about 7.8%
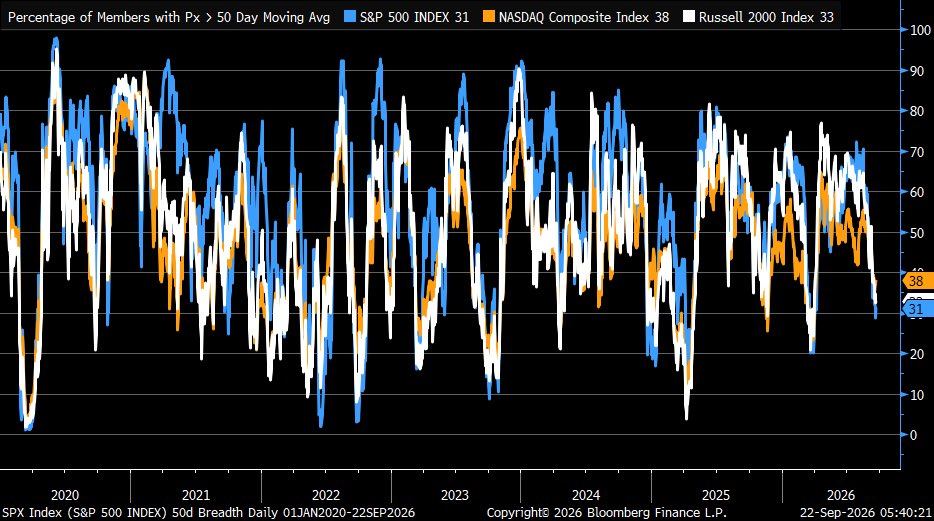
Percentage of index members trading above their 50-day moving average, 2020-2026 | S&P 500 at 31%, Nasdaq 38%, Russell 2000 33%
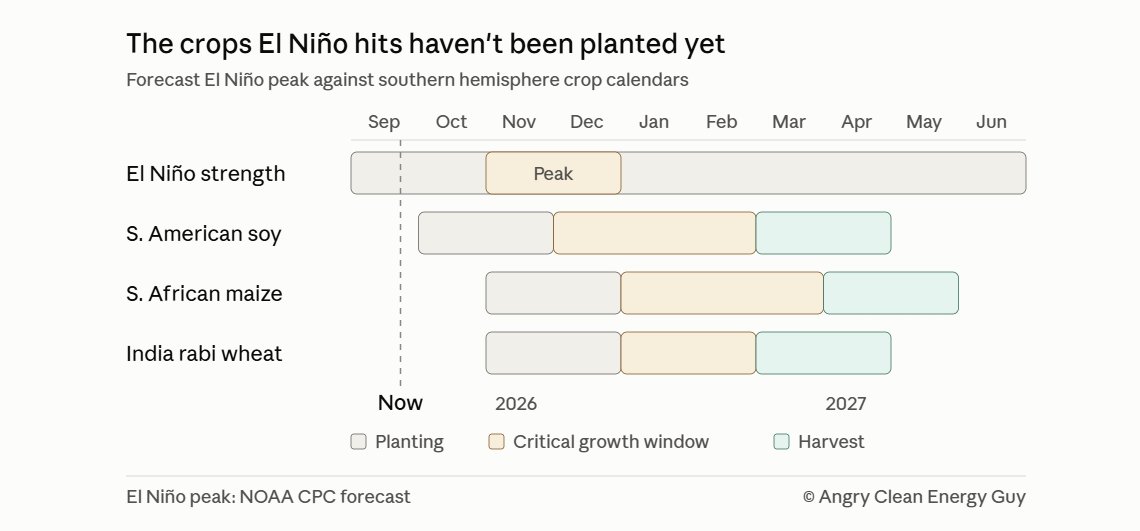
Forecast El Niño peak vs southern-hemisphere crop calendars | Peak in Nov-Dec 2026, with soy, maize and wheat critical windows running Dec-Feb
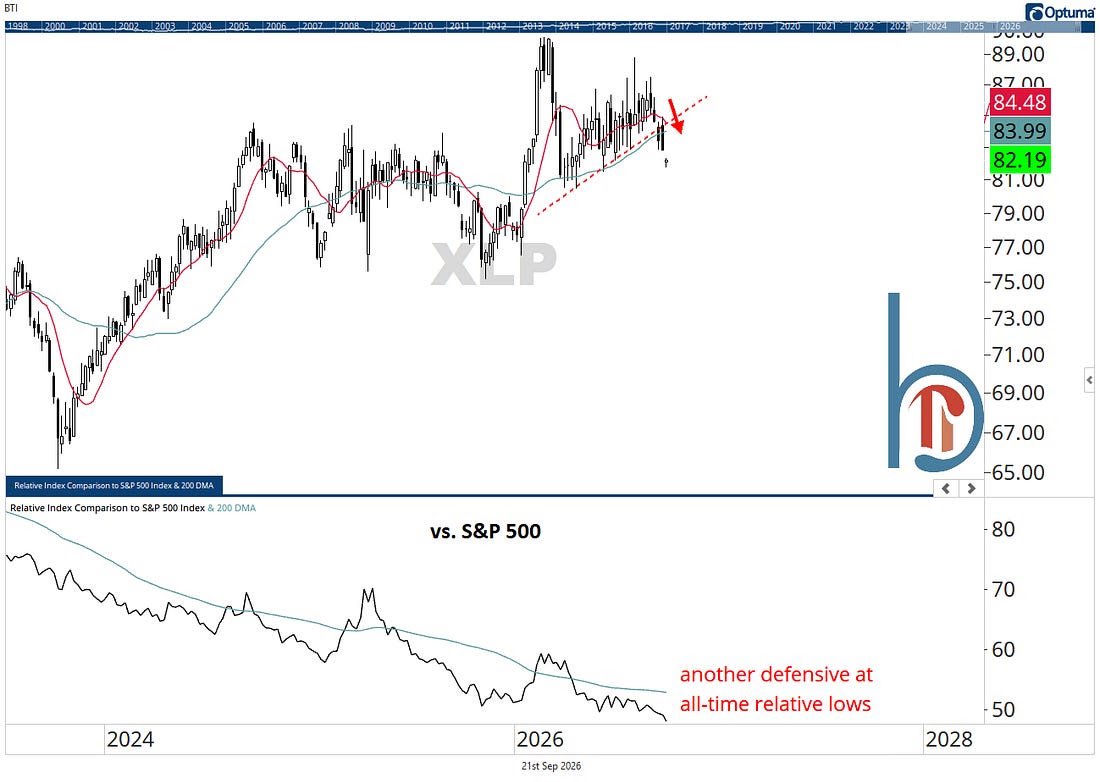
Consumer staples ETF XLP price and its relative strength vs the S&P 500 | XLP's ratio to the S&P 500 keeps making new lows, the weakest defensive relative performance on record
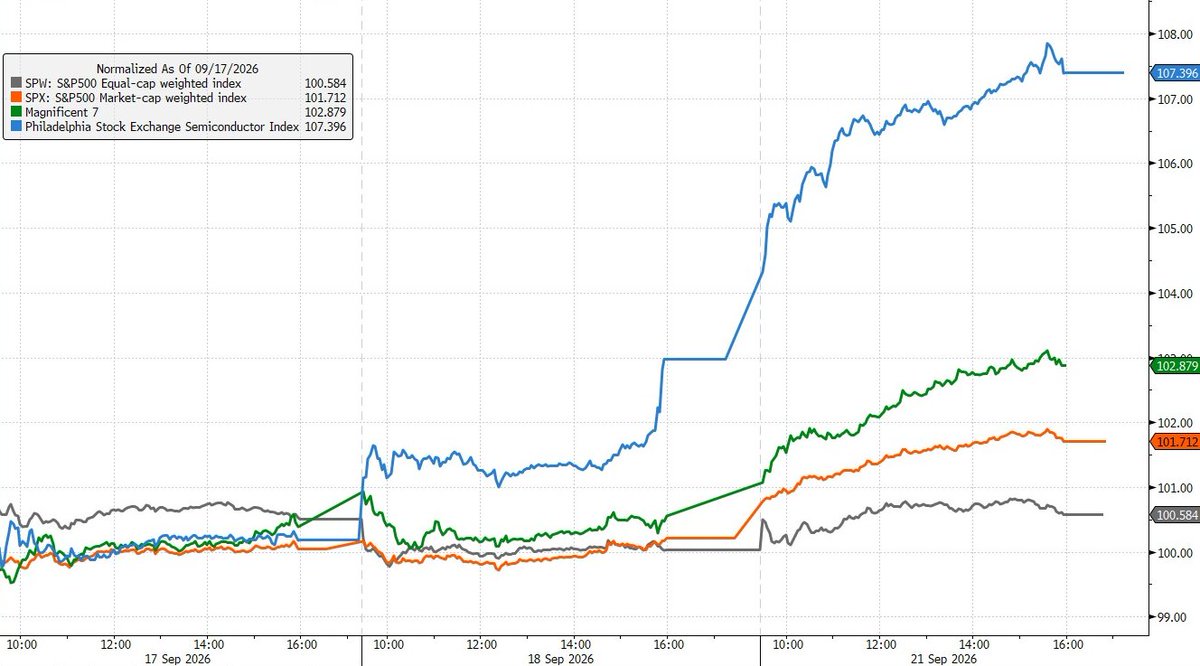
Major equity indices rebased to Sep 17, 2026 | The SOX leads at +7.4% and the Mag 7 at +2.9%, versus +1.7% cap-weighted and just +0.6% equal-weight, a size-led rally
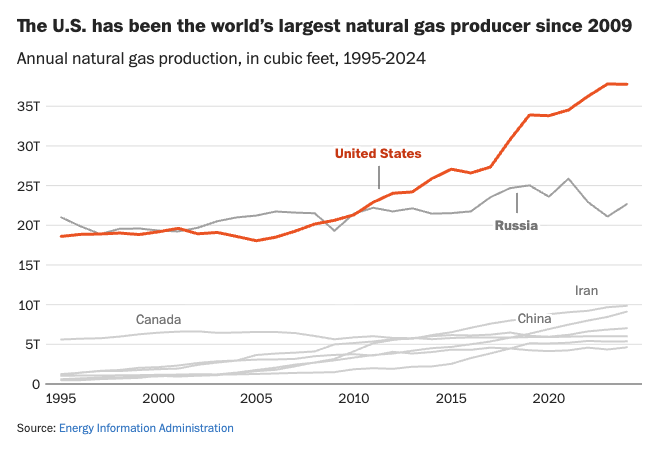
Annual natural gas production by country (cubic feet), 1995-2024 | The US leads at ~37T cubic feet, having overtaken Russia (~22T) in 2009
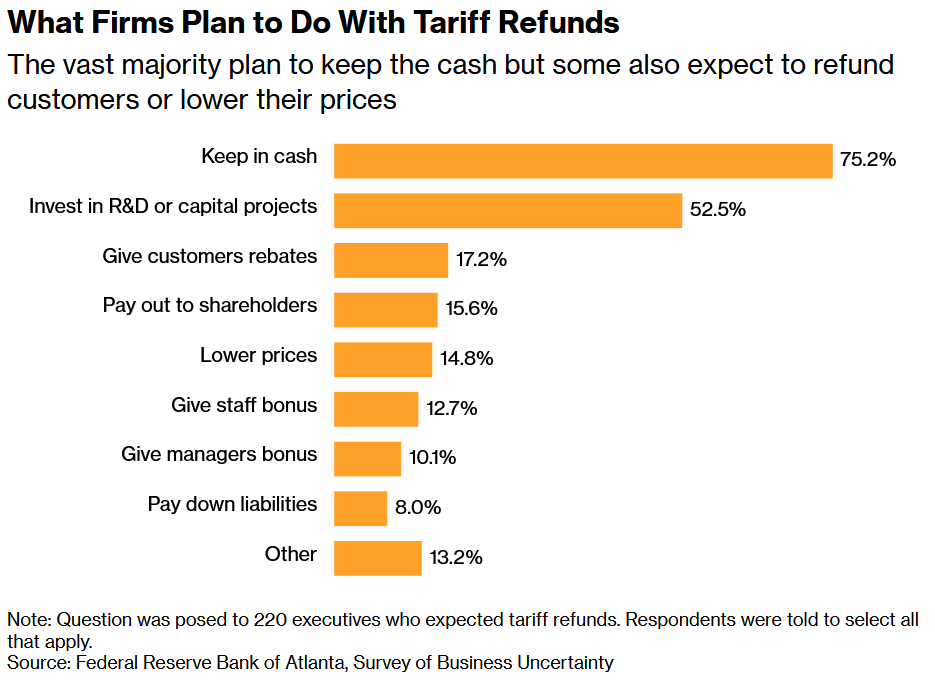
How firms plan to use tariff refunds, Atlanta Fed survey (multiple responses) | 75.2% keep it as cash and 52.5% invest in R&D or capex, while only 17.2% offer rebates and 14.8% lower prices
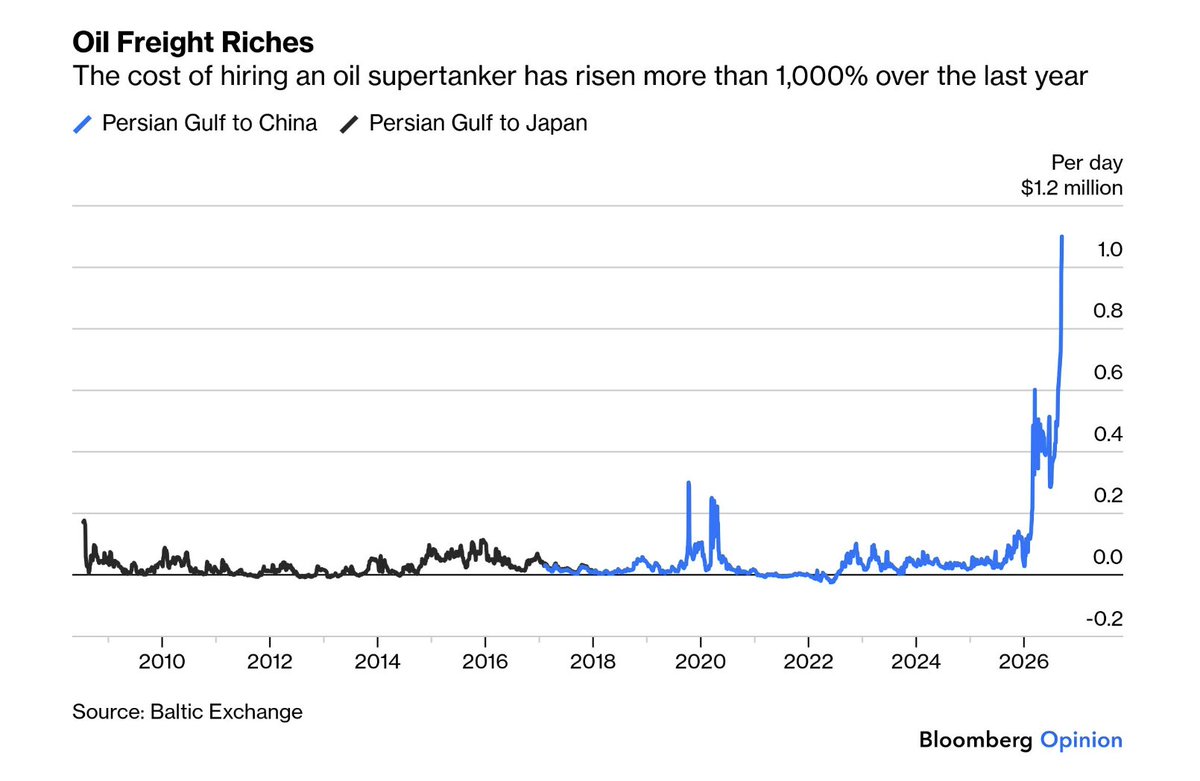
Cost of hiring an oil supertanker, Persian Gulf to China/Japan (per day), 2009-2026 | Recently spiked to about $1.1 million a day, a record, up more than 1,000% over the past year
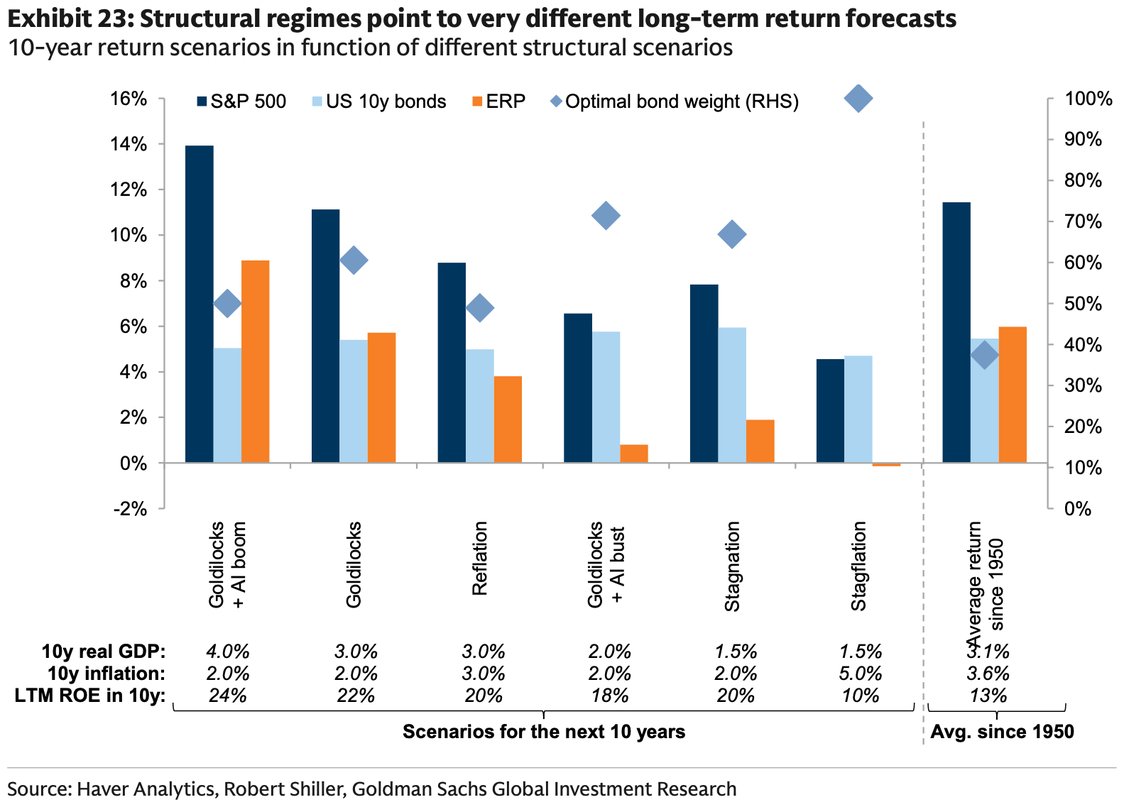
Goldman 10-year annualized return scenarios by structural regime | S&P 500 at 14% in "Goldilocks + AI boom" vs ~4.5% in stagflation
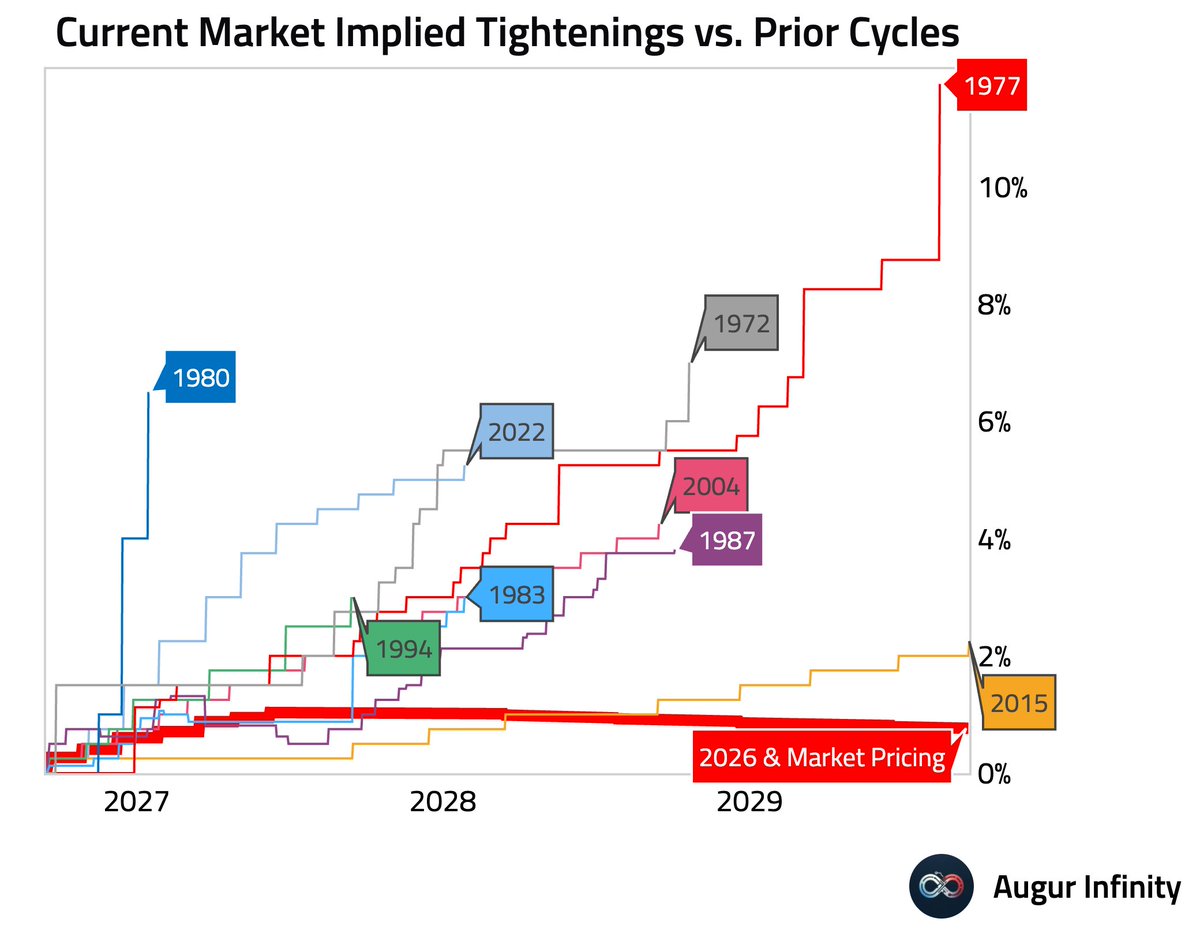
Cumulative market-implied tightening across cycles (%) | The 2026 market-priced path stays under 2%, far below prior cycles like 1980 and 2022
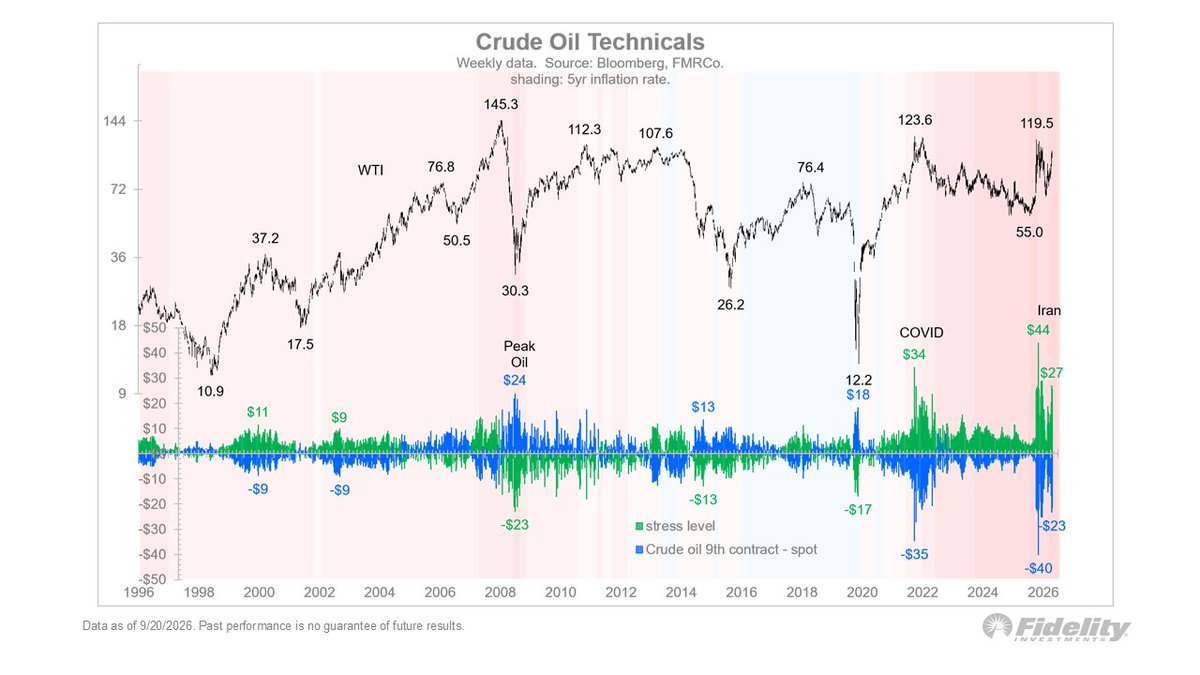
WTI crude weekly price and supply-stress gauges (since 1996, Fidelity) | Iran conflict lifted WTI to about $119.5, now back near $100 amid renewed supply stress
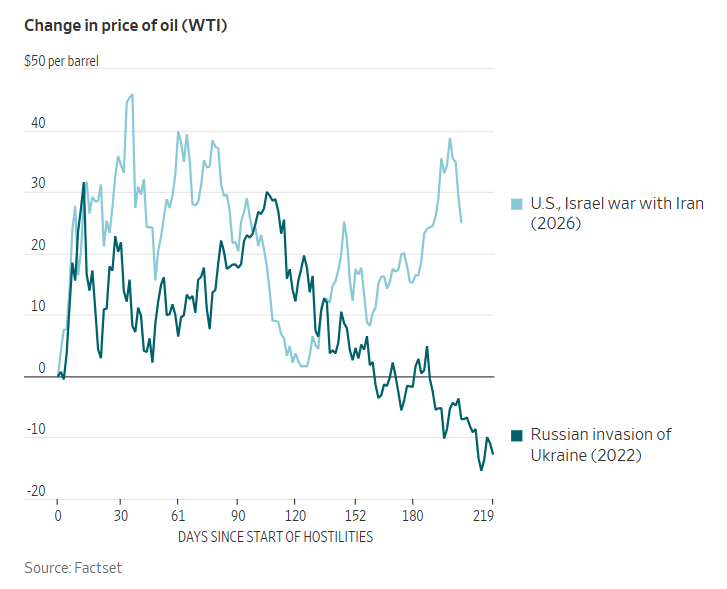
WTI change since the start of hostilities, Iran 2026 vs Russia-Ukraine 2022 (USD per barrel) | About 200 days out, oil is about $25 higher after the Iran strike but was about $7 lower after Russia's invasion
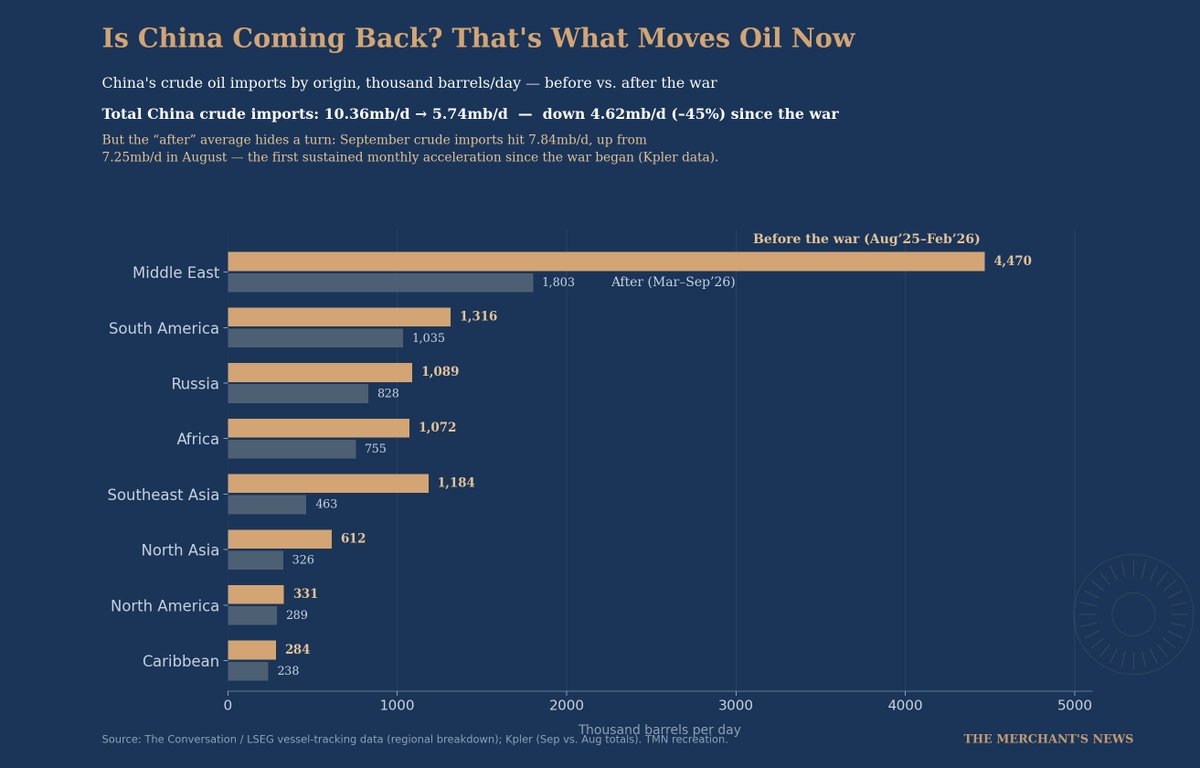
China crude oil imports by origin, before vs after the war (thousand barrels/day) | Total fell from 10.36mb/d to 5.74mb/d (-45%), with the Middle East down from 4,470 to 1,803 kb/d
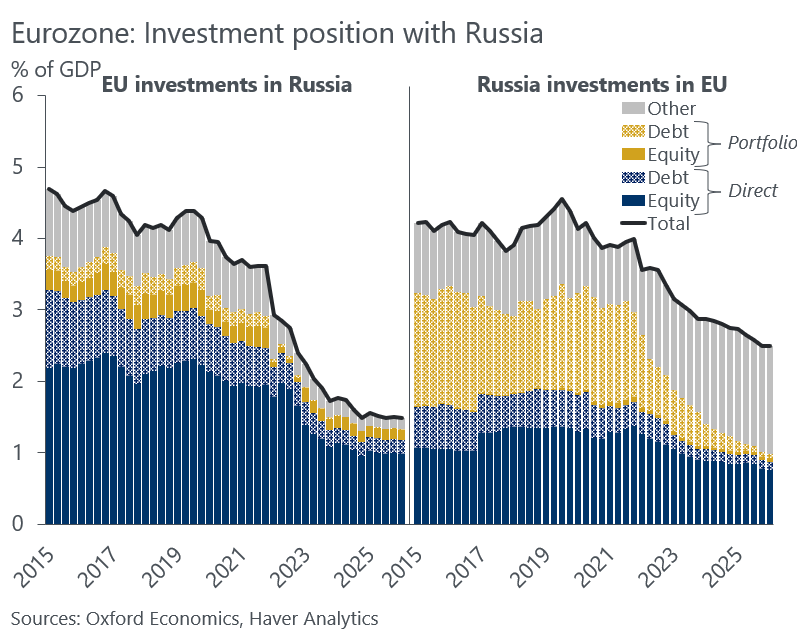
Eurozone and Russia two-way investment positions (% of GDP), 2015-2026 | EU investment in Russia fell from 4.7% to ~1.5%, Russia's in the EU from 4.2% to ~2.5%
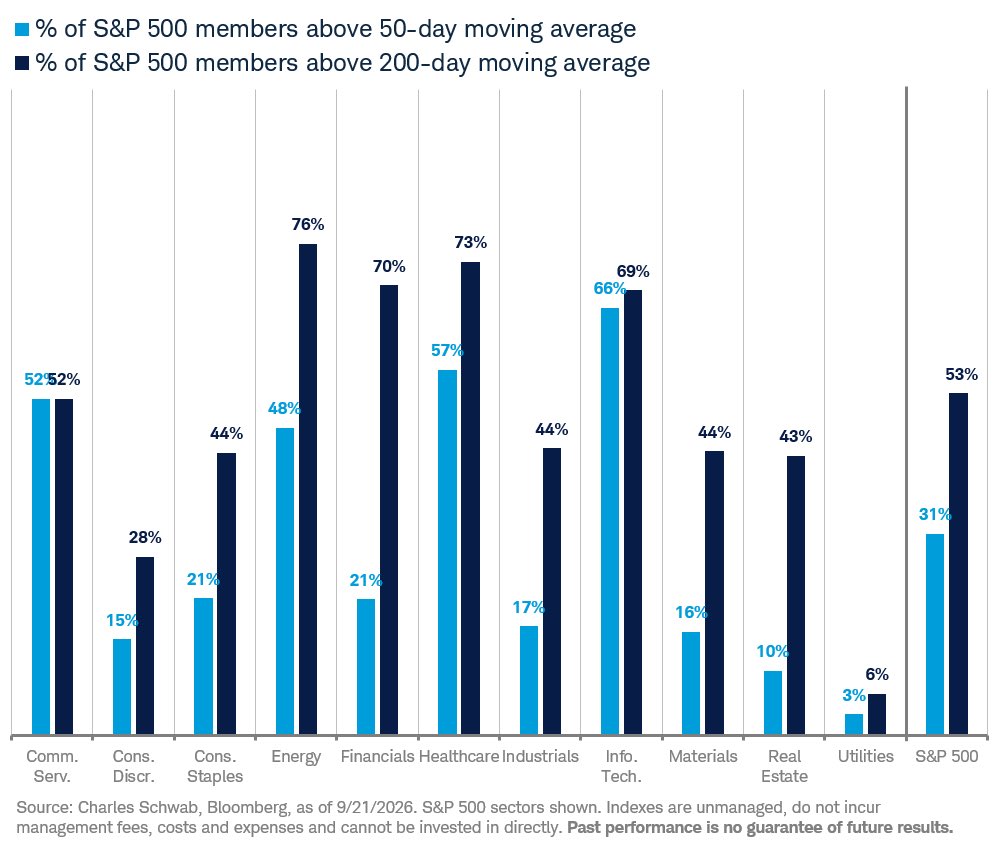
Share of S&P 500 members above their 50- and 200-day moving averages, by sector | Just 31% of the index is above its 50-DMA and 53% above its 200-DMA, with energy the broadest
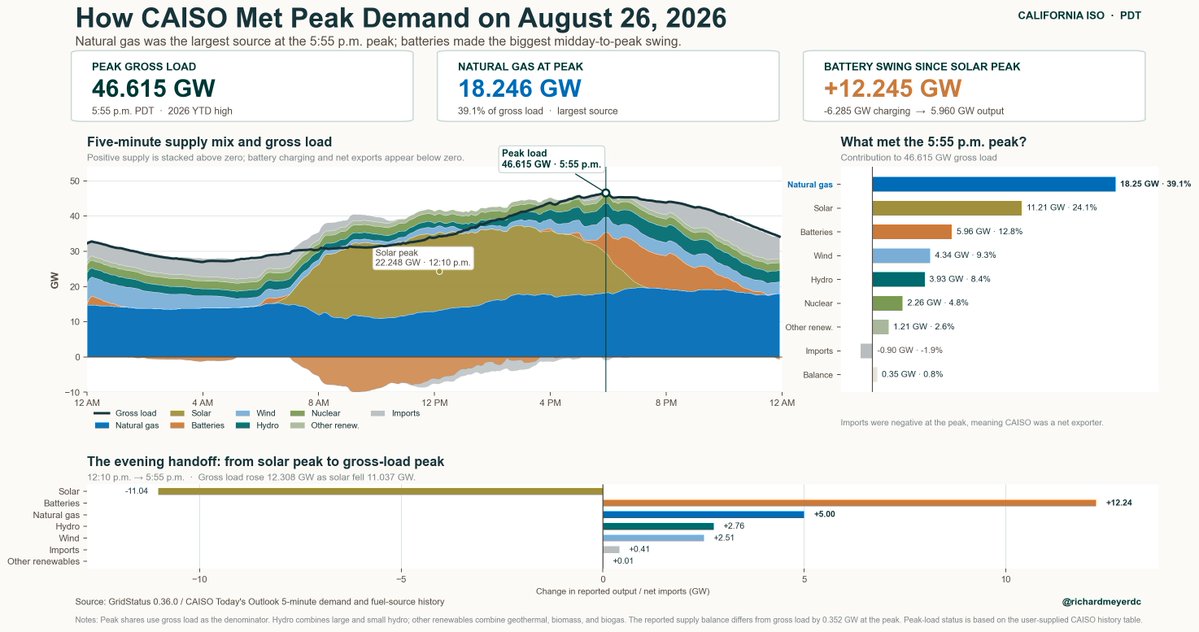
CAISO supply mix at the Aug 26 peak (five-minute data) | Peak load 46.6 GW, natural gas 18.2 GW (39%, largest), batteries +12.2 GW from the solar peak
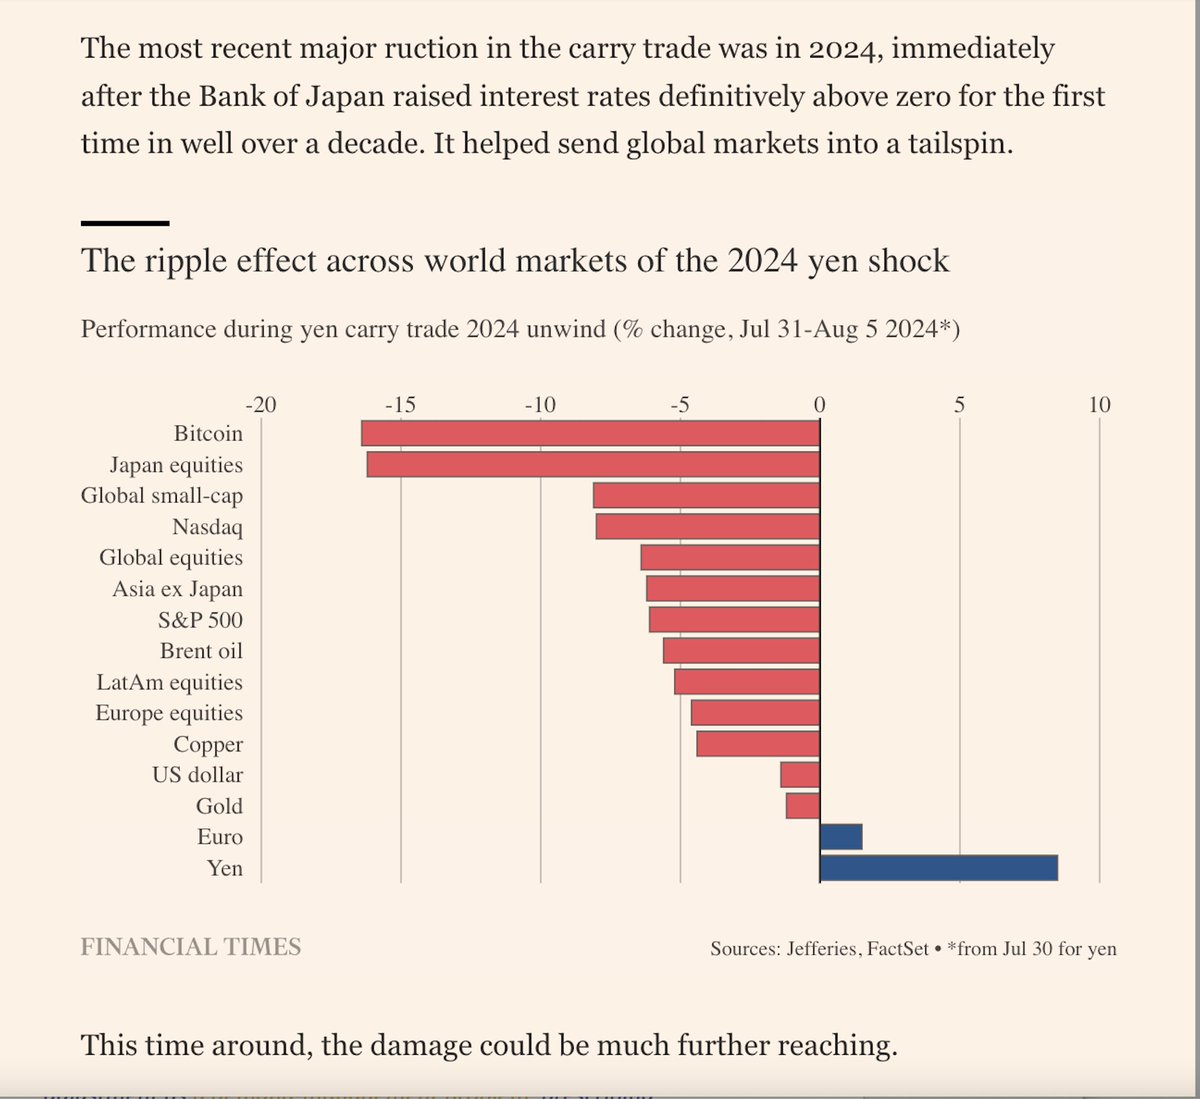
Asset performance during the 2024 yen carry unwind (%, Jul 31-Aug 5) | Bitcoin and Japan equities down ~15%, the yen up ~9%
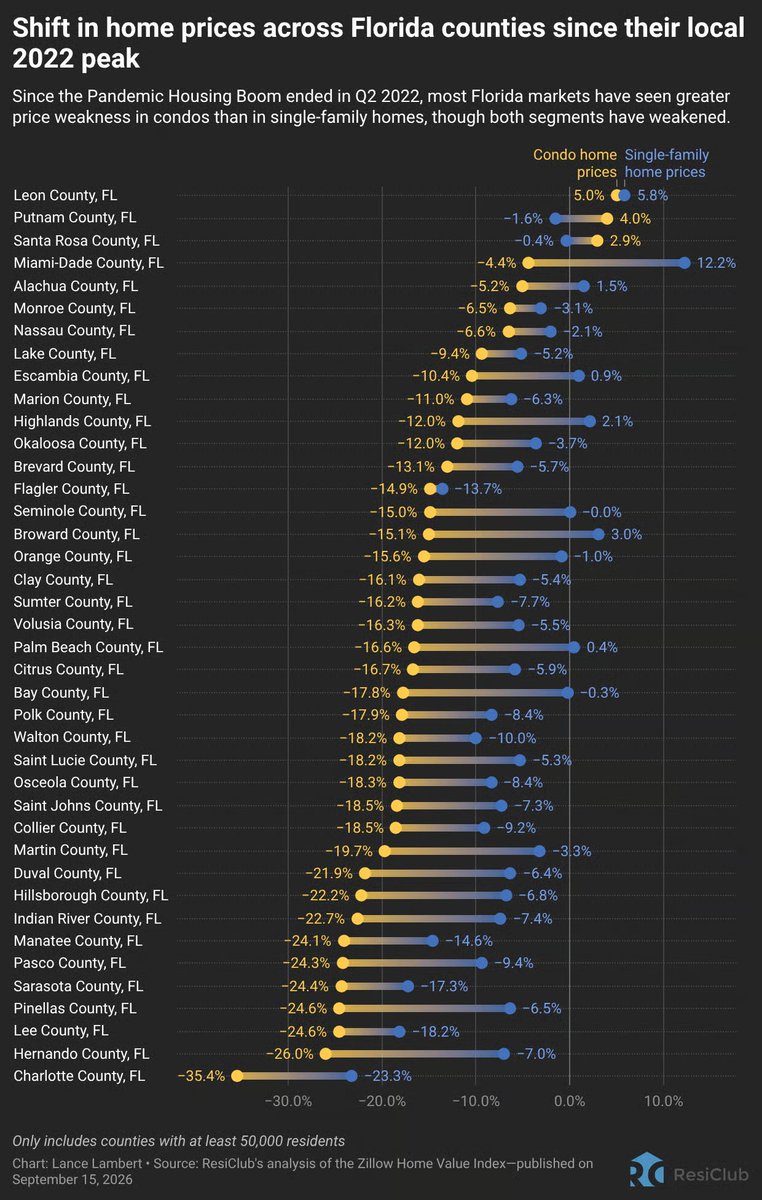
Florida county home-price change since local 2022 peak (condo vs single-family) | Condos down more broadly, Charlotte County condos -35.4%, Miami-Dade single-family +12.2%
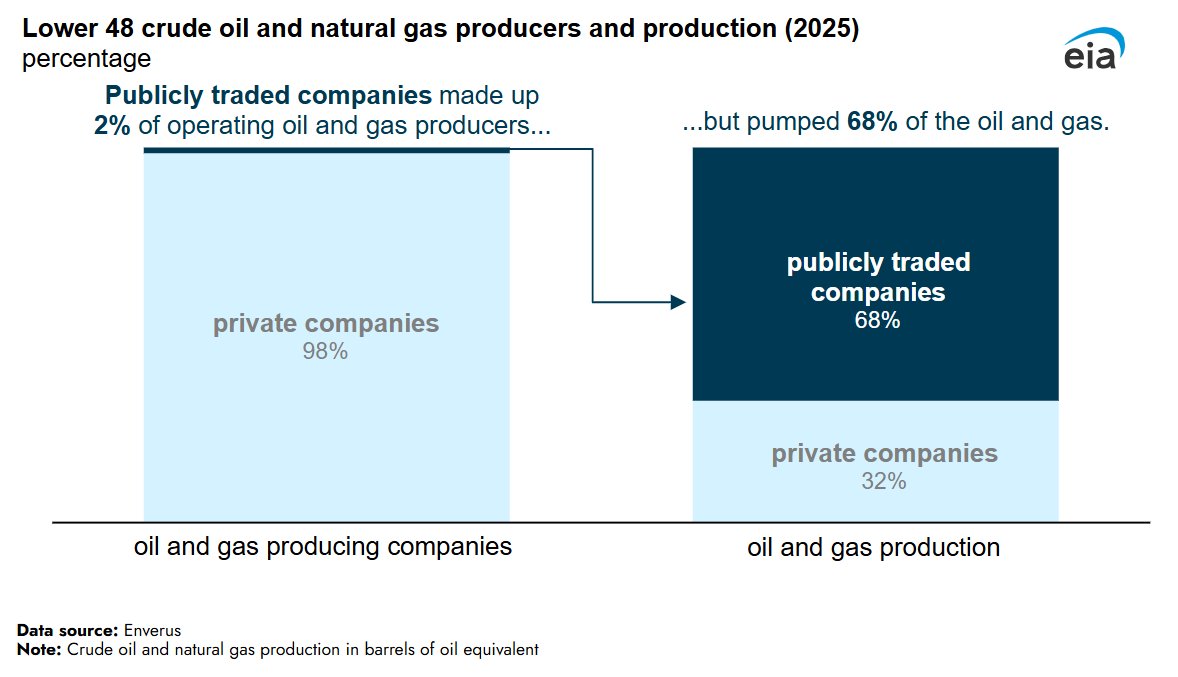
US Lower-48 oil & gas producers vs production share (2025) | Public companies are 2% of producers but 68% of output; private firms are 98% of producers but 32% of output
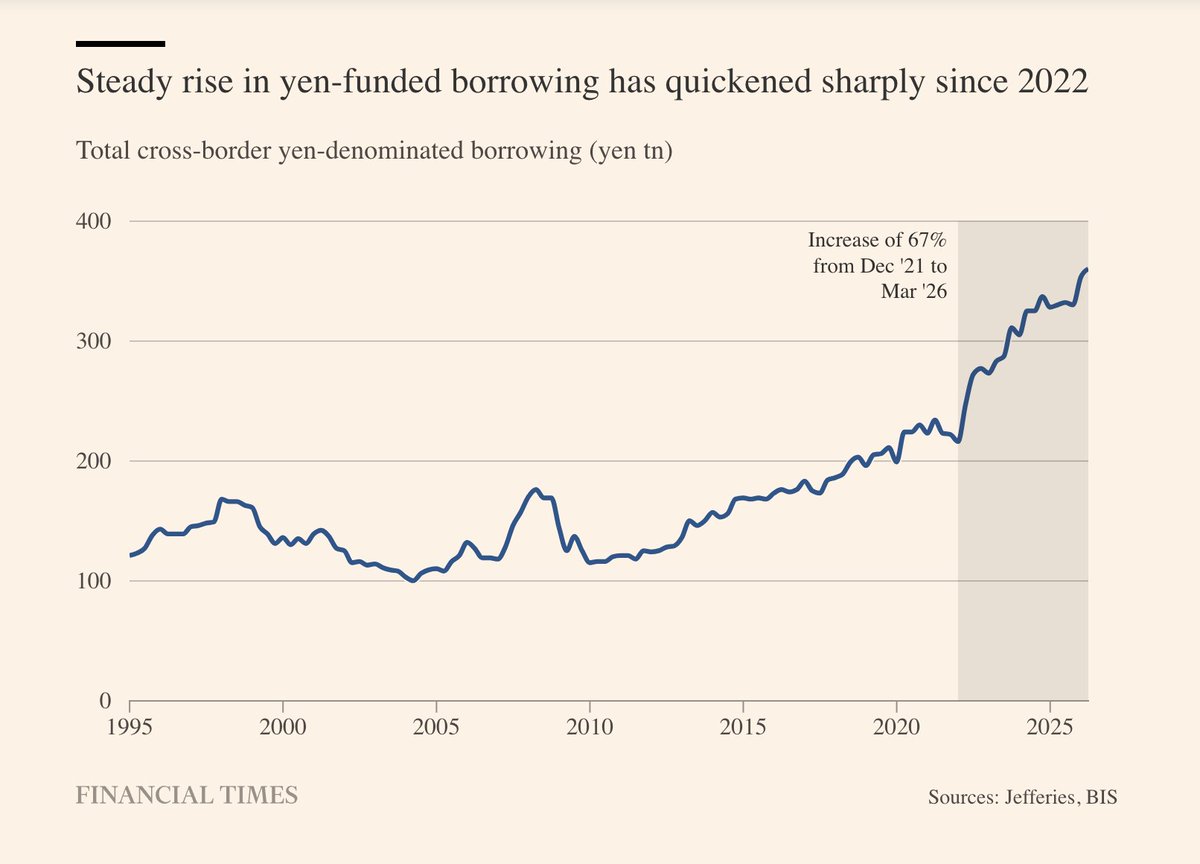
Total cross-border yen-denominated borrowing (yen tn, since 1995) | About ¥360tn as of March 2026, a 67% rise from December 2021 (about $2.3tn)
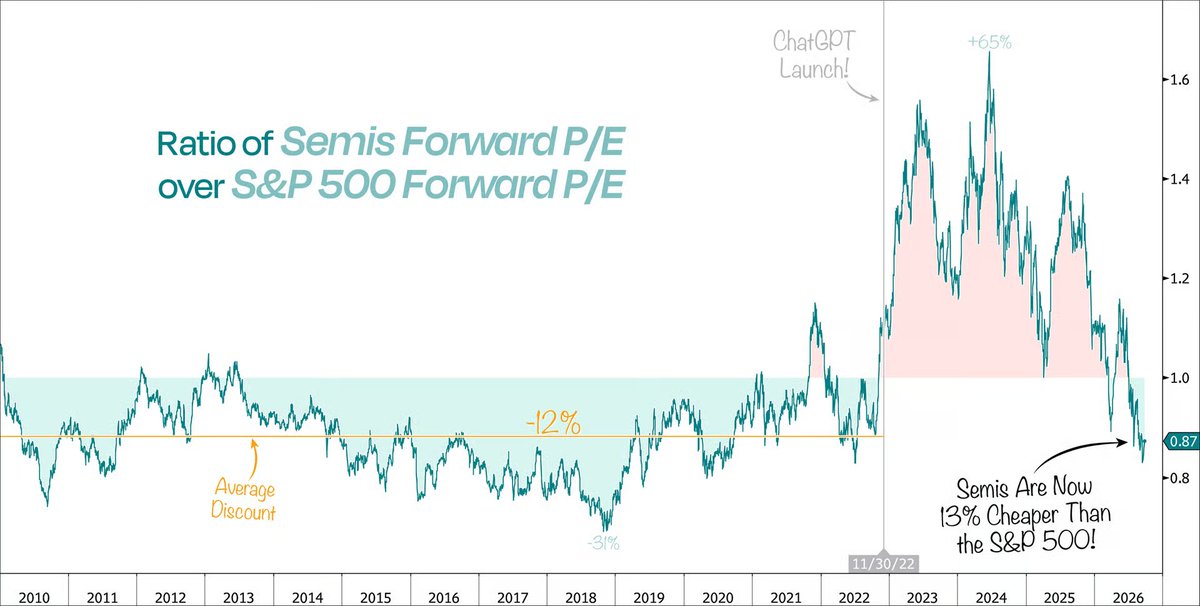
Semis forward P/E ÷ S&P 500 forward P/E, 2010-2026 | Ratio at 0.87, a 13% discount vs the -12% long-run average
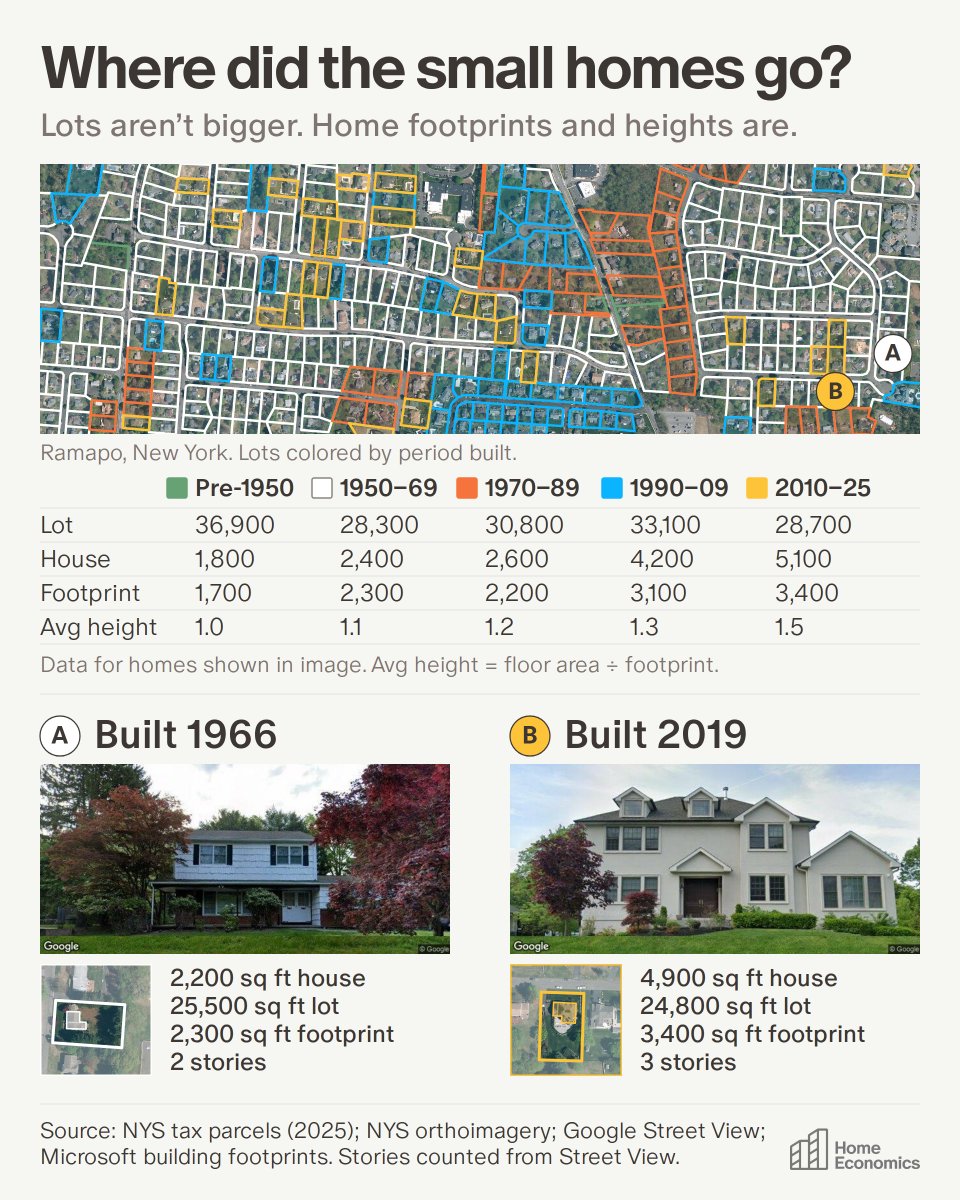
Ramapo, NY homes vs lot size by build era (sq ft) | Houses grew from 1,800 (pre-1950) to 5,100 (2010-25) as lots held near 28,000-37,000
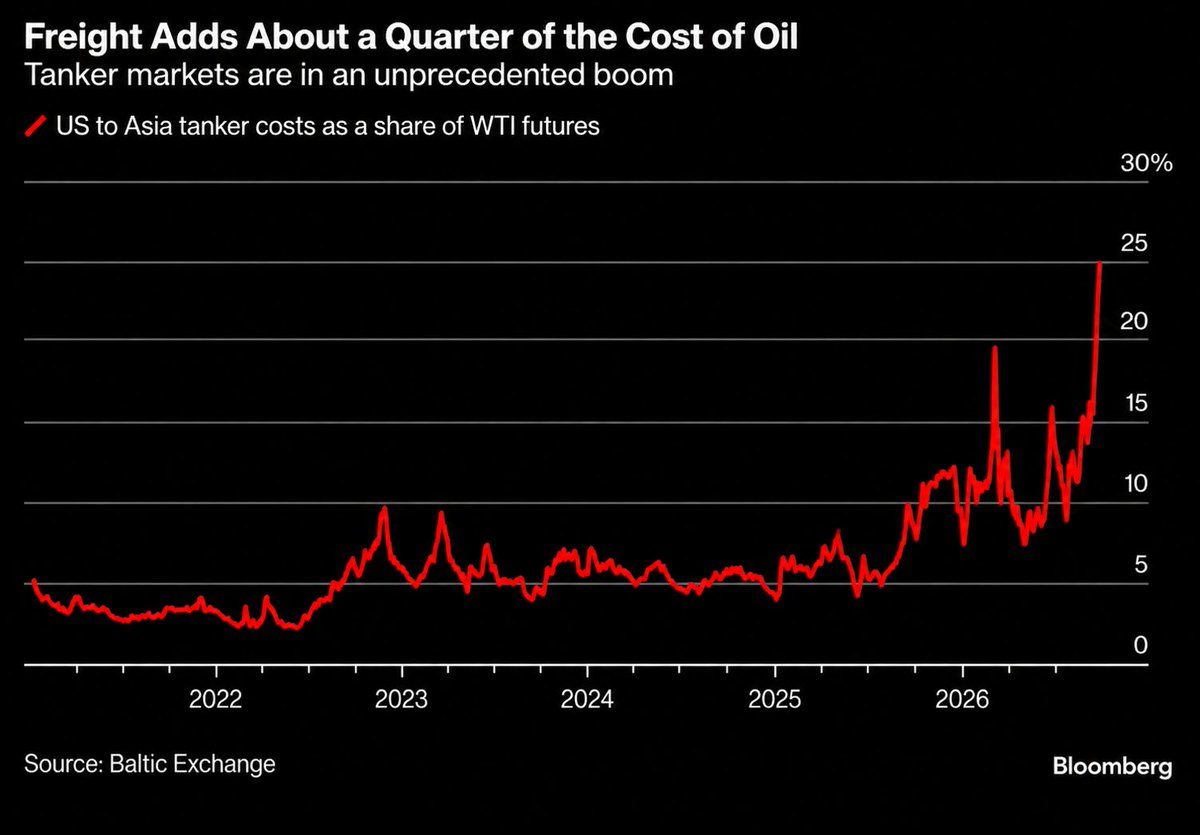
US-to-Asia tanker costs as a share of WTI futures, 2022-2026 | Recently spiked to ~25%, a record high, versus a typical ~4%
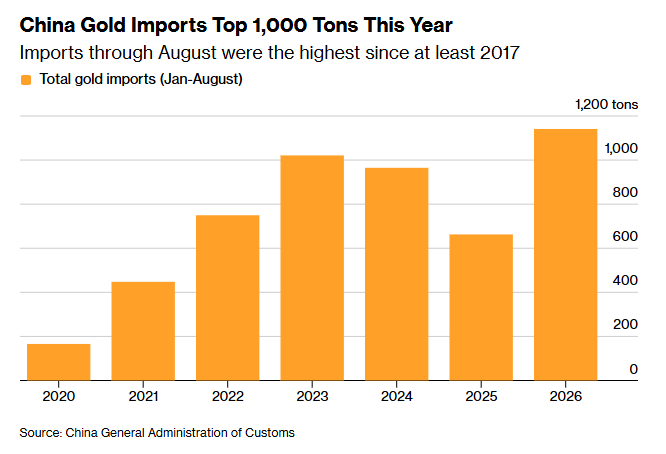
China gold imports (January-August, tonnes), 2020-2026 | About 1,141 tonnes through August 2026, the highest since at least 2017
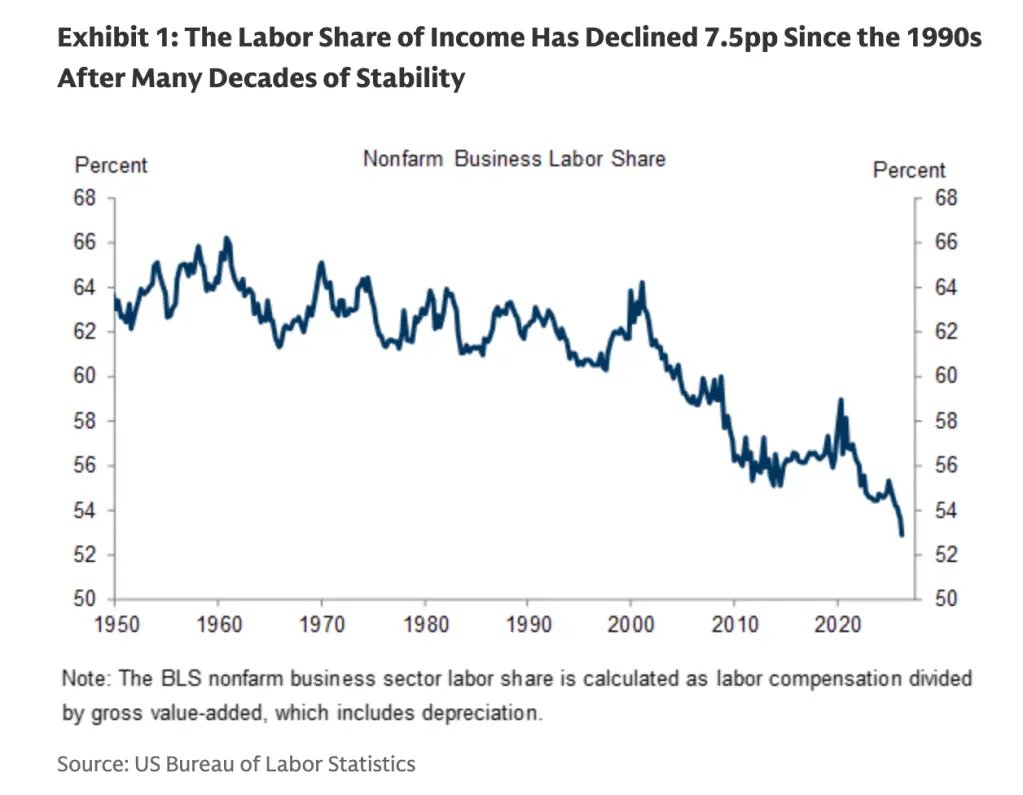
US nonfarm business labor share of income, 1950-2026 | Down to about 53%, a record low, roughly 7.5pp below its 1990s level
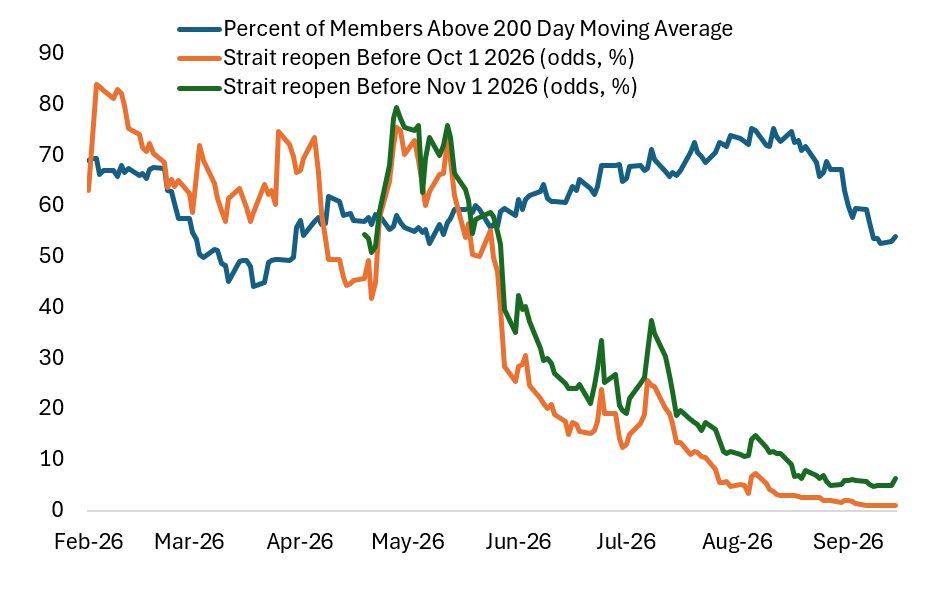
S&P members above their 200-day average vs Strait-reopening odds, 2026 | Reopening odds fell from 70-80% in spring to single digits, breadth now around 53%
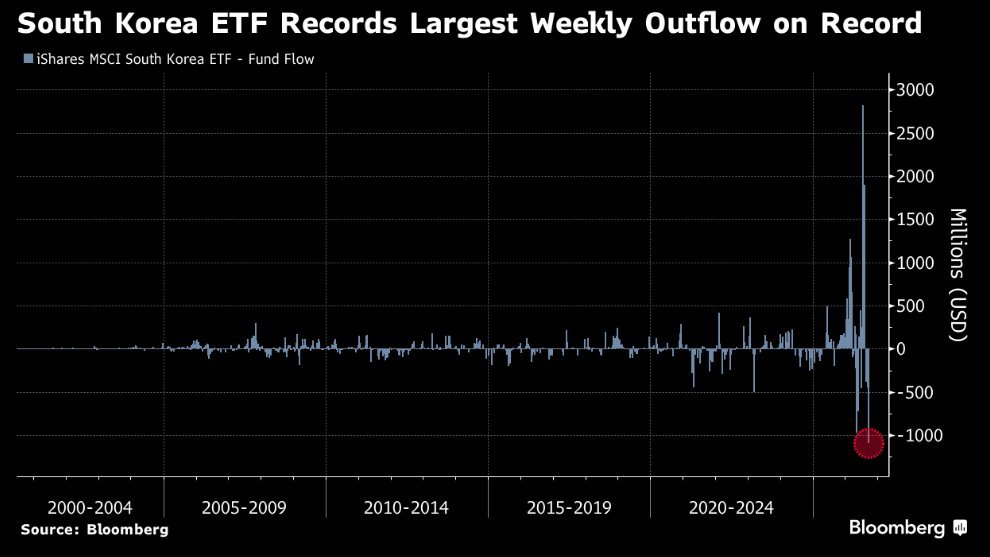
iShares MSCI South Korea ETF weekly fund flow (USD millions) | Latest week about $1 billion of net outflows, the largest on record since 2000
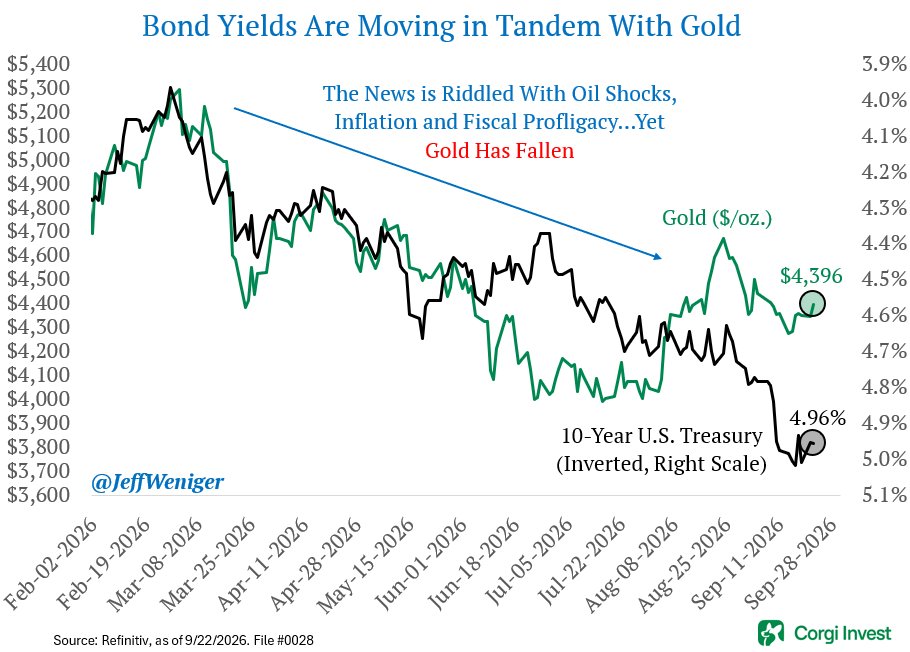
Gold price vs 10-year US Treasury yield (inverted, RHS), 2026 | Gold at $4,396/oz and the 10-year yield at 4.96%, moving together
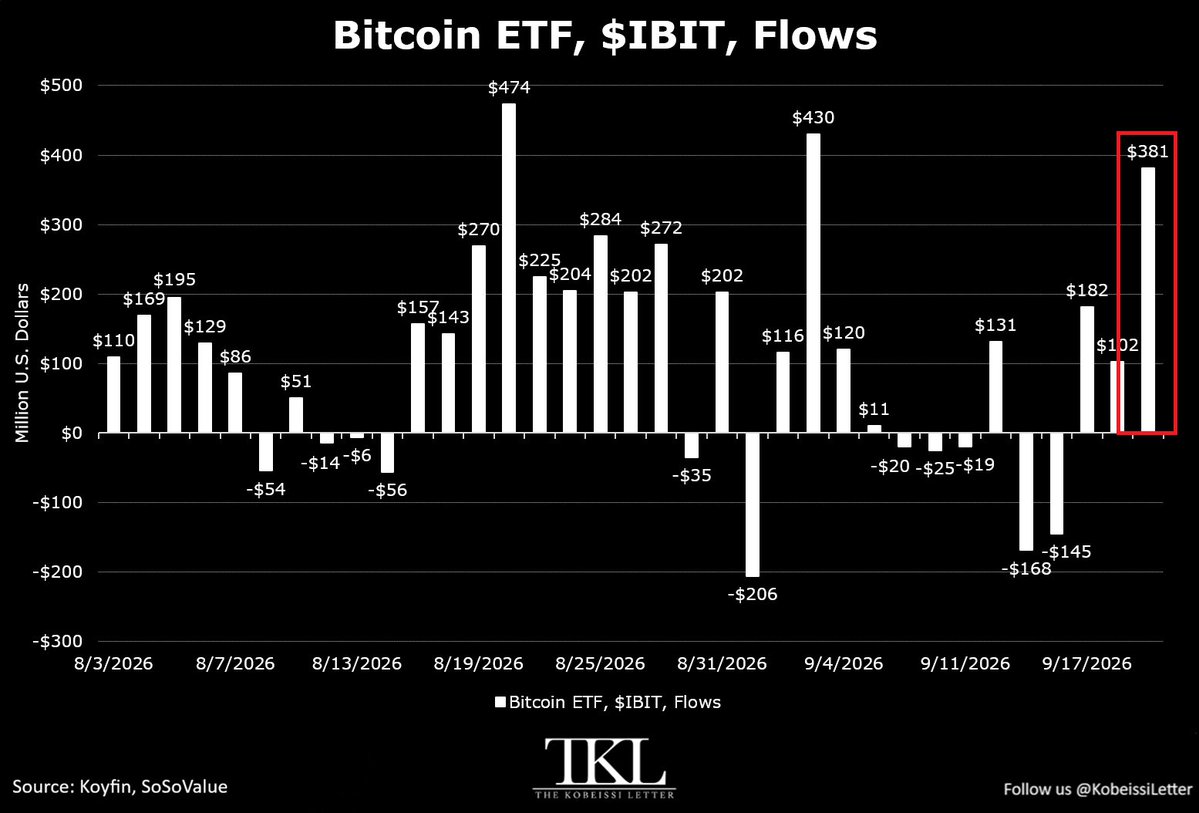
$IBIT daily net flows, Aug-Sep 2026 | The latest day's $381M inflow is the largest in two weeks after a run of outflows
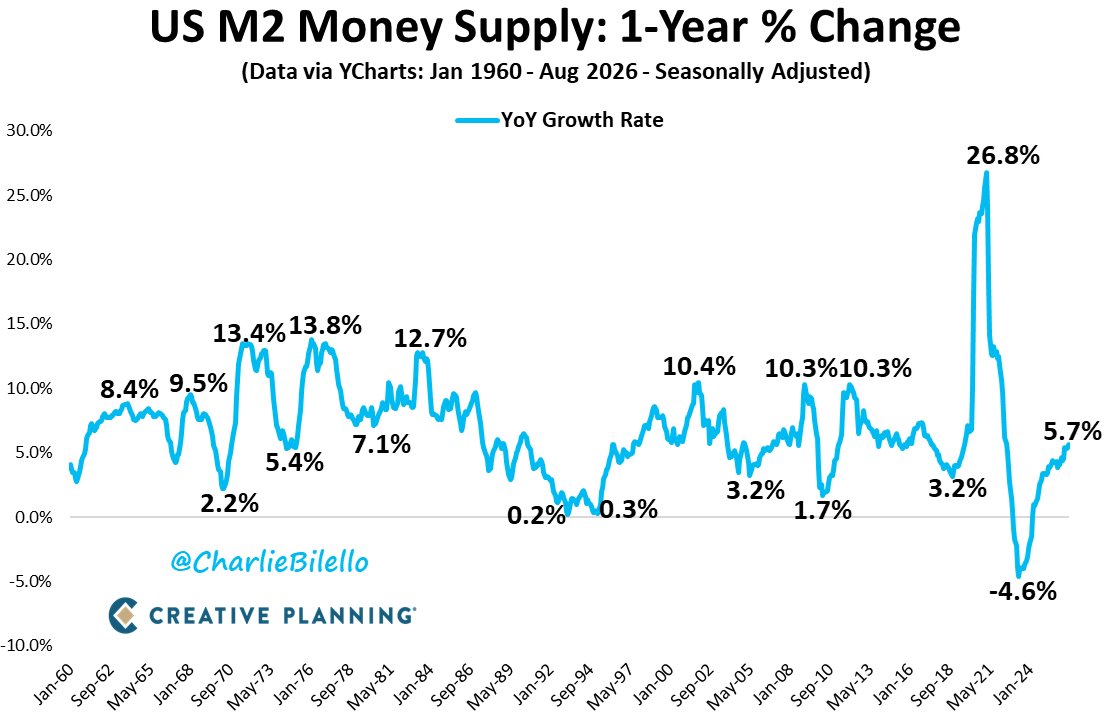
US M2 money supply, YoY growth, 1960-2026 | Now 5.7%, the biggest year-over-year rise since June 2022
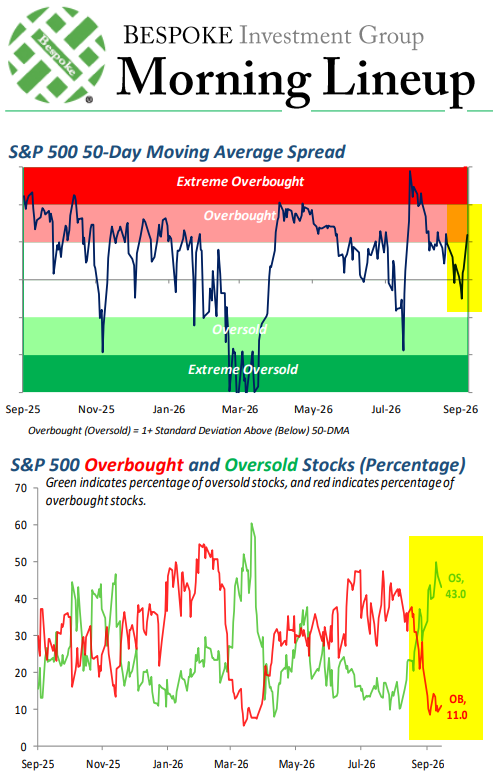
S&P 500 50-day MA spread and overbought/oversold members | Index price overbought while 43% of members are oversold vs only 11% overbought
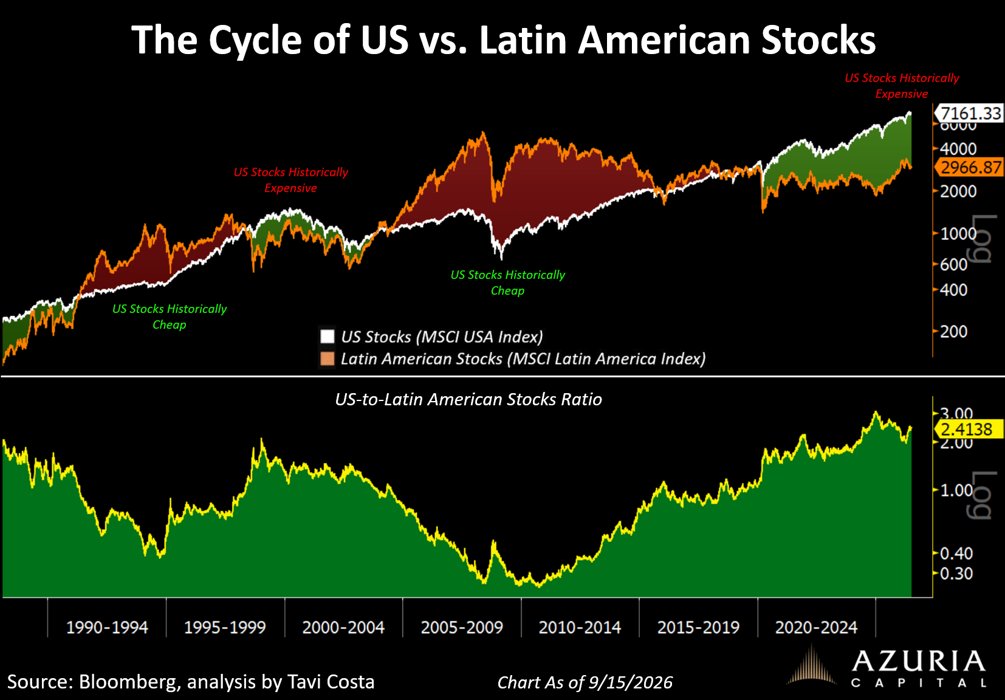
US stocks (MSCI USA) vs Latin American stocks (MSCI LatAm) and their ratio, 1990-2026 | Ratio at 2.41 near record highs, marking US stocks historically expensive
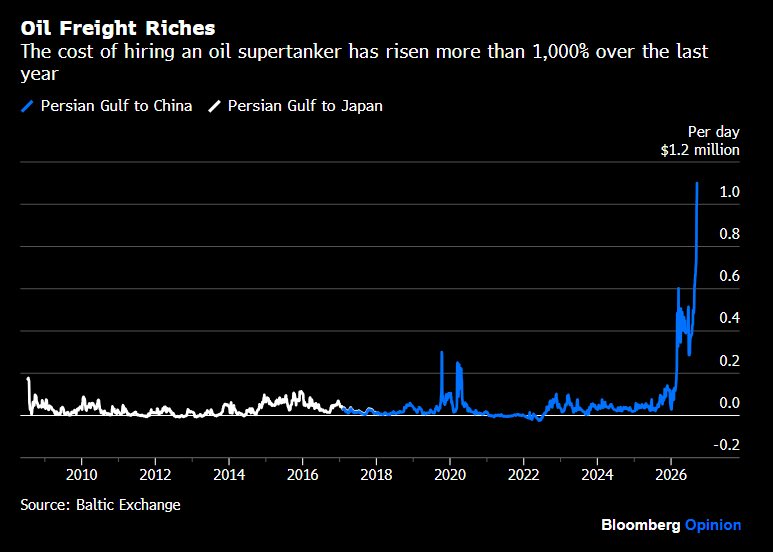
Supertanker rates, Persian Gulf to China/Japan (USD per day) | Gulf-China near $1 million/day, up more than 1,000% over the past year and a record
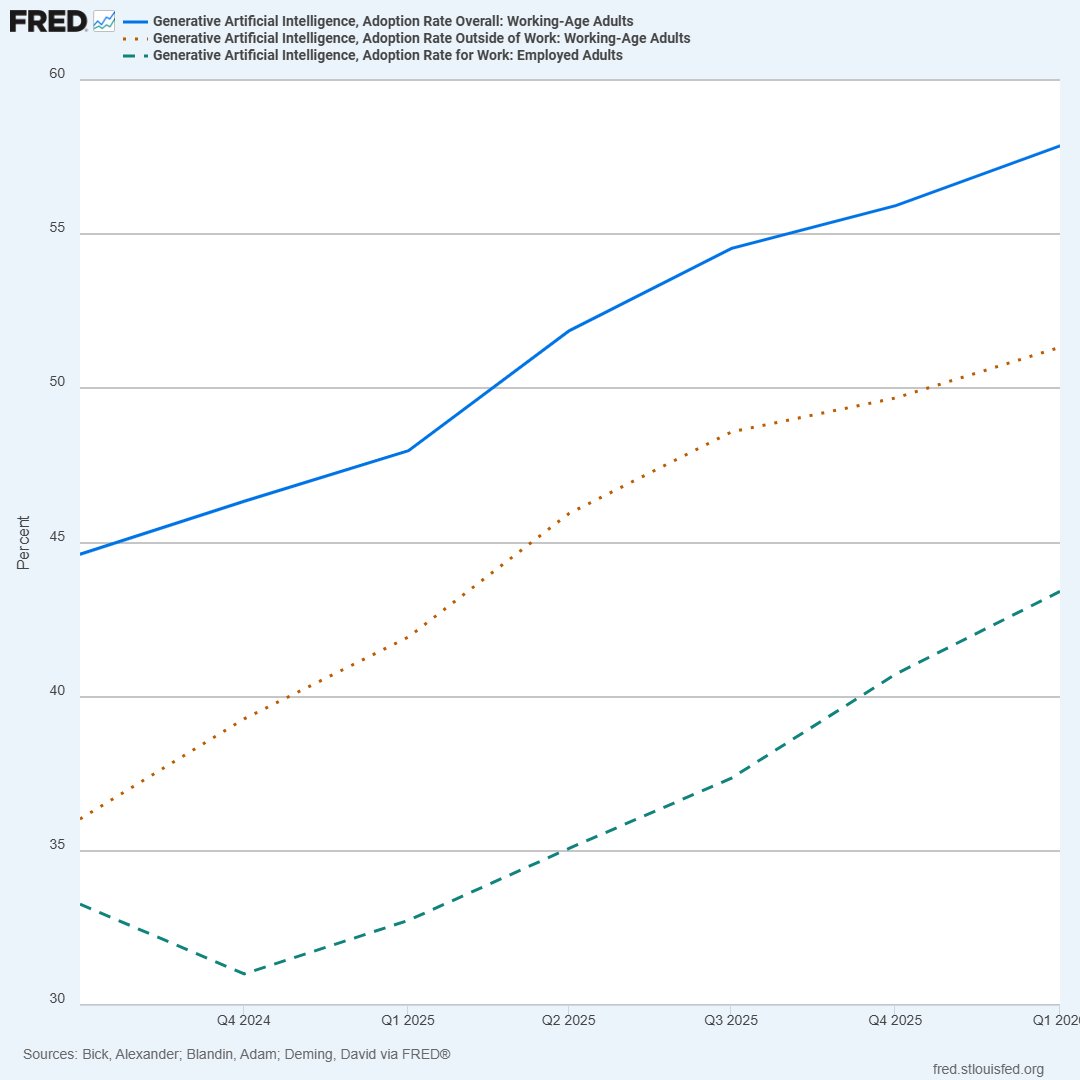
US generative-AI adoption rate (overall / outside work / for work), Q3 2024-Q1 2026 | Overall near 58%, outside-work ~51%, for-work up to ~43%
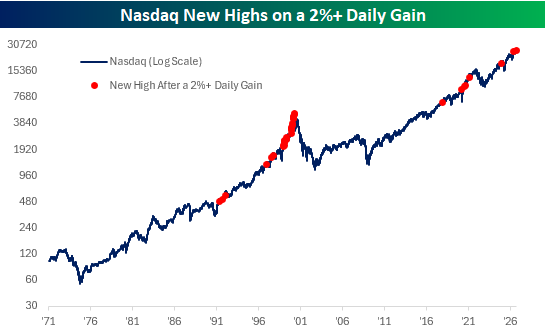
Nasdaq (log scale) new highs paired with a 2%+ daily gain, 1971-2026 | The latest is the 37th such occurrence on record
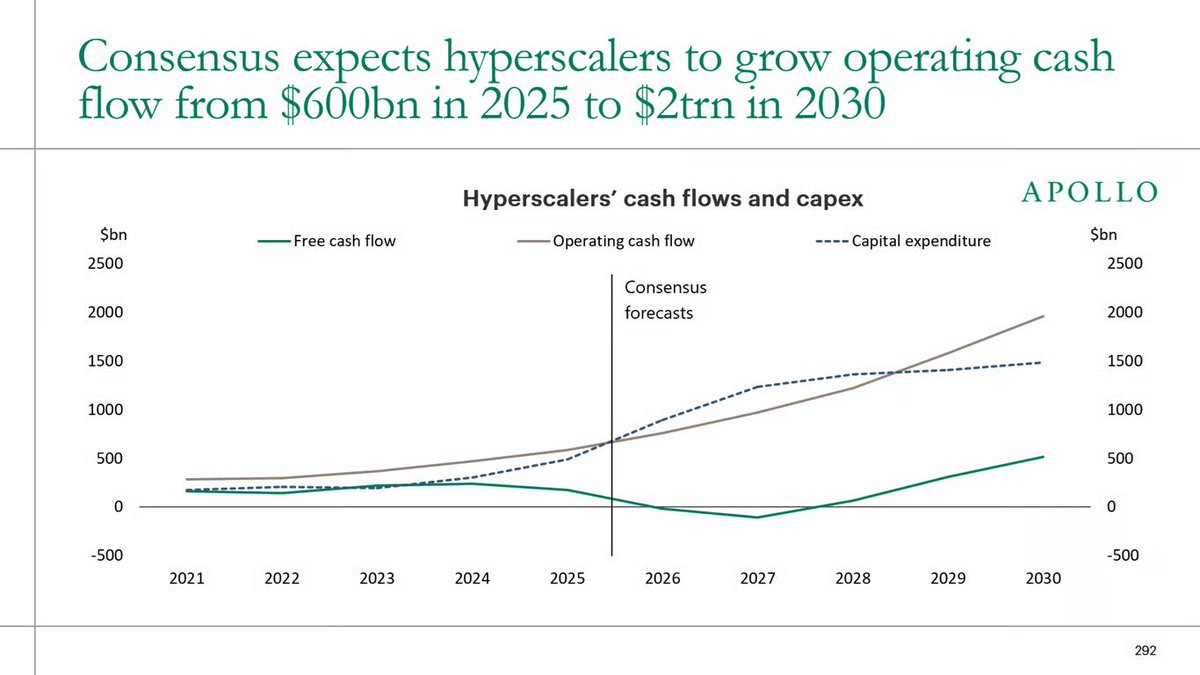
Hyperscalers' cash flows and capex, 2021-2030 | Operating cash flow is expected to climb from $600bn in 2025 to $2trn by 2030, while free cash flow lags
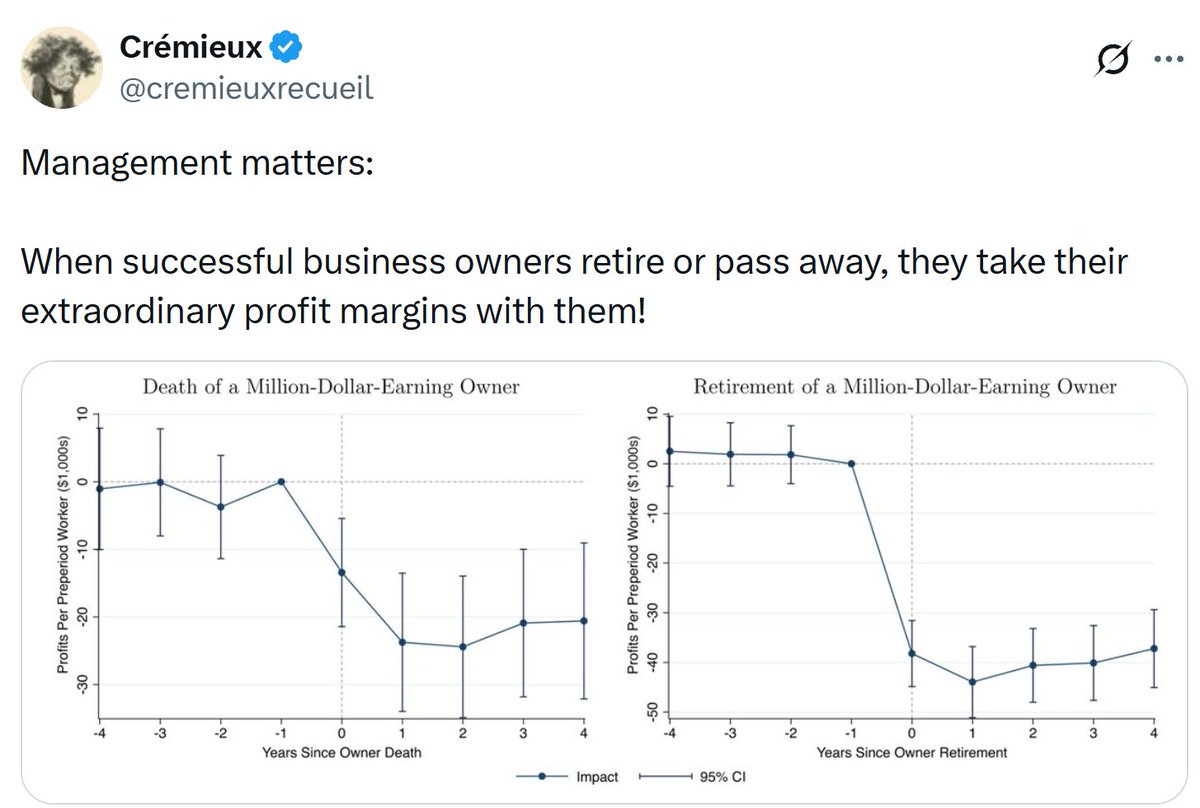
Event study of profits per worker around owner death/retirement (US$ thousands) | Profits fall about $24k per worker after death and about $40k after retirement, both statistically significant
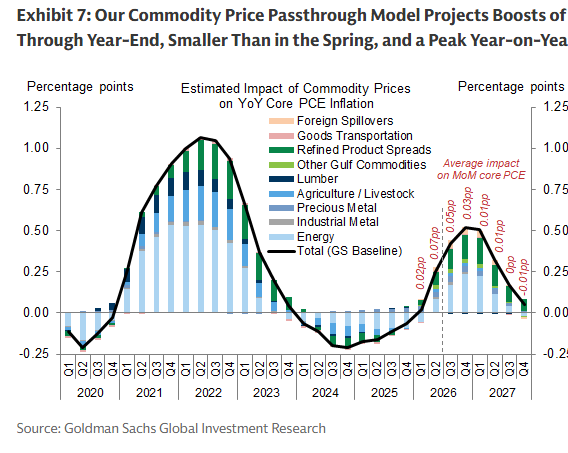
Estimated impact of commodity prices on YoY core PCE inflation, 2020-2027 | Peak impact of ~0.5pp in 2026Q4, smaller than the 2022 surge, with a ~3-5bp monthly boost through year-end
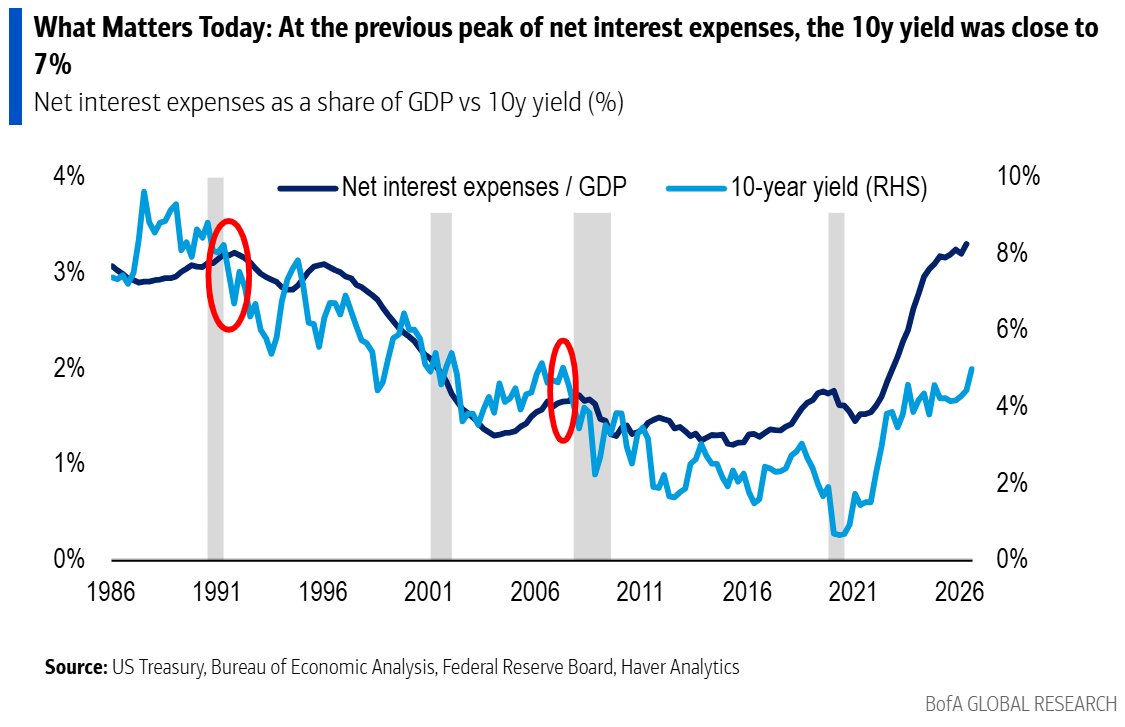
US net interest expense as a share of GDP vs 10-year yield (since 1986) | Net interest near 3.3% of GDP, the highest shown, while the 10Y sits at about 4.5% (vs about 7% at the 1991 peak)
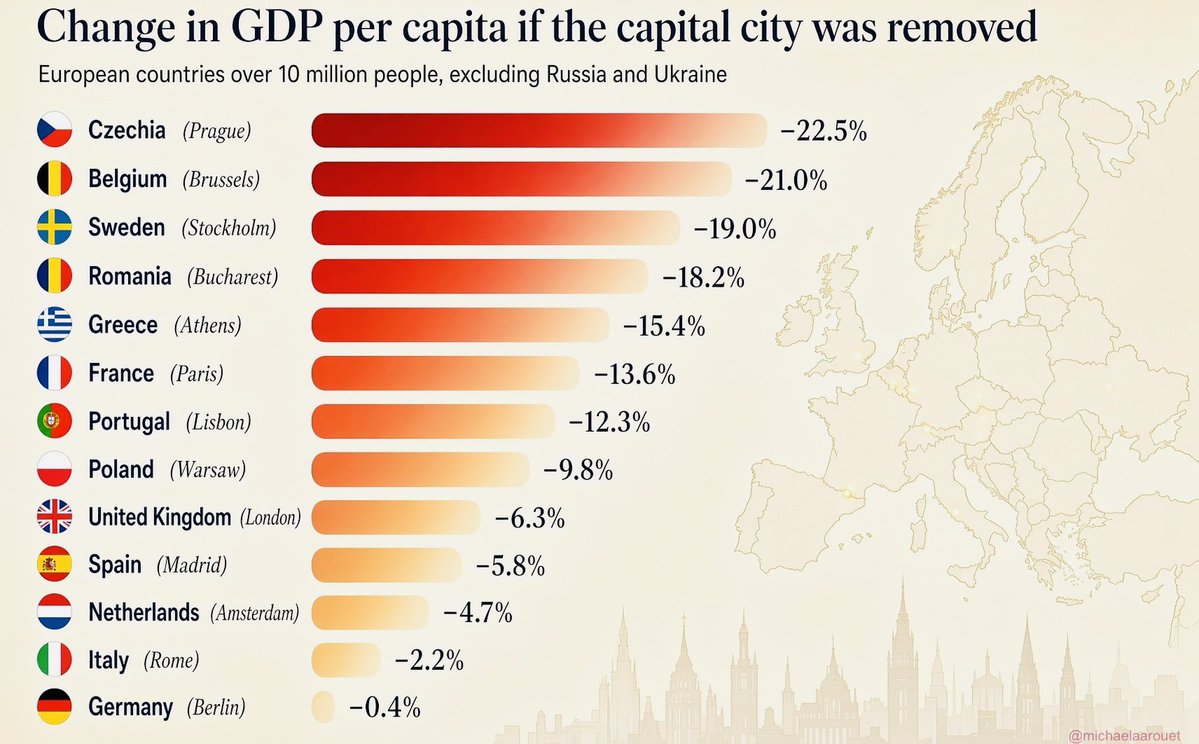
Change in GDP per capita after removing the capital city (European countries over 10m, ex-Russia/Ukraine) | Czechia (Prague) -22.5% the largest, Germany (Berlin) just -0.4%
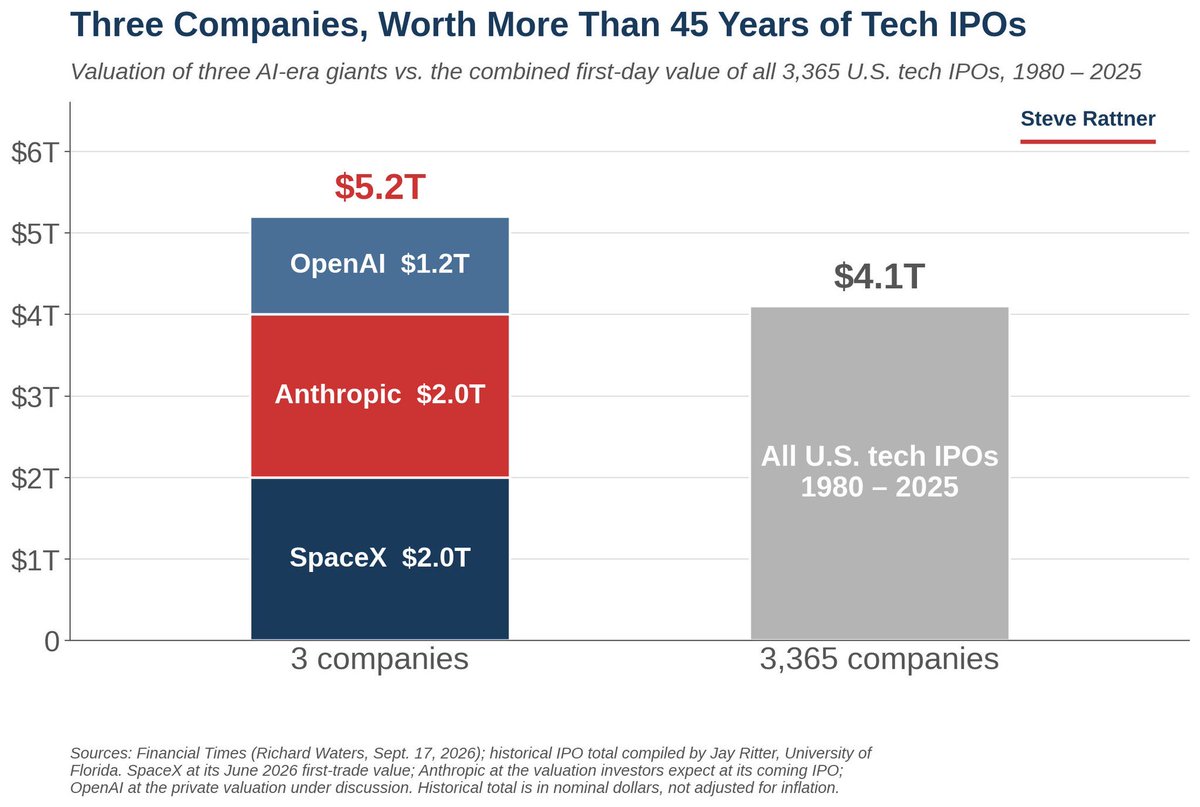
Valuation of three AI-era giants vs. combined first-day value of all 3,365 US tech IPOs since 1980 | OpenAI+Anthropic+SpaceX total $5.2T, above the 3,365-company $4.1T
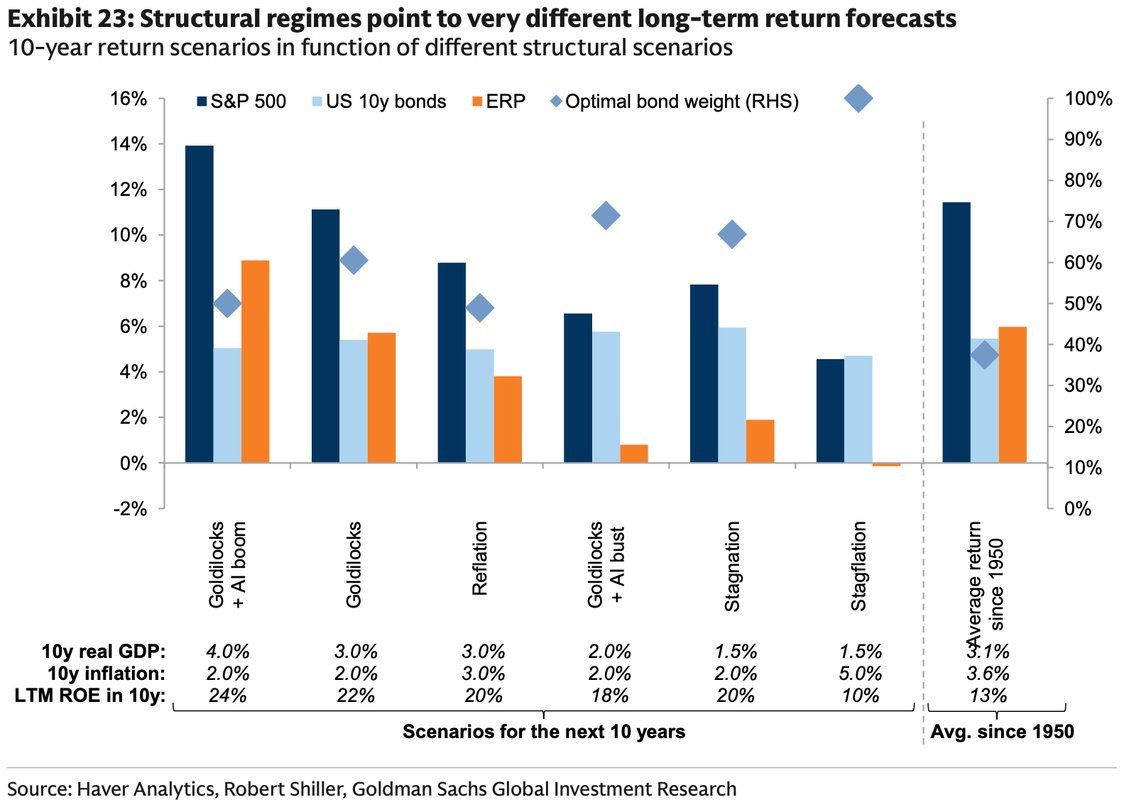
GS 10-year return forecasts by structural regime | S&P 500 ~14% a year in a Goldilocks+AI boom versus ~4% under stagflation
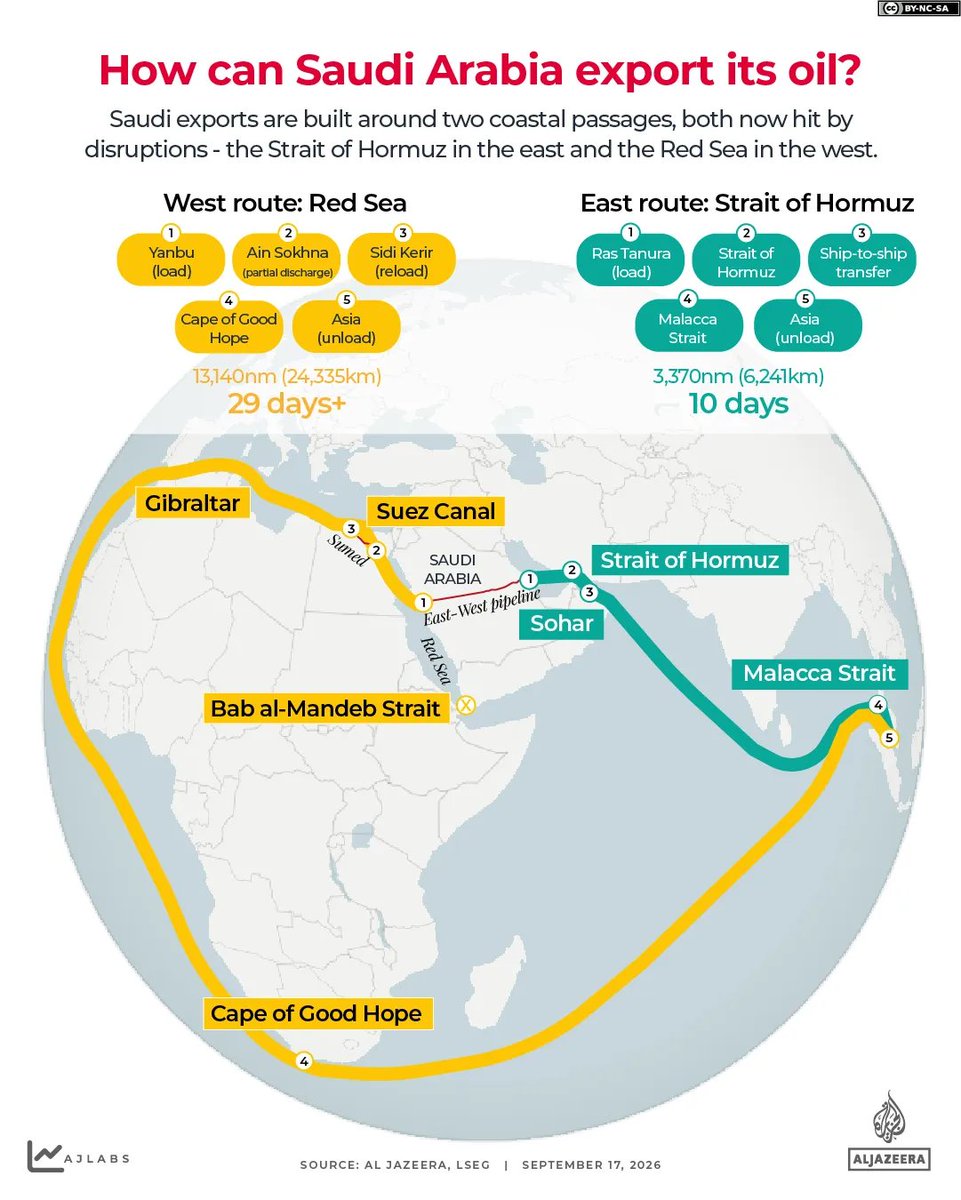
Saudi Arabia's Red Sea and Hormuz oil export routes | Cape of Good Hope route is 29+ days vs 10 days via Hormuz
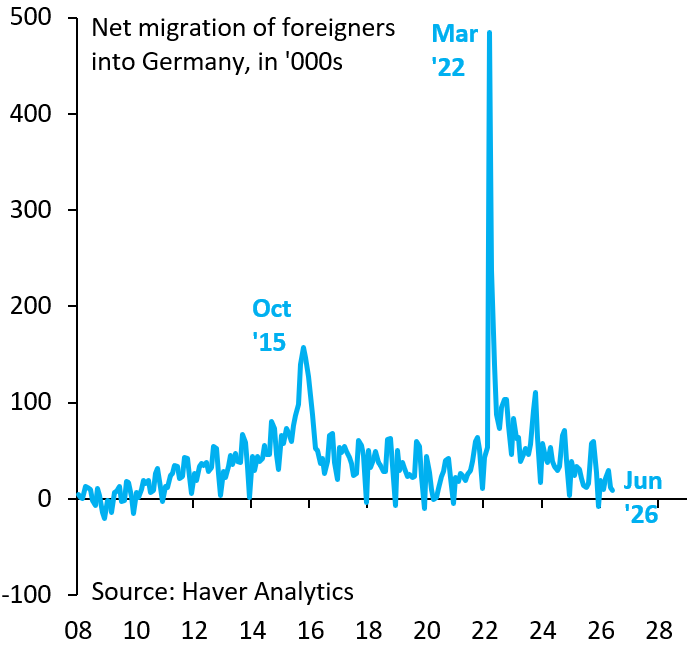
Net migration of foreigners into Germany, in thousands | Down to near zero in June 2026, far below the ~480k peak of March 2022
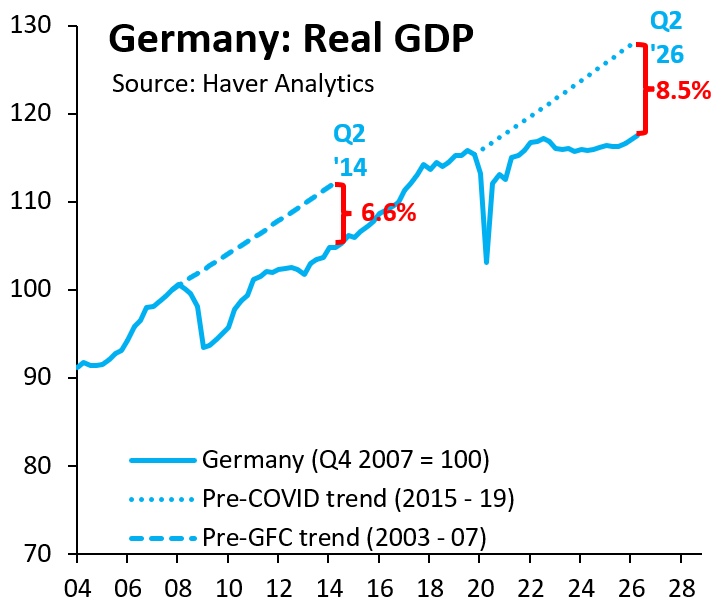
Germany real GDP vs pre-COVID and pre-GFC trends (2007=100) | Now ~8.5% below the pre-COVID trend, wider than 2014's 6.6%
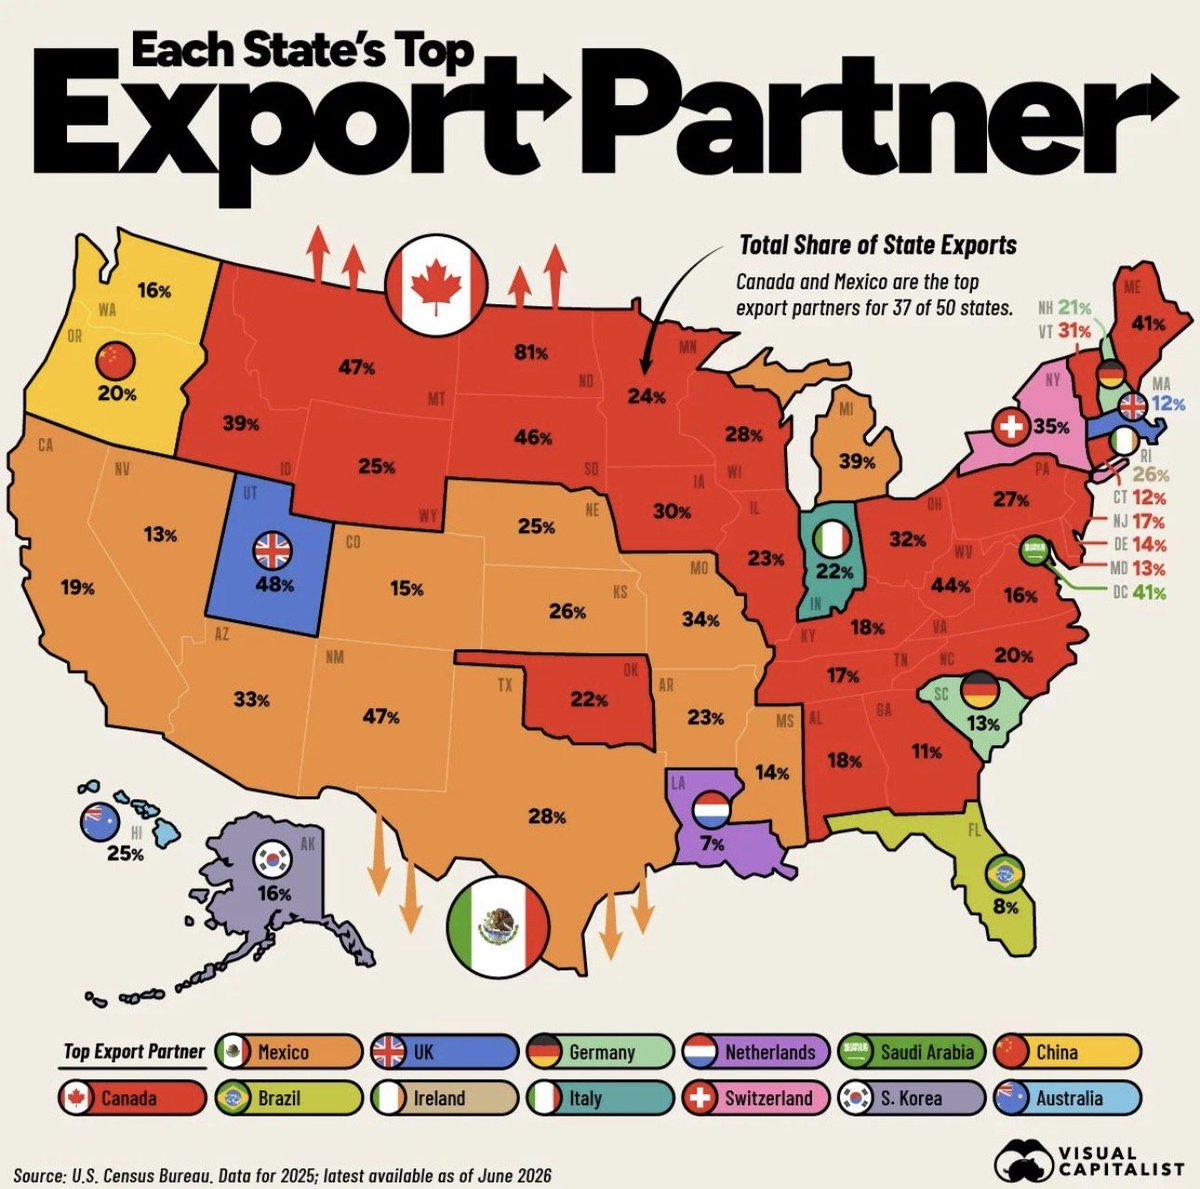
Each US state's top export partner and share (Visual Capitalist) | Canada and Mexico lead 37 states, North Dakota sends 81% to Canada
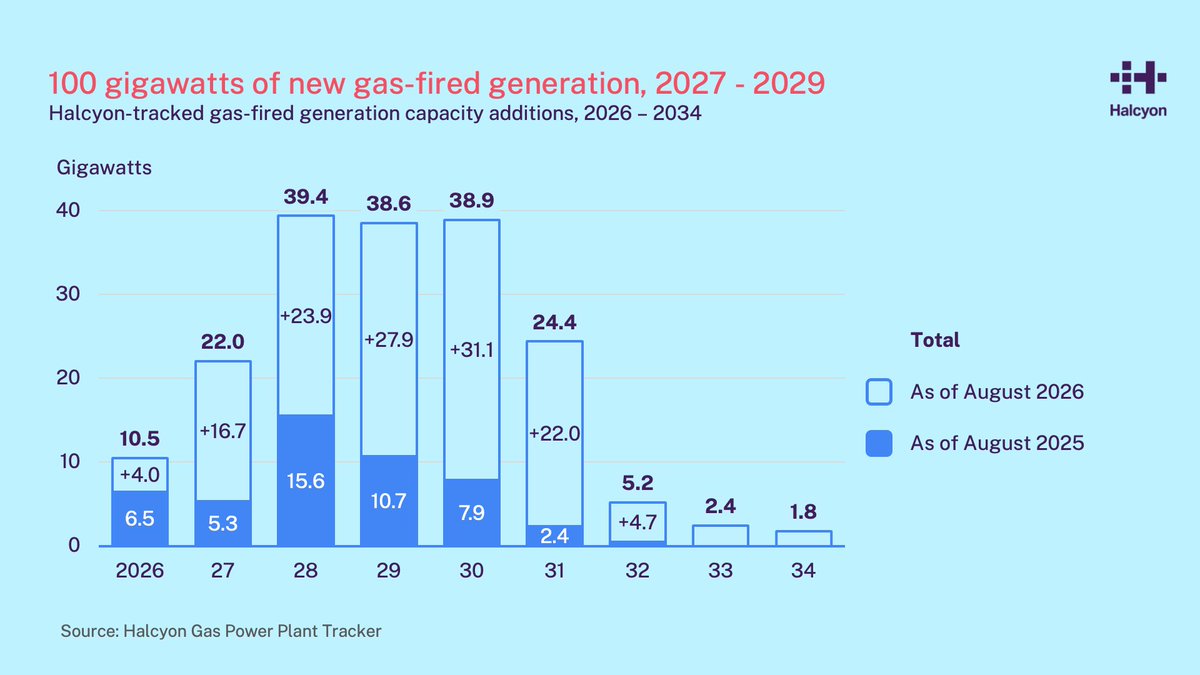
Halcyon-tracked gas-fired generation capacity additions, 2026-2034 | 39.4GW in 2028, 38.6GW in 2029 and 38.9GW in 2030, sharply above last year's estimates
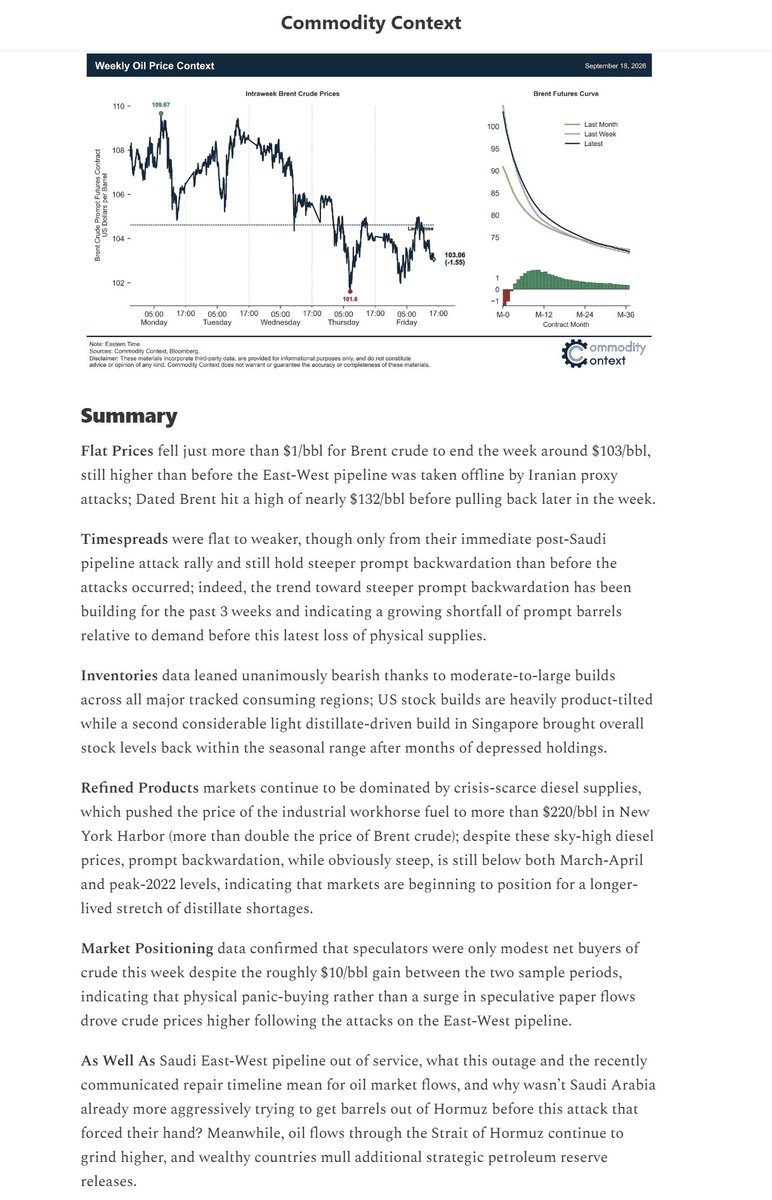
Intraweek Brent prices and the Brent futures curve | Closed at $103.06, down $1.55, with the curve in steep prompt backwardation
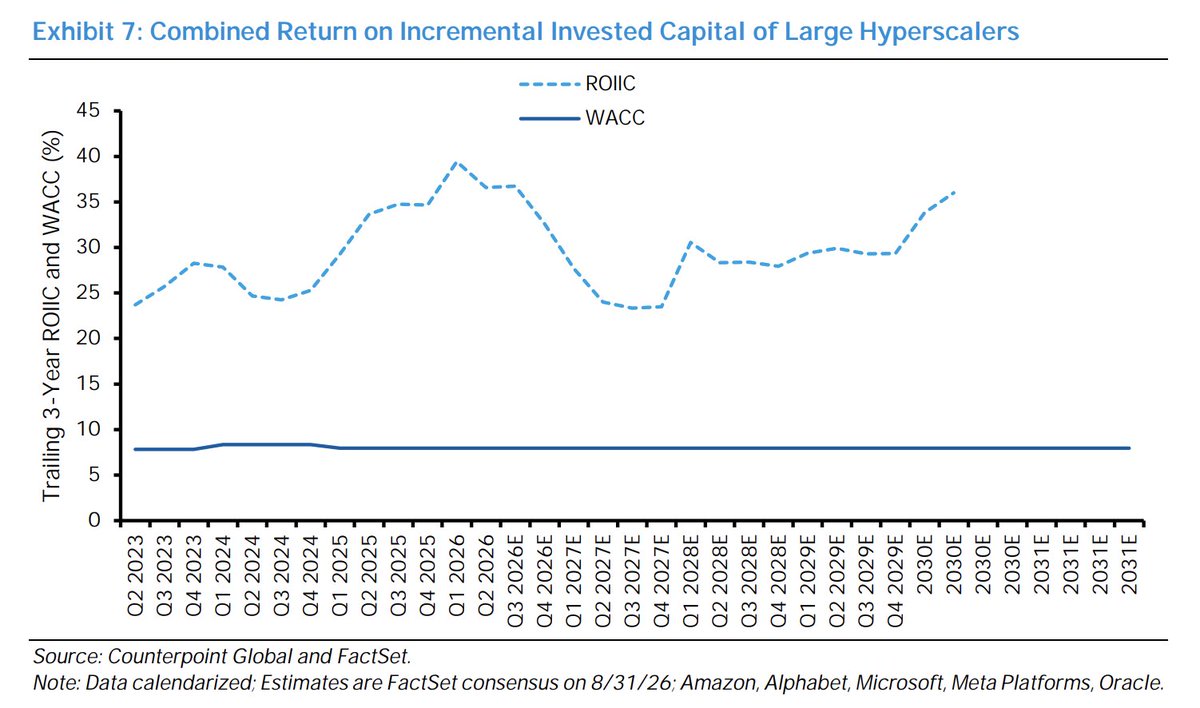
Large hyperscalers' trailing 3-year ROIIC vs WACC | ROIIC troughs at ~23% in Q4 2027 then climbs to ~35% by 2030, well above ~8% WACC
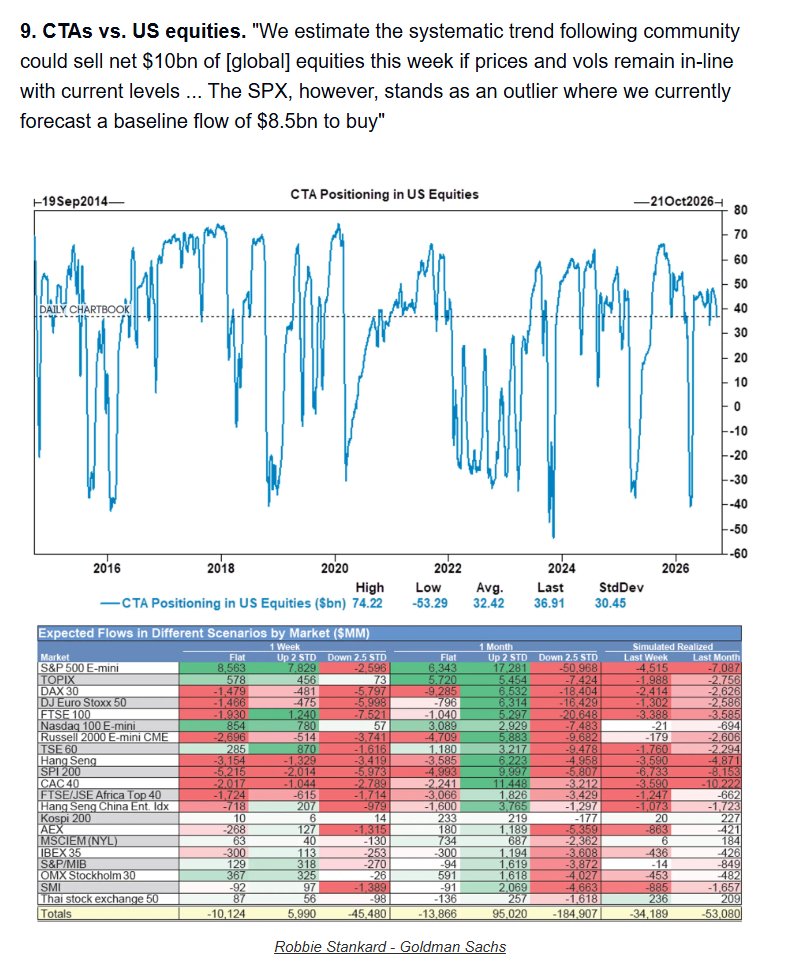
CTA positioning in US equities and scenario flows | Now 36.9 vs 32.4 average, base case buys ~$8.5bn of SPX
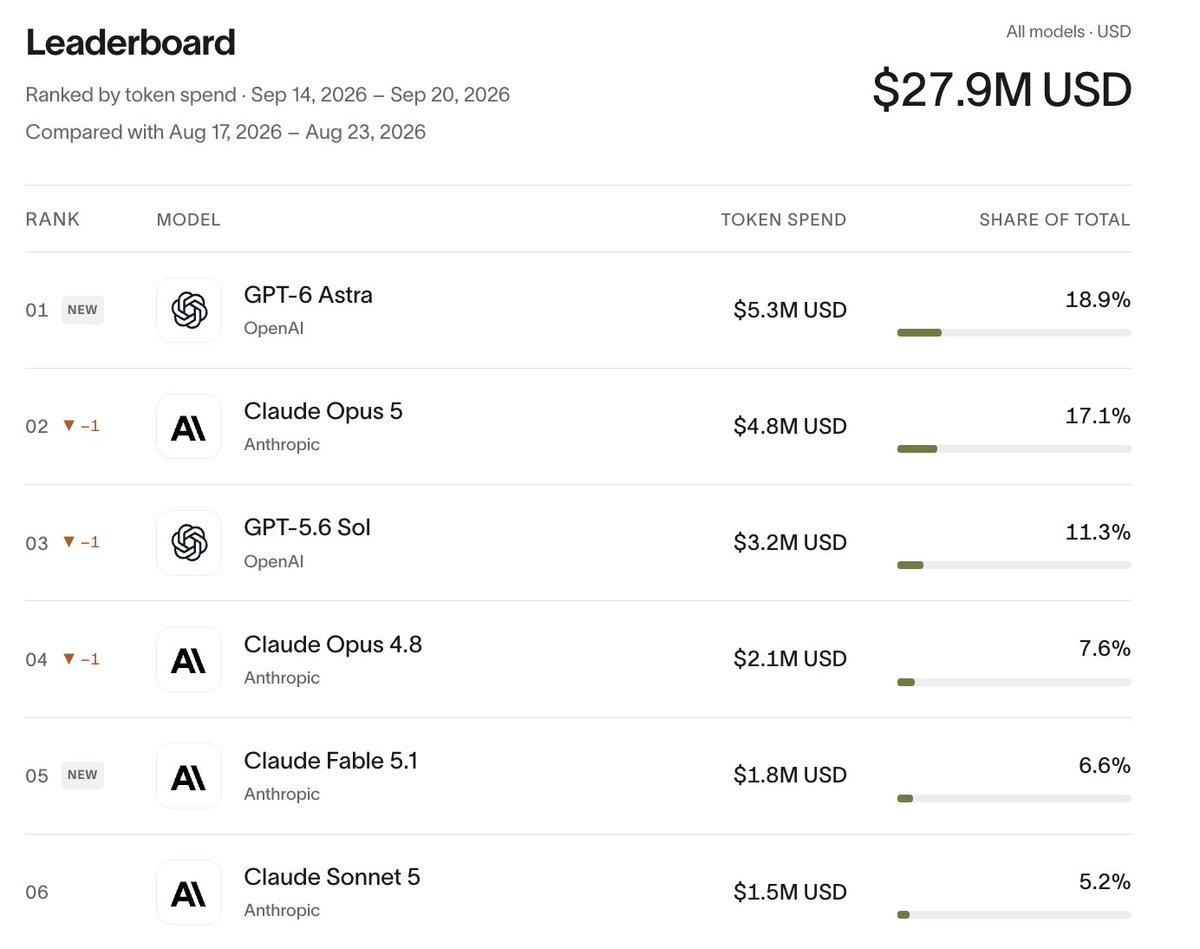
Weekly token spend by model on OpenRouter | GPT-6 Astra leads at $5.3M (18.9% of total), ahead of Claude Opus 5 at $4.8M
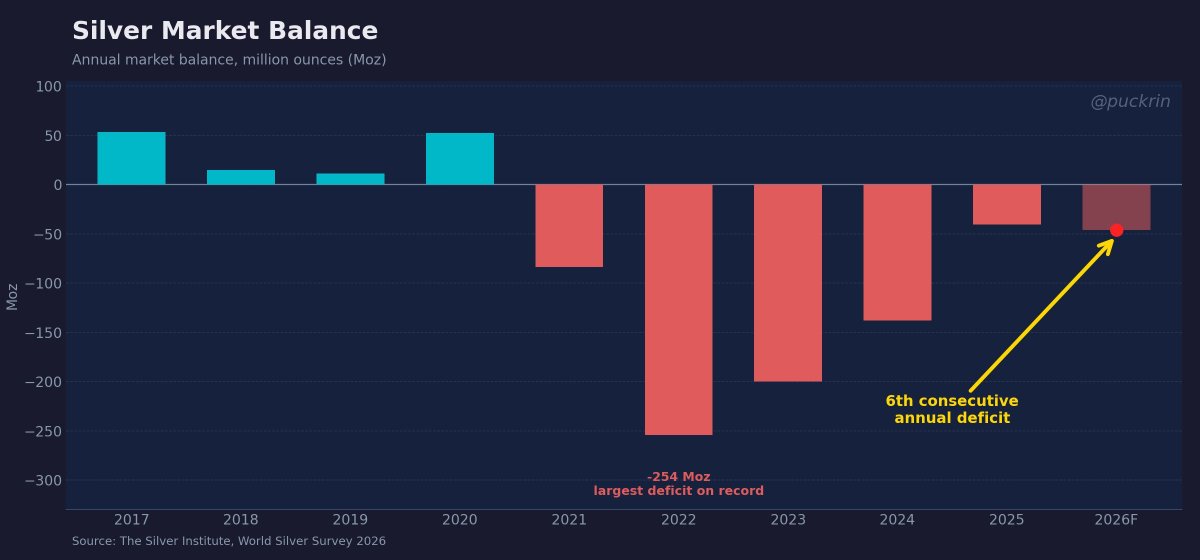
Silver annual market balance, million ounces | 2026F marks a sixth straight deficit, following the record -254 Moz shortfall in 2022
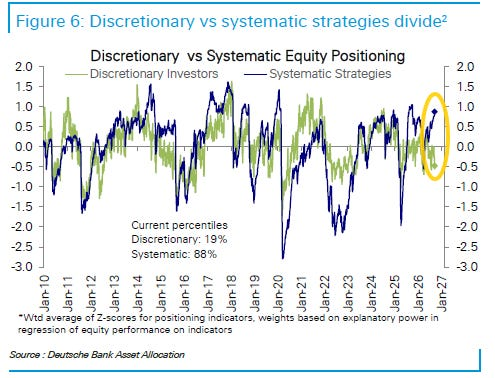
Discretionary versus systematic equity positioning (z-scores) | Systematic at the 88th percentile while discretionary sits at just the 19th, a wide divide
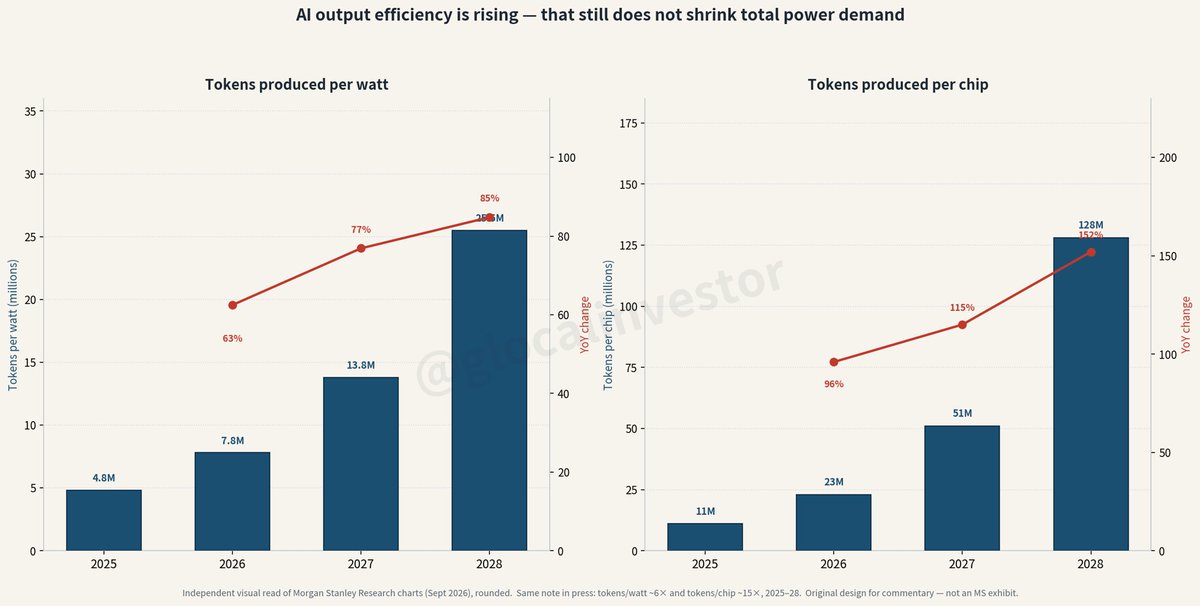
AI tokens per watt and per chip, 2025-2028 | Tokens/watt rise from 4.8M to 25.5M, tokens/chip from 11M to 128M
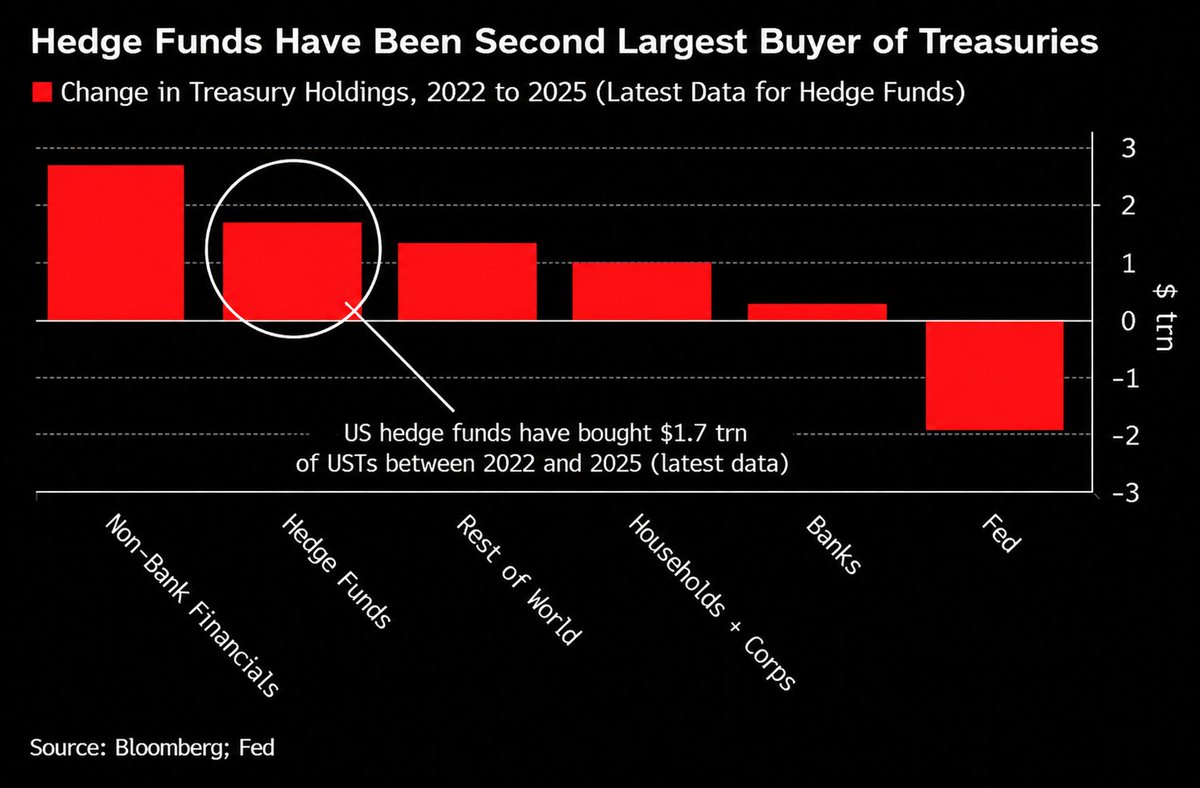
Change in Treasury holdings by sector, 2022 to 2025 | Hedge funds added $1.7T, second only to non-bank financials, while the Fed shed about $1.9T
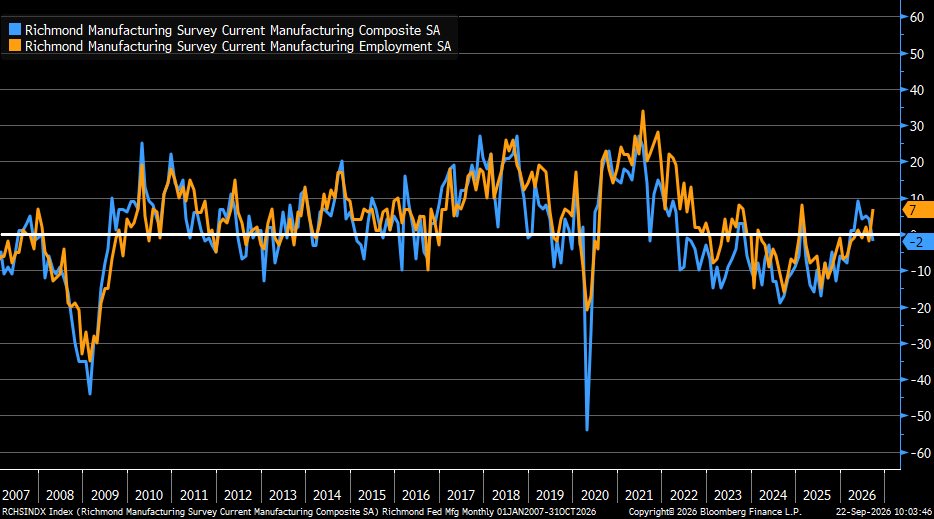
Richmond Fed manufacturing composite and employment indexes | September composite at -2 (from +4) while the employment gauge rises to +7
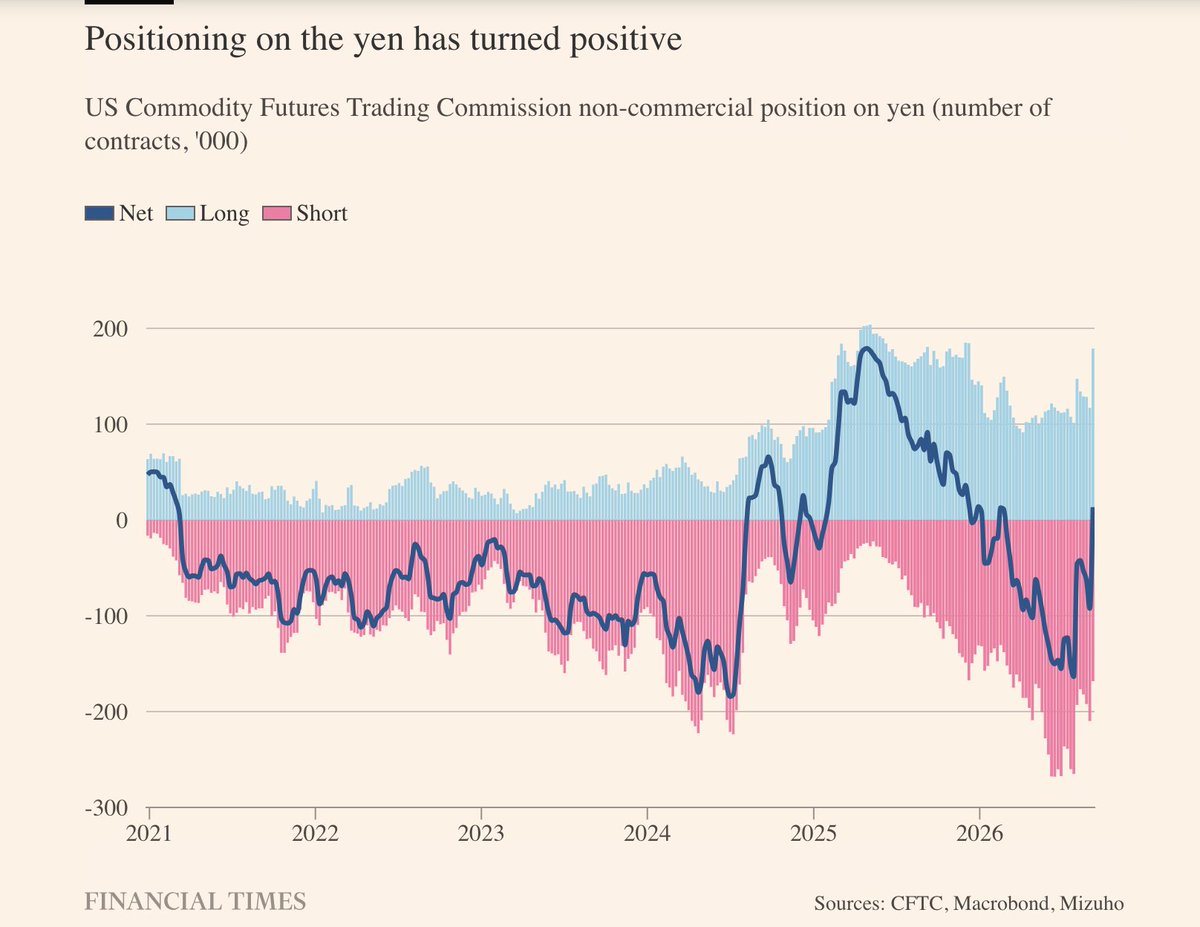
CFTC non-commercial yen position (thousands of contracts) | The net has swung back to positive with longs near 180k, ending a long stretch of bearish yen bets
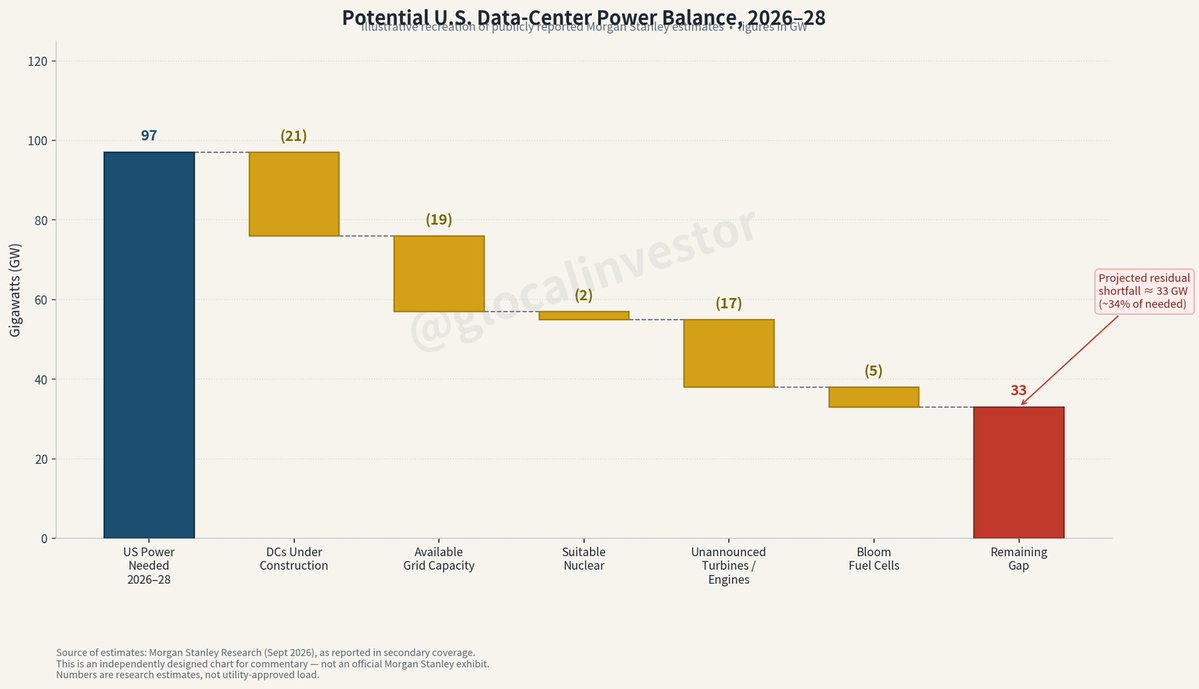
US data-center power supply-demand waterfall, 2026-28 (GW) | 97GW needed, a ~33GW gap remains after all supply sources
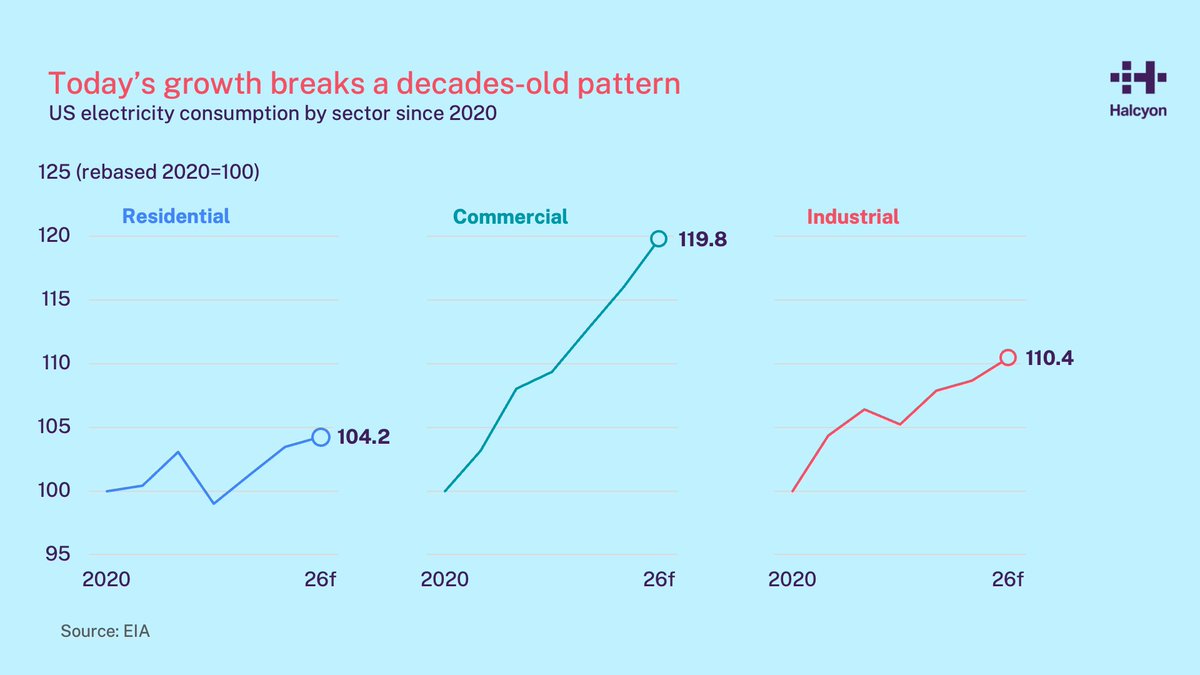
US electricity consumption by sector, rebased 2020 = 100 | Commercial at 119.8 leads, versus 110.4 for industrial and just 104.2 for residential
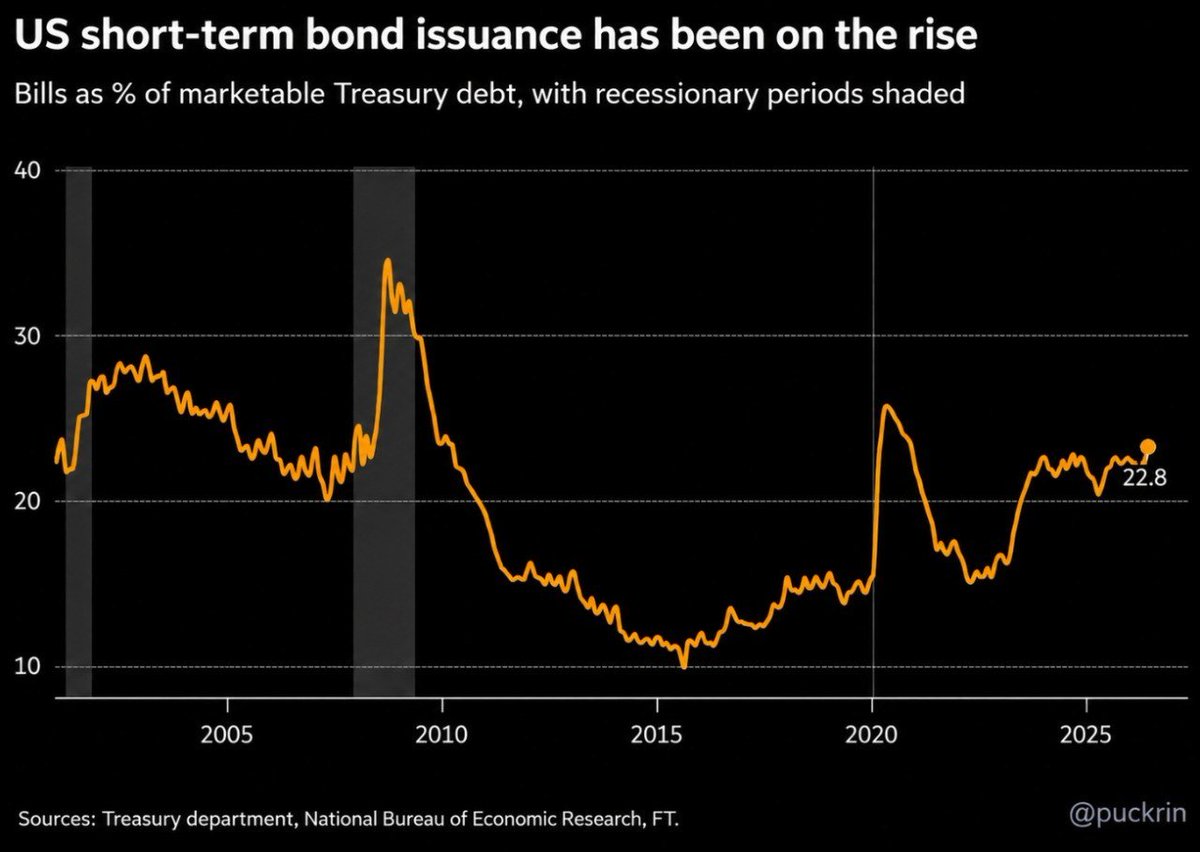
Bills as a share of marketable US Treasury debt | Now 22.8%, up from a ~10% trough in 2015
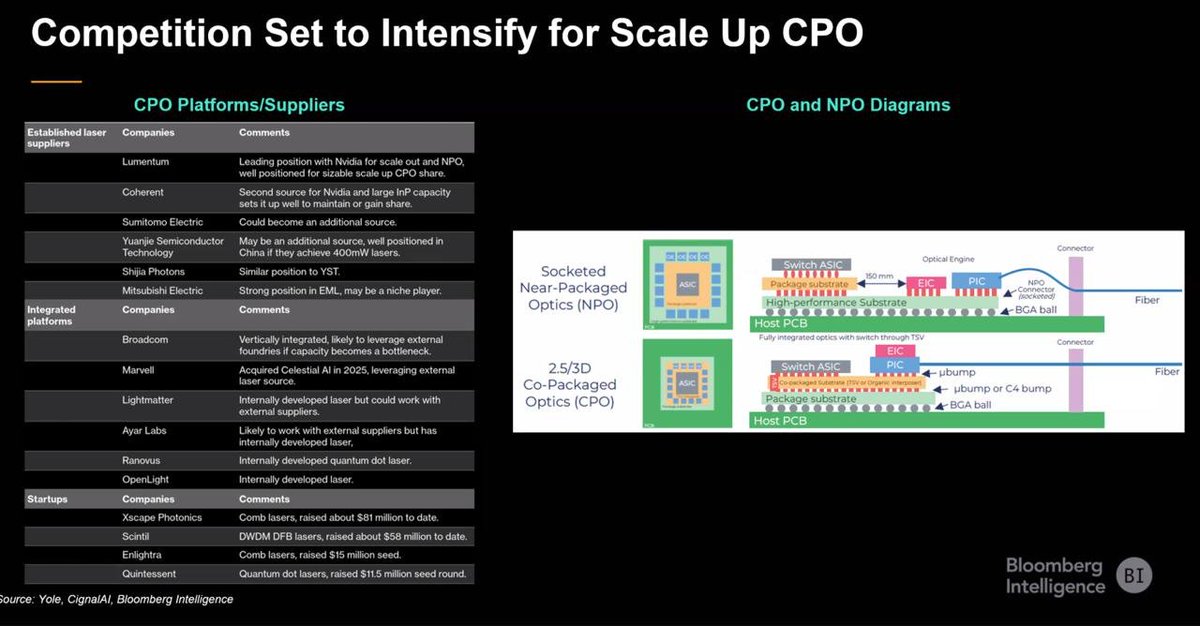
CPO/NPO optics supplier landscape and packaging (Bloomberg Intelligence) | Lumentum leads for Nvidia scale-out, startups have raised over $80M
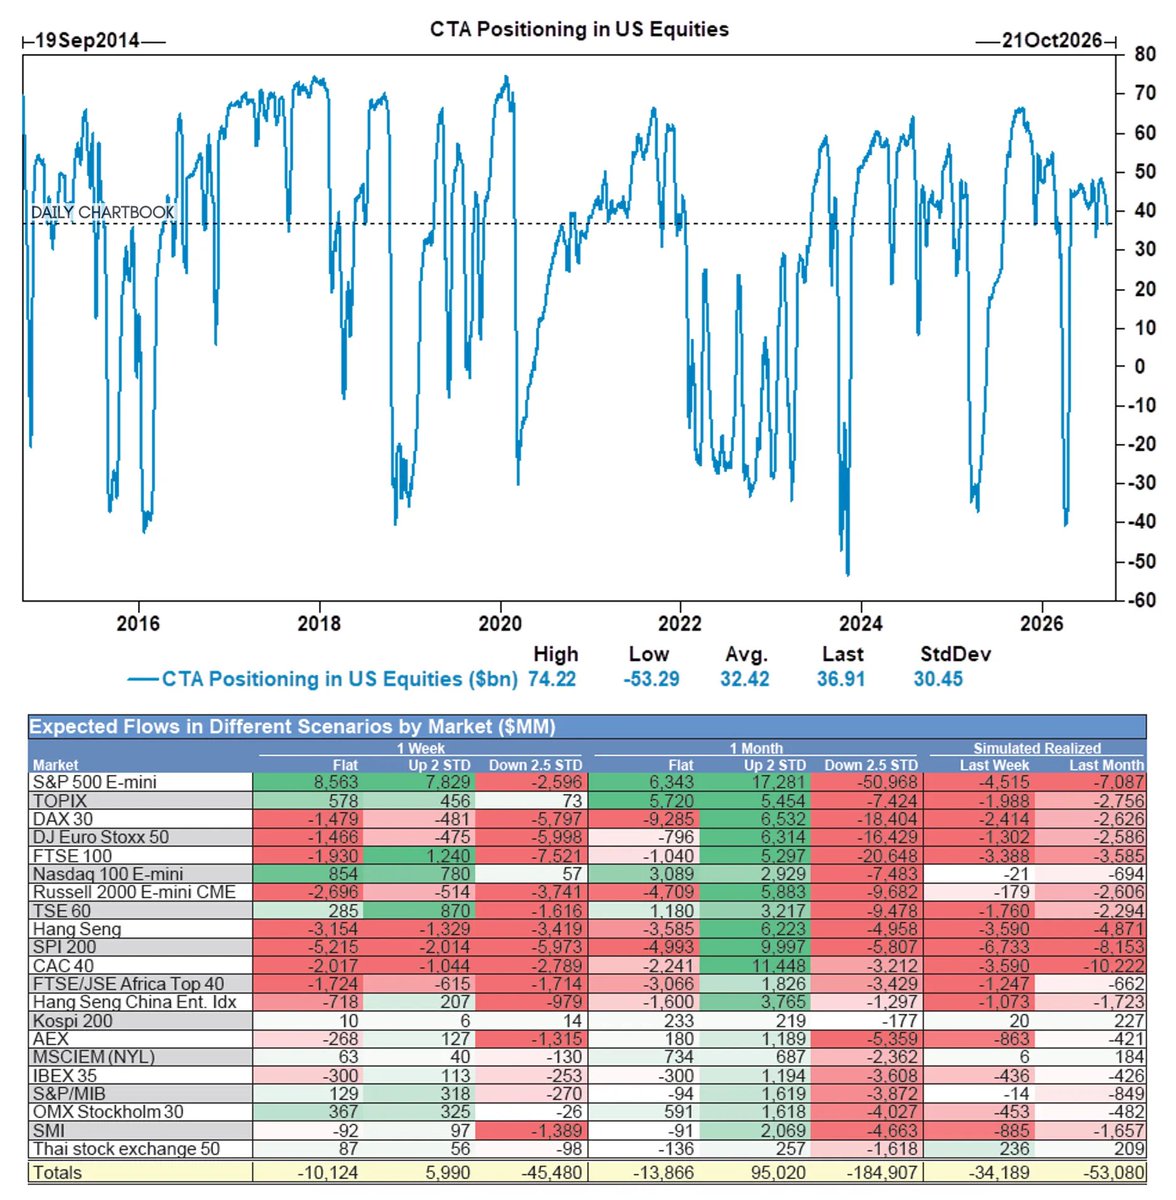
CTA positioning in US equities and estimated flows by market | US positioning last at $36.9bn, with S&P 500 E-mini baseline weekly flow about +$8.6bn
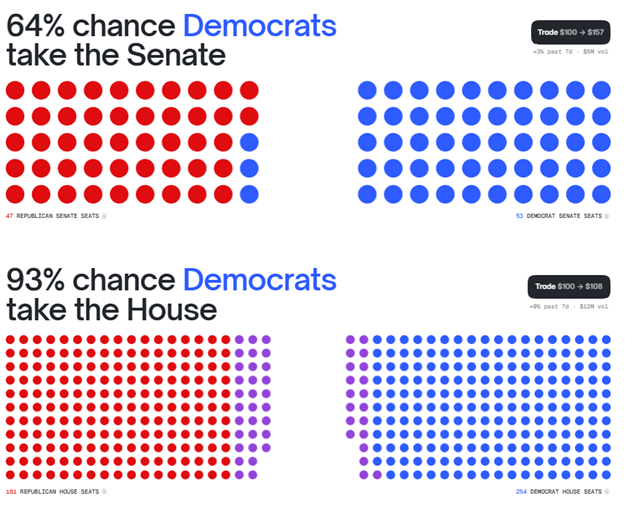
Polymarket odds for control of Congress after the 2026 midterms | Democrats 93% to take the House and 64% the Senate
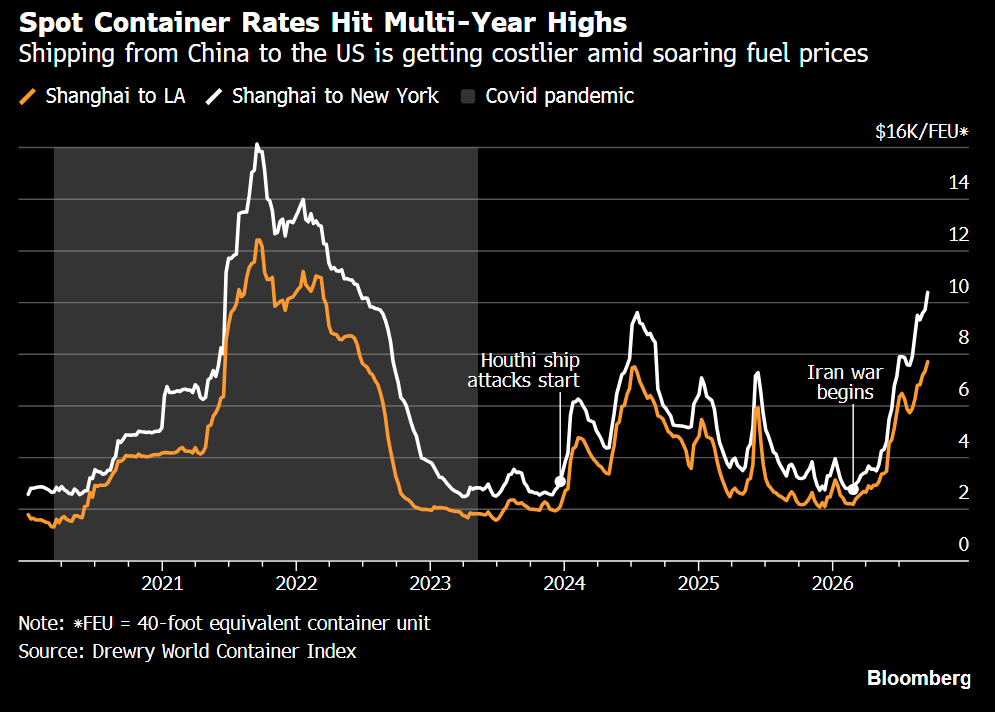
Shanghai-to-LA and Shanghai-to-NY spot container rates | Shanghai-to-NY near $10K/FEU, a multi-year high but below the 2021 peak of ~$16K
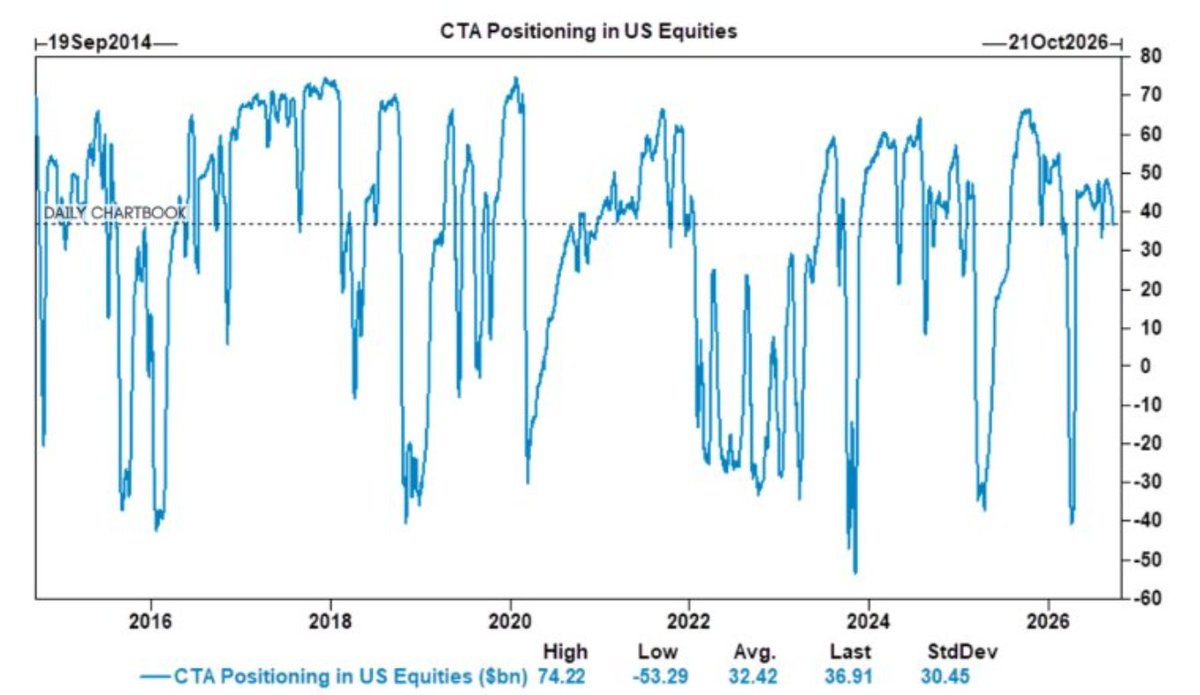
CTA positioning in US equities ($bn) since 2014 | Last near $37bn, a touch above the $32bn average and well below the $74bn high
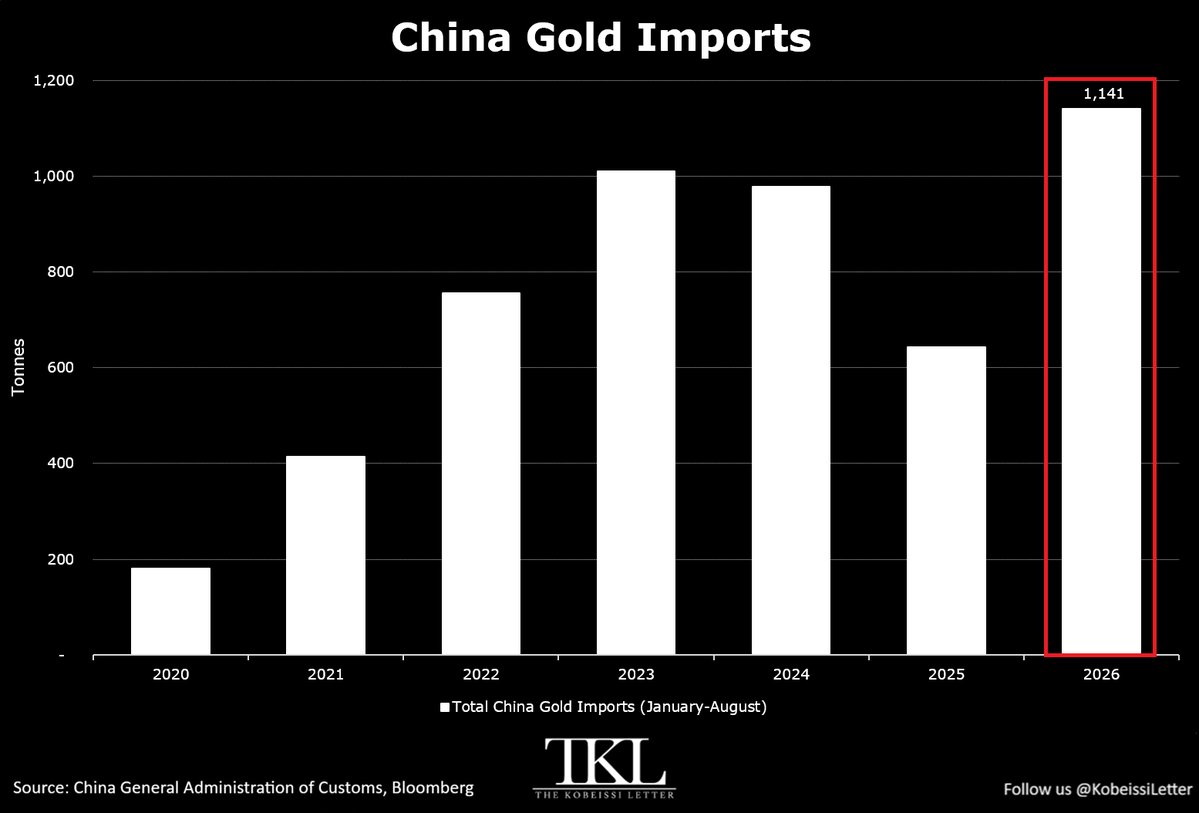
China gold imports, January-August each year (tonnes) | 2026 at 1,141 tonnes, a record and above all of last year
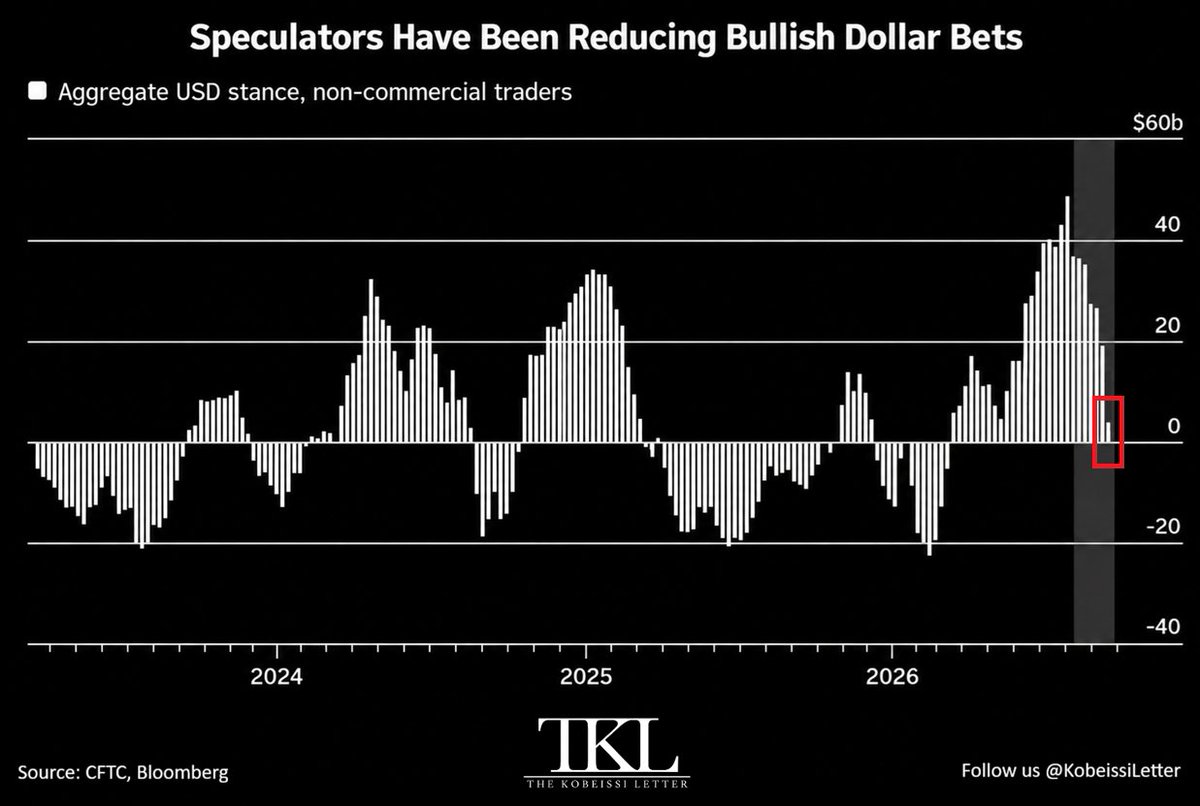
Aggregate USD stance of non-commercial traders | Now about +$5B, a 7th straight weekly drop from the ~+$50B mid-July peak
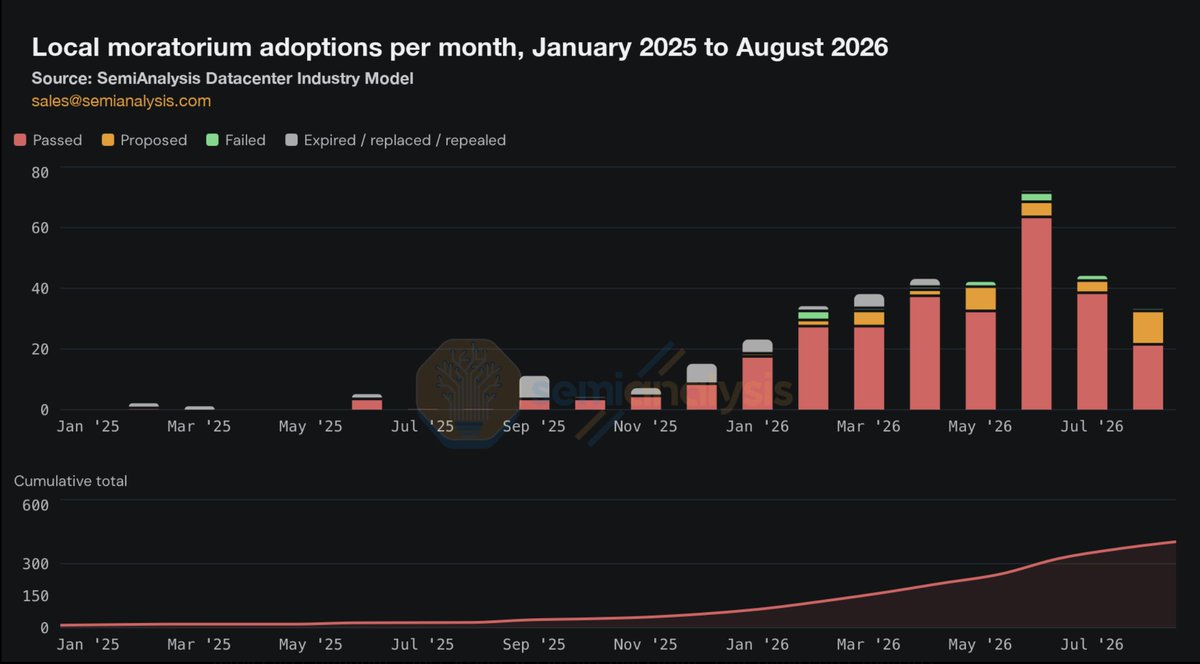
US local data-center moratorium adoptions, monthly and cumulative | Monthly passages topped 60, cumulative now above 400
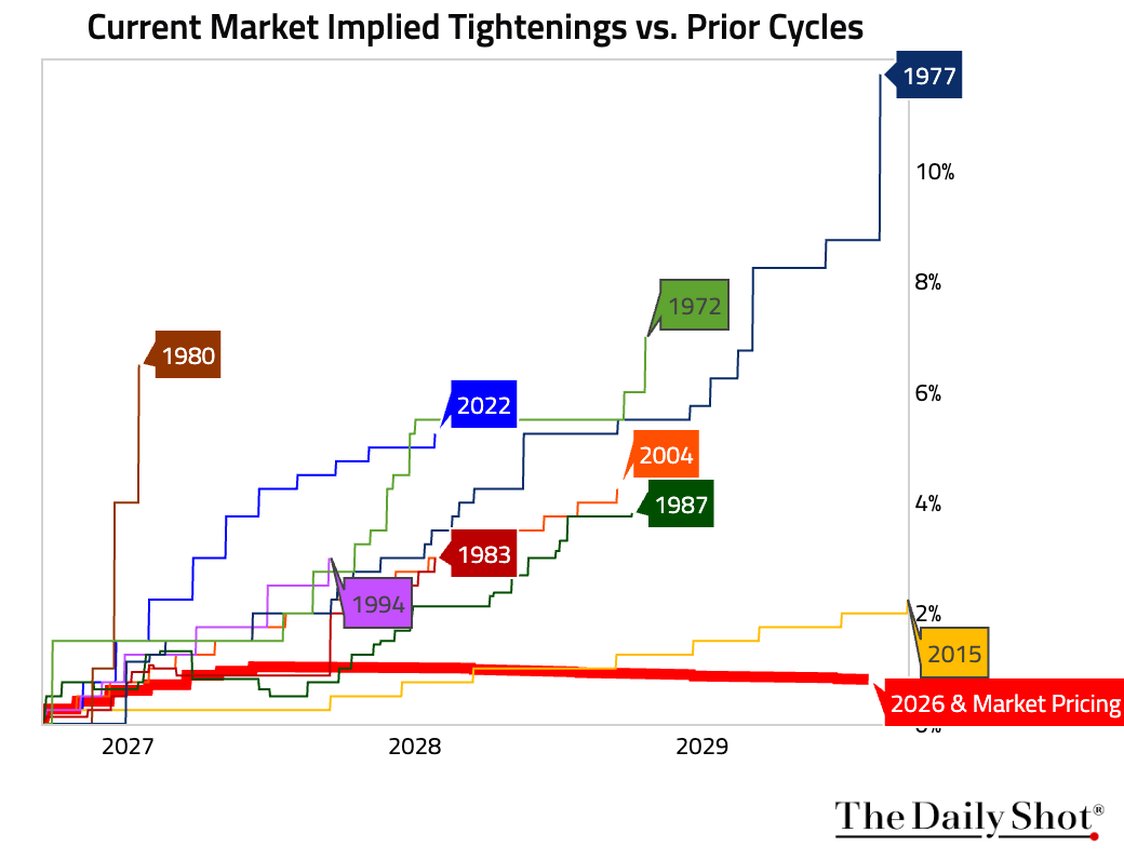
Market-implied cumulative tightening across Fed cycles | 2026 pricing stays under 2%, far below 1977, 1980 and 2022
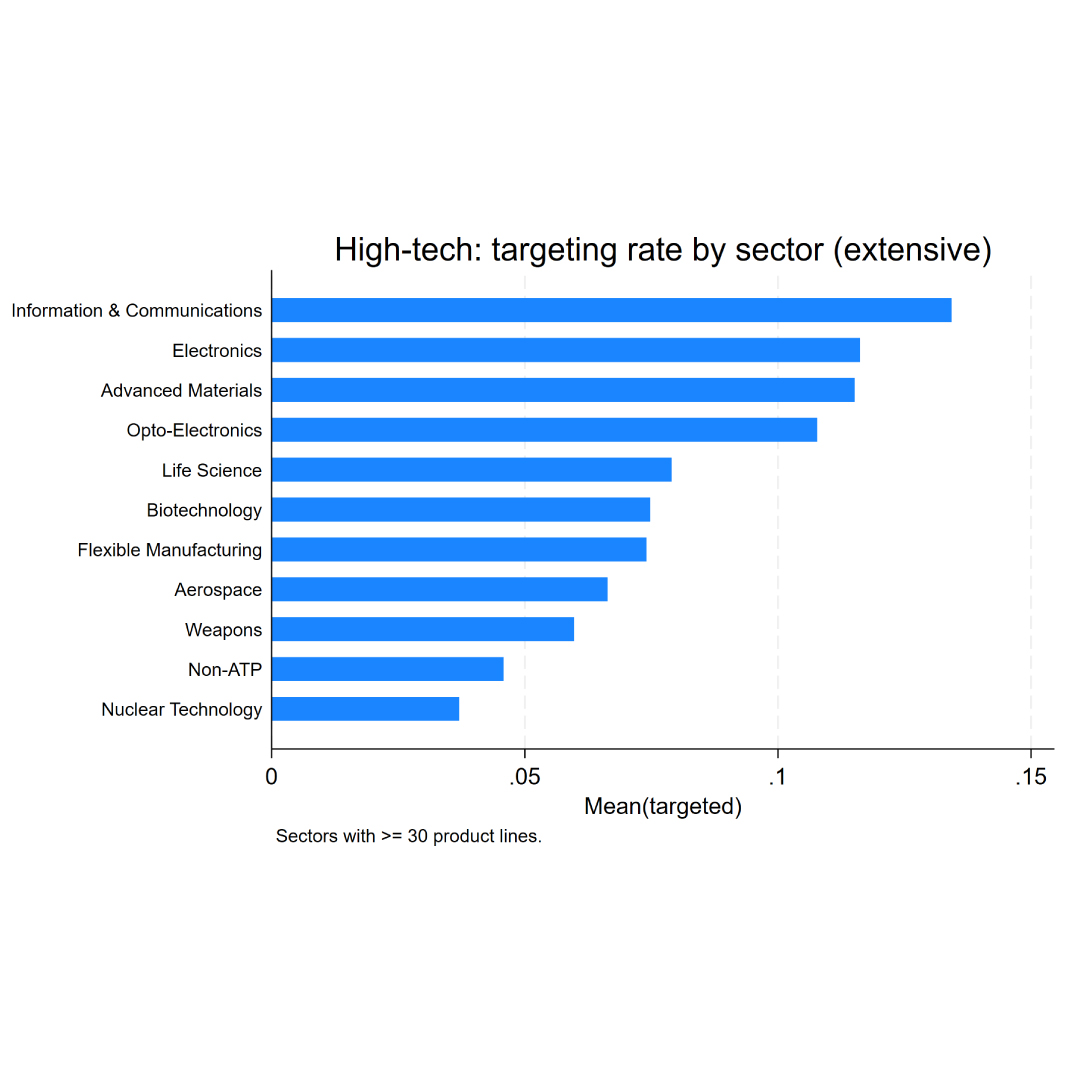
High-tech export-control targeting rate by sector | Info & Communications ~0.13 leads, nuclear technology ~0.04 lowest
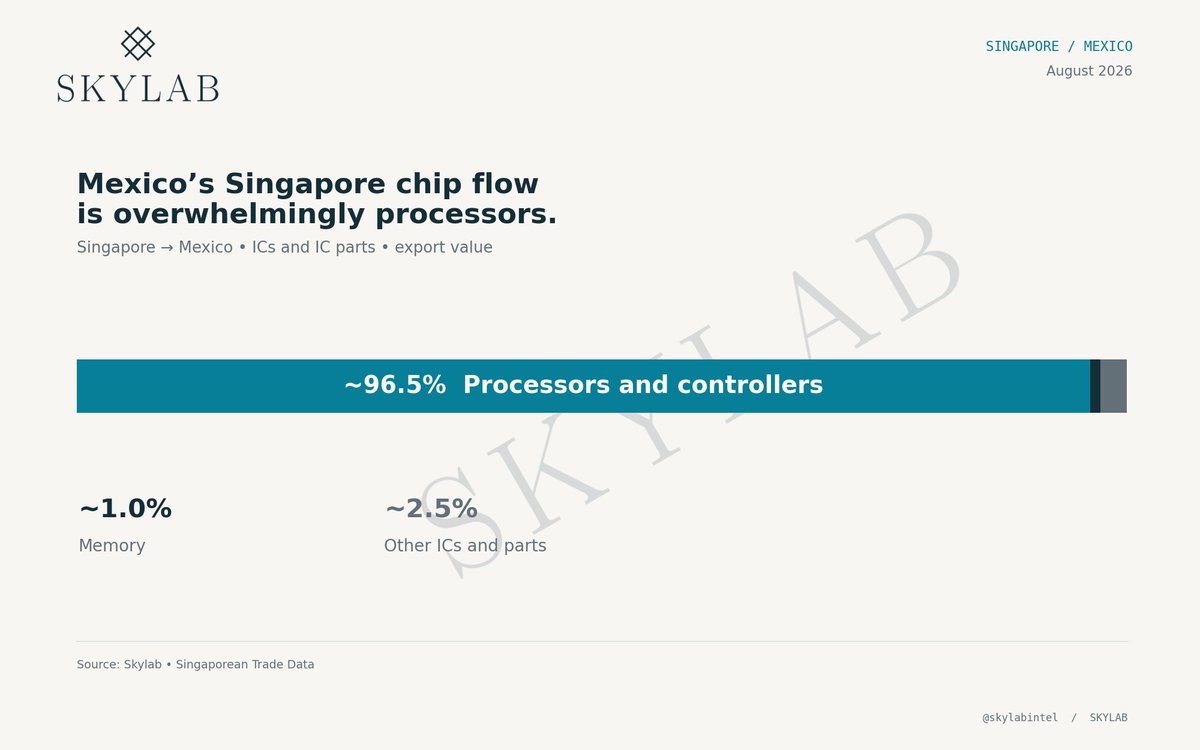
Singapore-to-Mexico IC and IC-parts export value, August | Processors and controllers about 96.5%, memory about 1.0% and other ICs about 2.5%
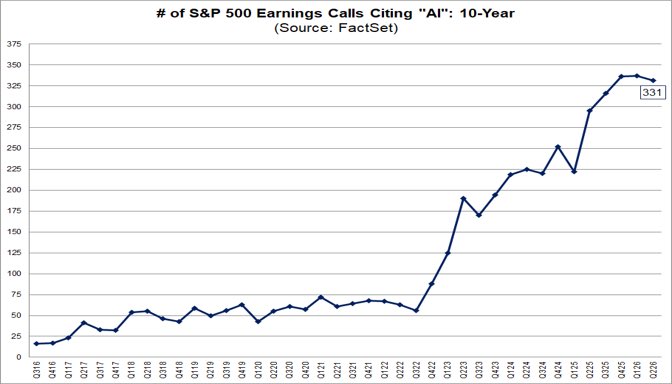
Number of S&P 500 earnings calls citing 'AI' over ten years | Latest quarter at 331, or 67% of companies, the highest on record
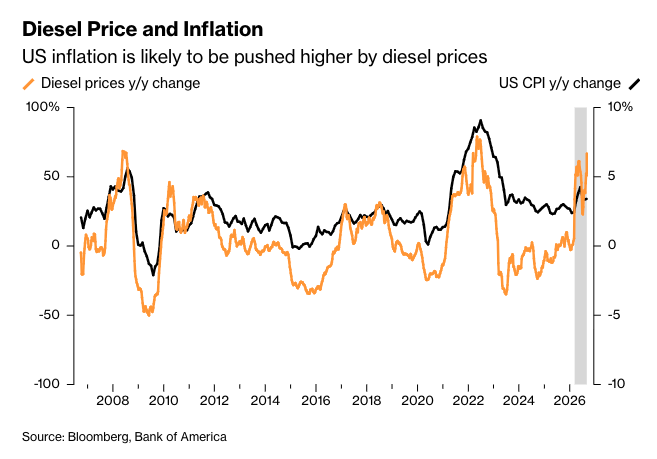
US diesel price y/y vs CPI y/y | Diesel up ~60% and historically leads CPI
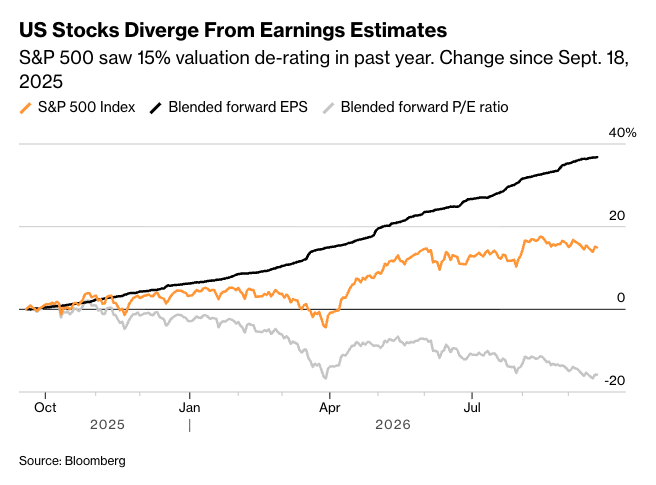
S&P 500 price, blended forward EPS and forward P/E, indexed since Sept 18, 2025 | Forward EPS up over 30% while the forward P/E fell about 20%
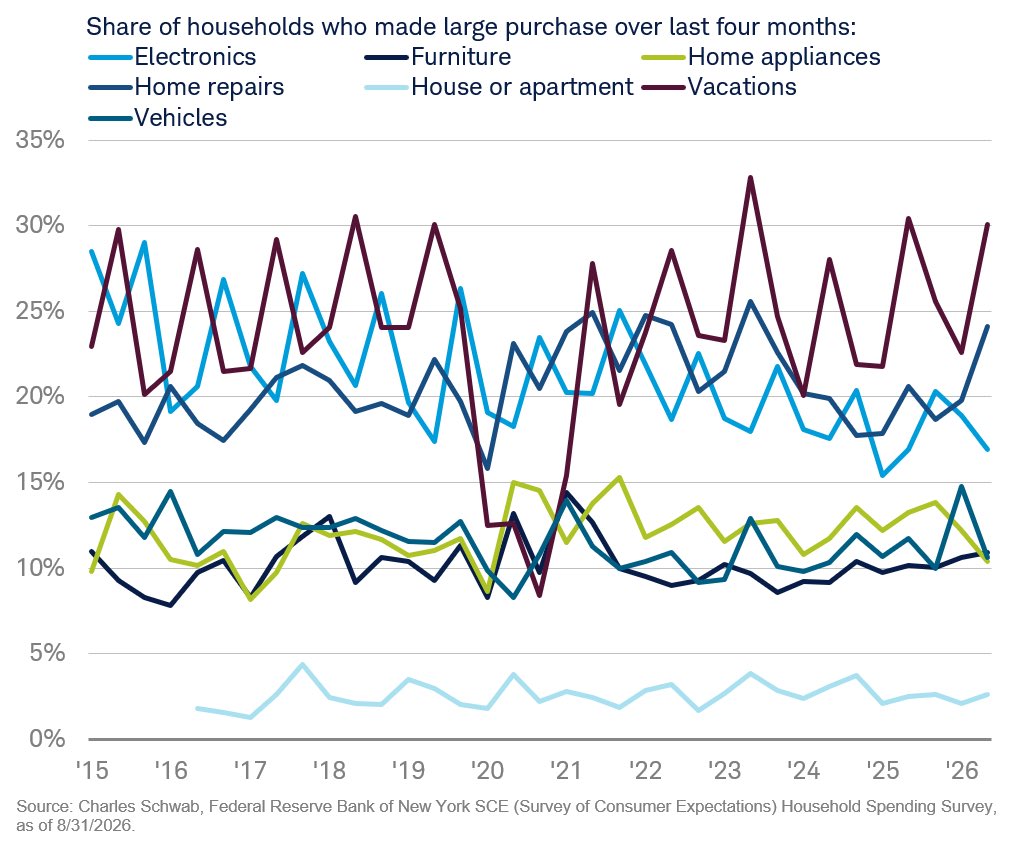
Share of US households making a large purchase over the past four months, by category, 2015-2026 | Vacations now ~30%, the highest, while house/apartment stays lowest at ~3%
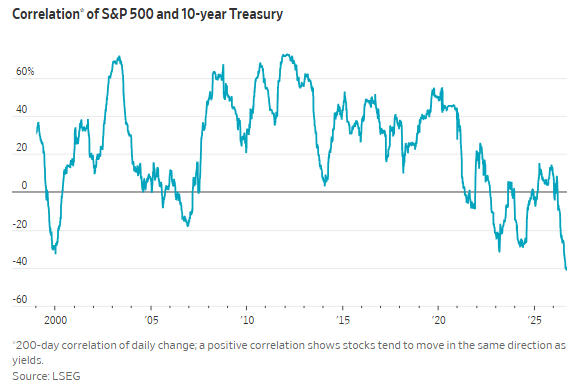
200-day correlation of the S&P 500 and the 10-year Treasury | Recently near -45%, the lowest since 2000, with stocks and bonds moving apart
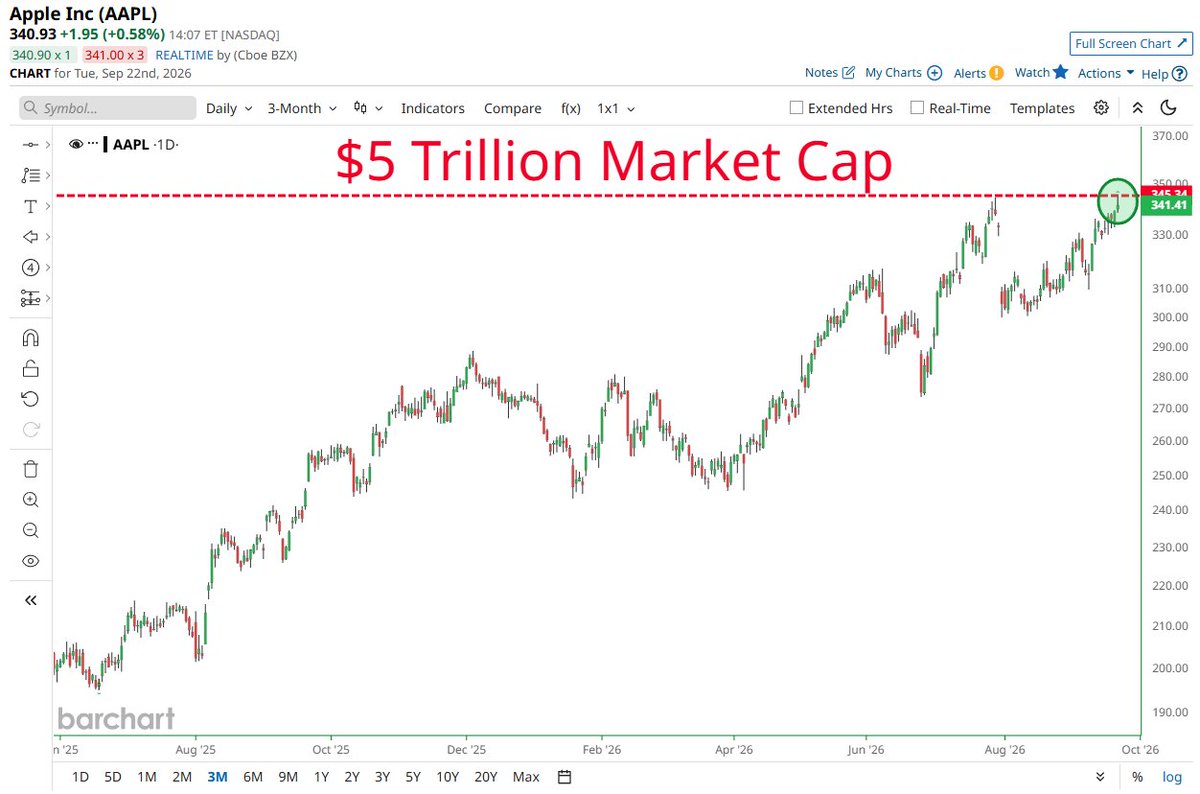
Apple (AAPL), daily over the past year | Latest ~$341, up 0.58%, pushing its market cap above $5 trillion
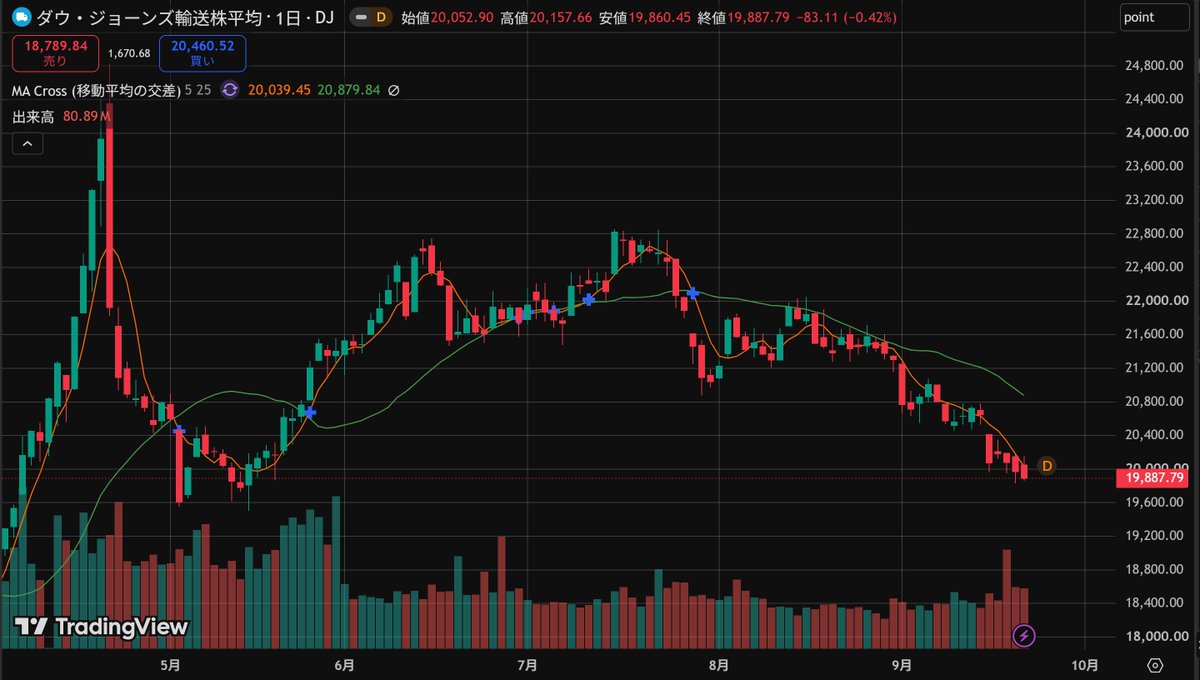
Dow Jones Transportation Average, daily with moving averages | Latest 19,887.79, down 0.42%, off the ~22,800 July high
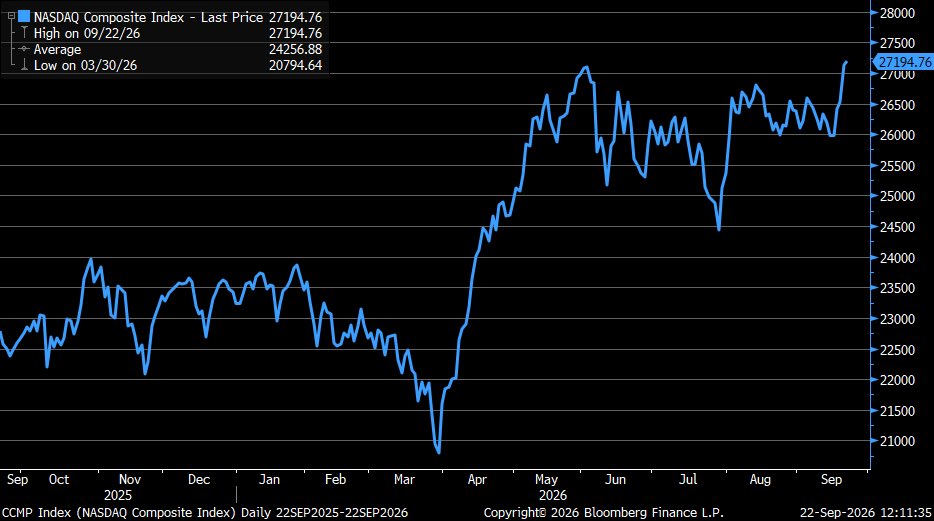
Nasdaq Composite Index, past year daily | Latest 27,194.76 sets a fresh high, well above the March low near 20,795
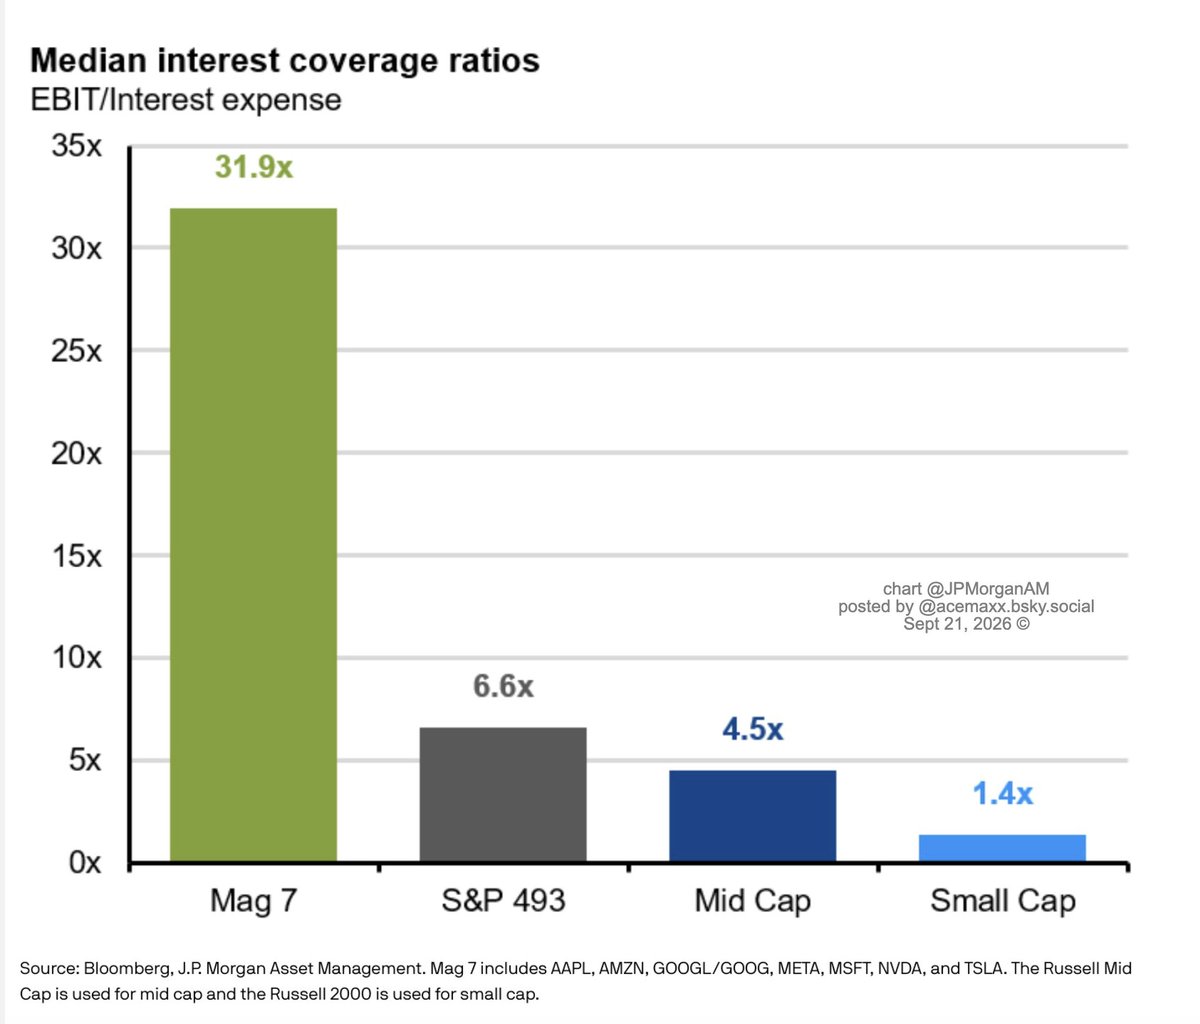
Median interest coverage (EBIT/interest) by group | Mag 7 31.9x vs S&P 493 6.6x and small cap 1.4x
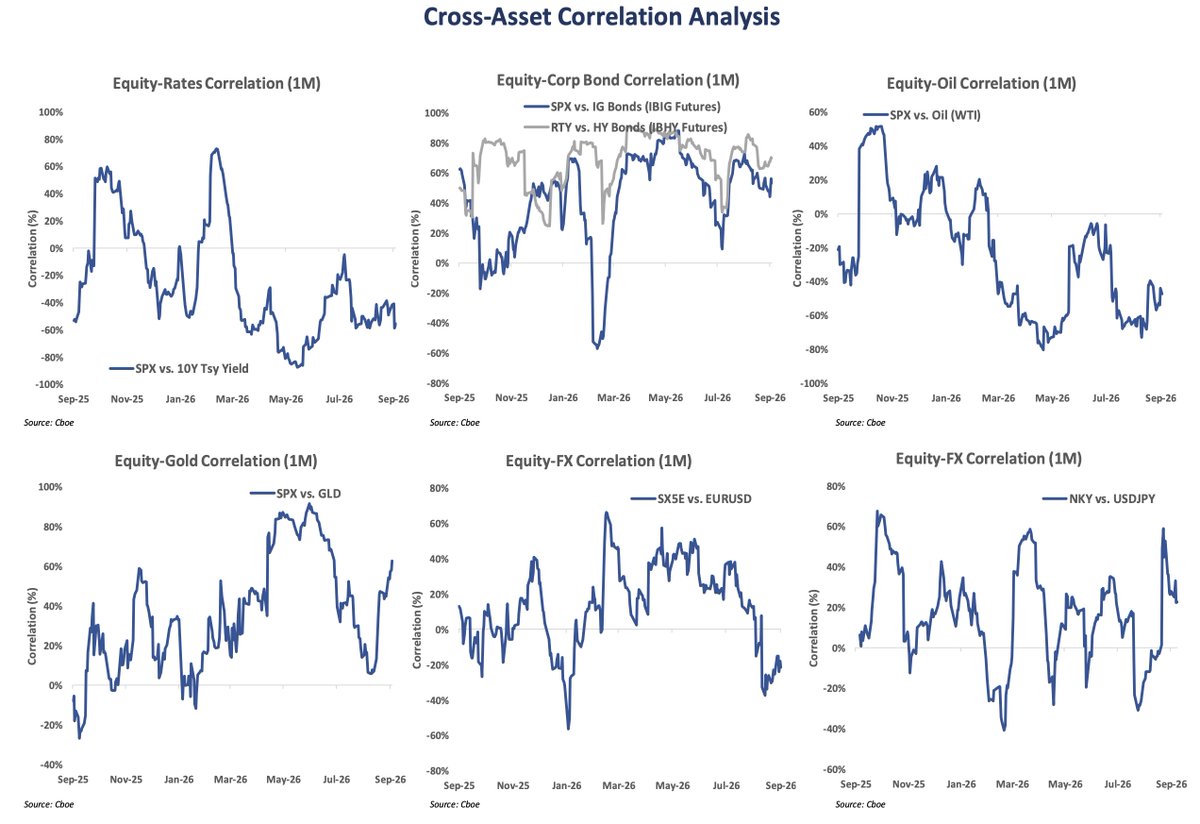
One-month correlations of equities with rates, bonds, oil, gold and FX | SPX versus 10Y yield has turned deeply negative while SPX versus gold has climbed