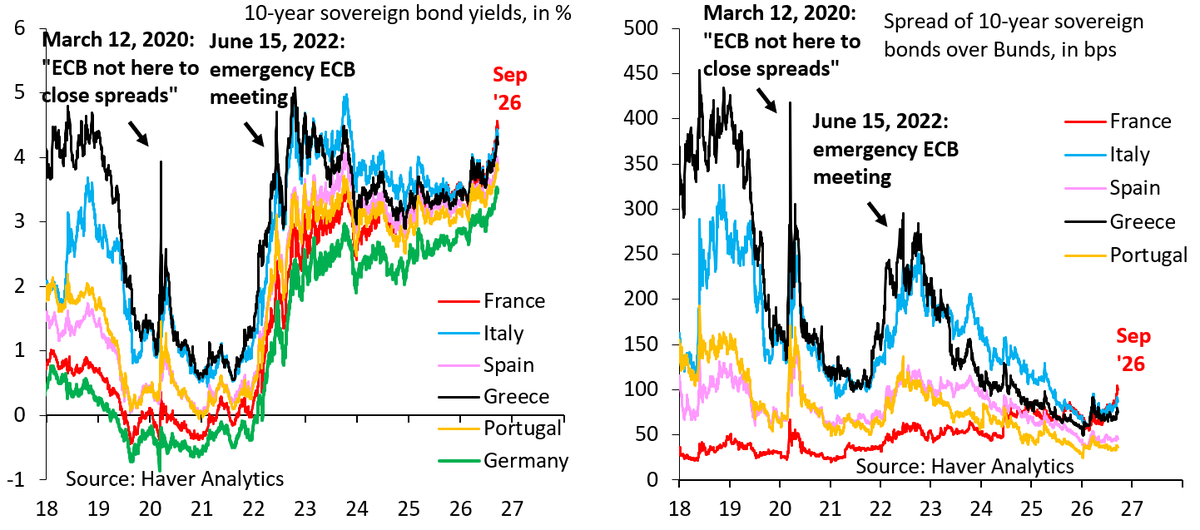
Euro-Area Sovereign Spreads Over Bunds Compress to Around 100bp as Periphery Risk Premia Ease
Euro-area 10-year sovereign yields and spreads over Bunds | Yields back to 3-4.5% in 2026 with spreads compressed to around 100bp or less
English financial charts and market context published in 2026-09, page 31.
Euro-area 10-year sovereign yields and spreads over Bunds | Yields back to 3-4.5% in 2026 with spreads compressed to around 100bp or less
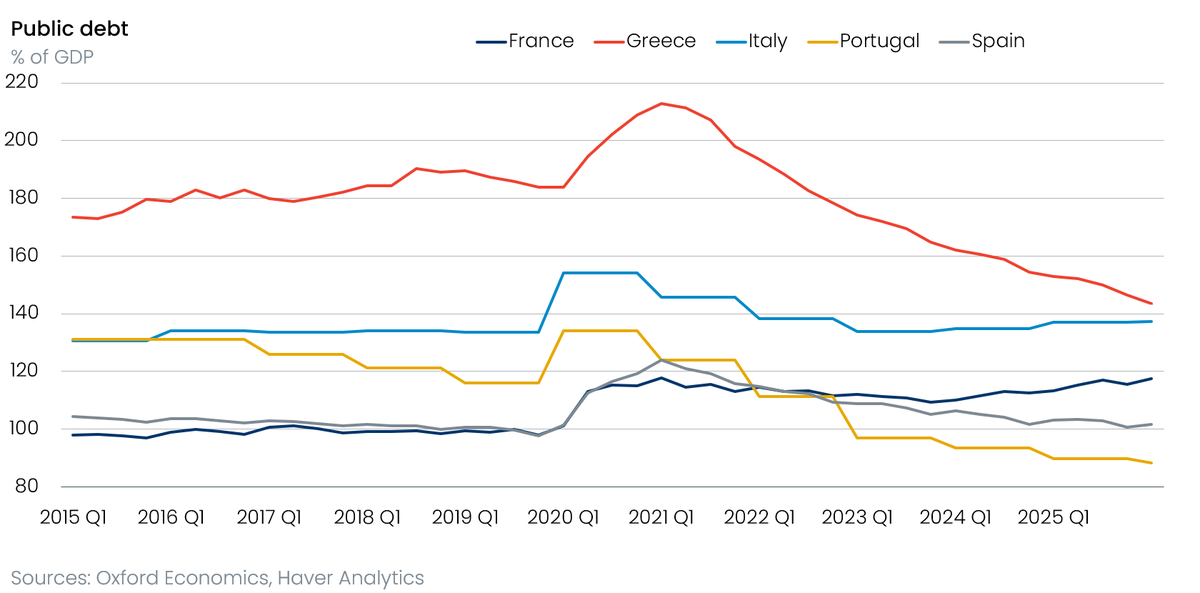
Public debt as % of GDP, five European economies, 2015-2025 | Greece down from a 2021 peak of 213% to 143%, while France climbs to a regional-high 117%
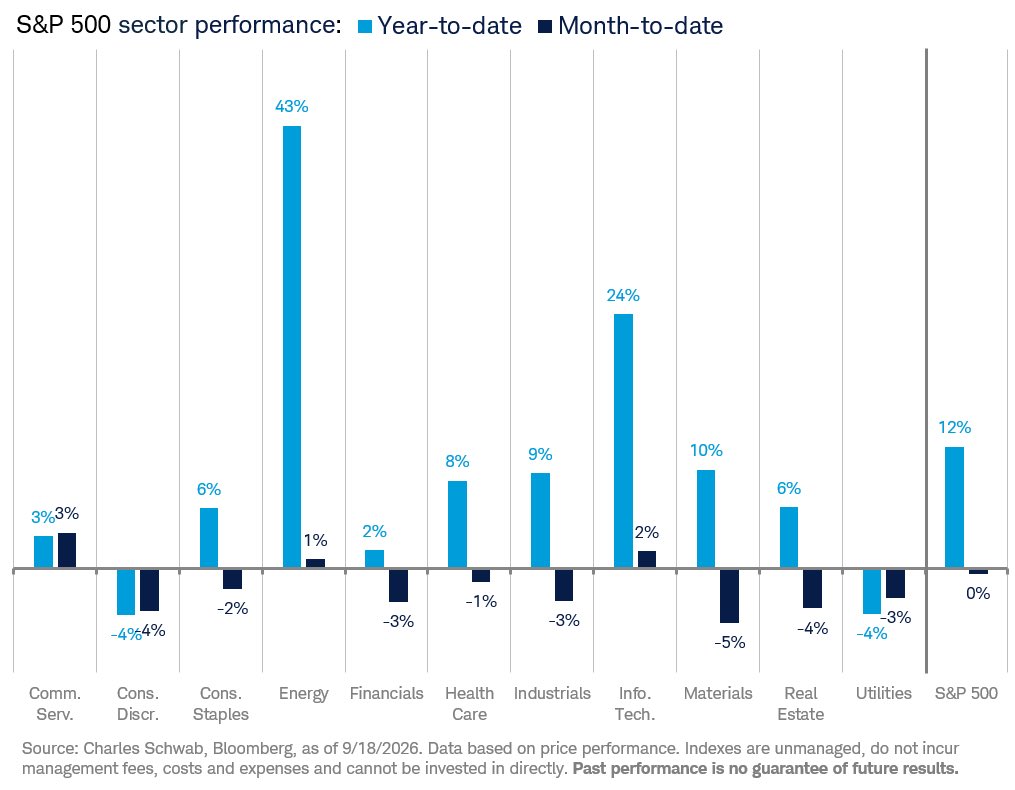
S&P 500 sector returns, year-to-date vs month-to-date | Energy +43% and Info Tech +24% lead YTD; most sectors negative MTD, Materials -5% worst
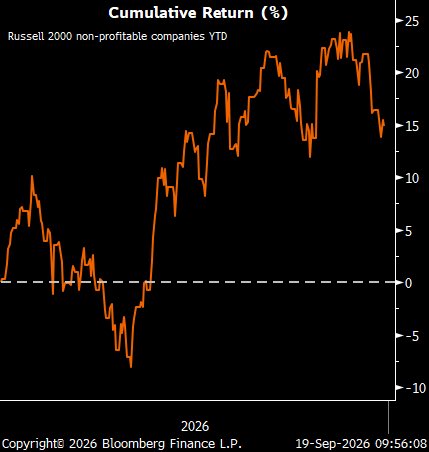
Cumulative YTD return of Russell 2000 non-profitable companies (%) | Up ~15%, with profitable names now outperforming by about 500 bps
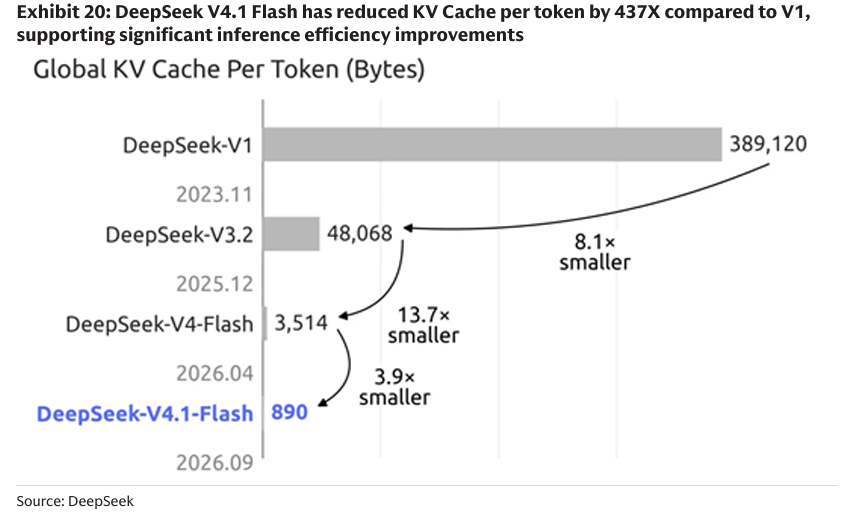
DeepSeek KV cache per token by generation (bytes) | Down from 389,120 in V1 to 890 in V4.1, a 437x efficiency gain
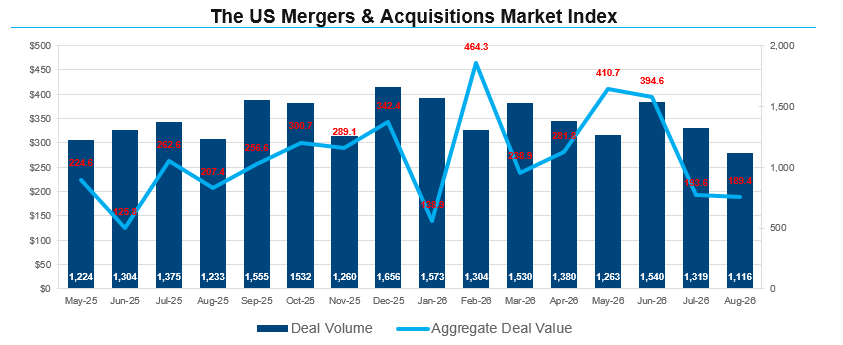
US M&A deal volume (bars) and aggregate value (line), monthly | August volume 1,116, down 15% m/m, with total spending off 2%
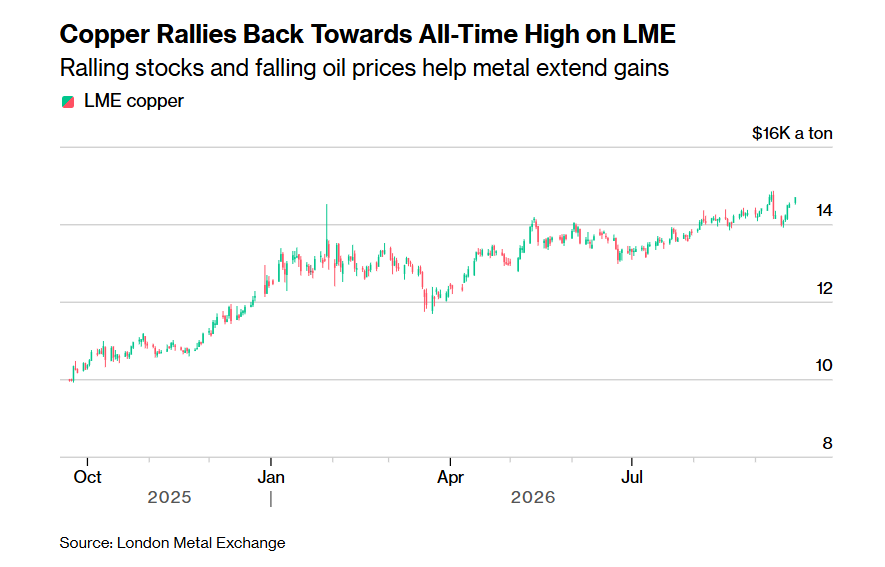
LME copper price, $/ton (London Metal Exchange) | Copper climbed back above ~$14,000/ton, approaching its earlier record high
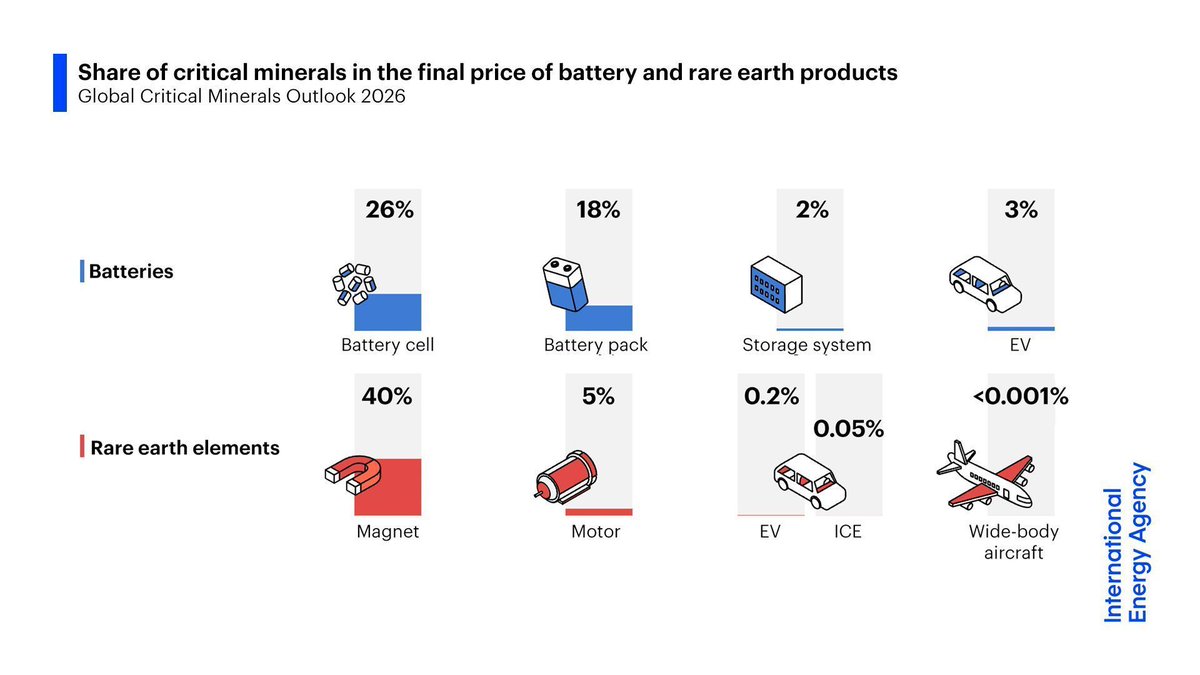
Share of critical minerals in final product prices | 26% of a battery cell and 18% of a pack, but only 3% of an EV; rare-earth magnets 40%
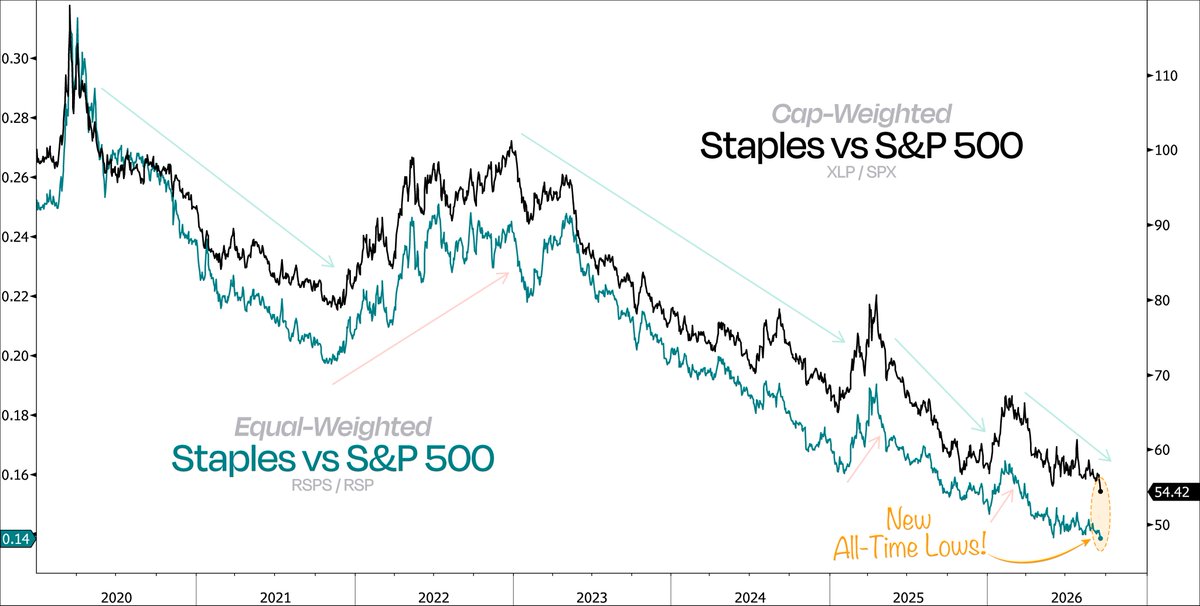
Staples vs S&P 500, cap-weighted (XLP/SPX) and equal-weighted (RSPS/RSP) | Both ratios hit all-time lows in 2026 after a steady decline since 2020
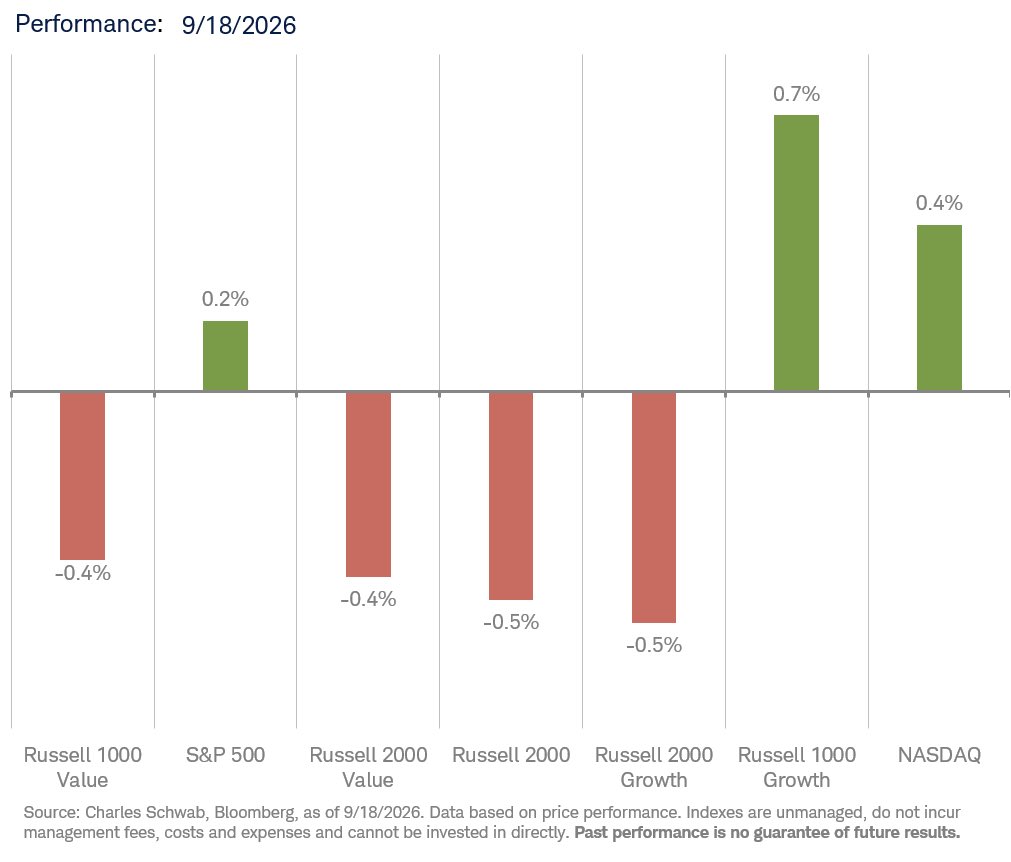
Daily performance of major US equity indexes (Sept 18) | Russell 1000 Growth +0.7% led, Russell 2000 styles fell about -0.5%
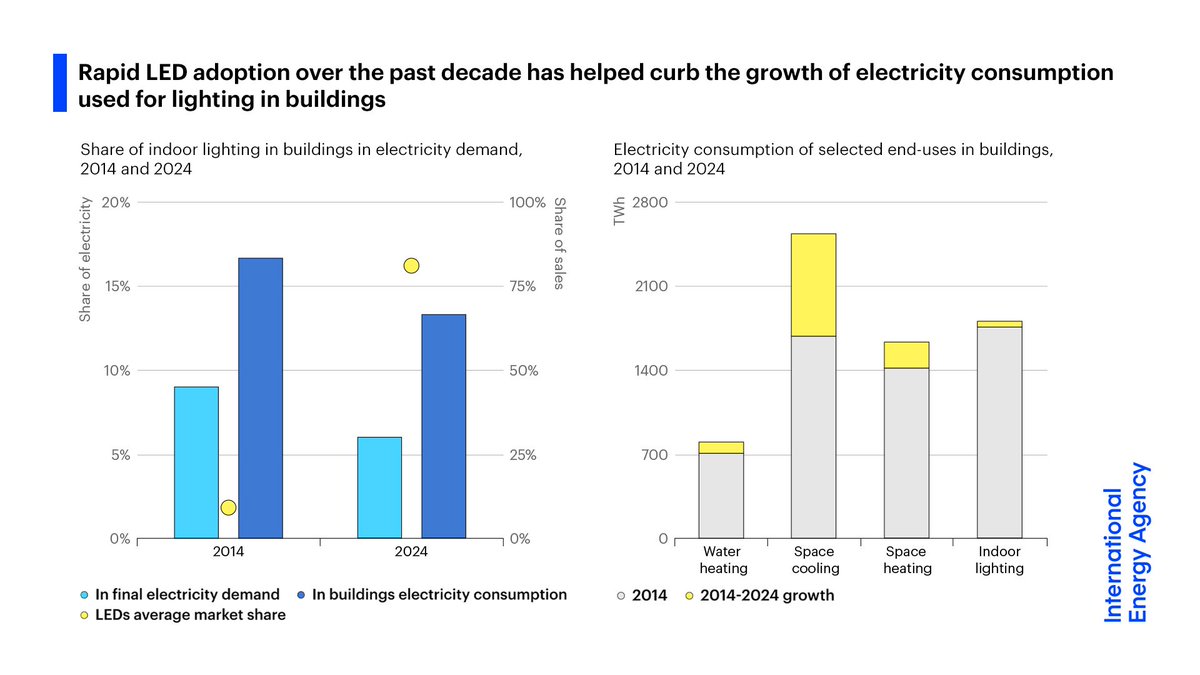
Lighting's share of building electricity and LED market share | Lighting's share of final electricity fell from 9% to 6% as LED share jumped
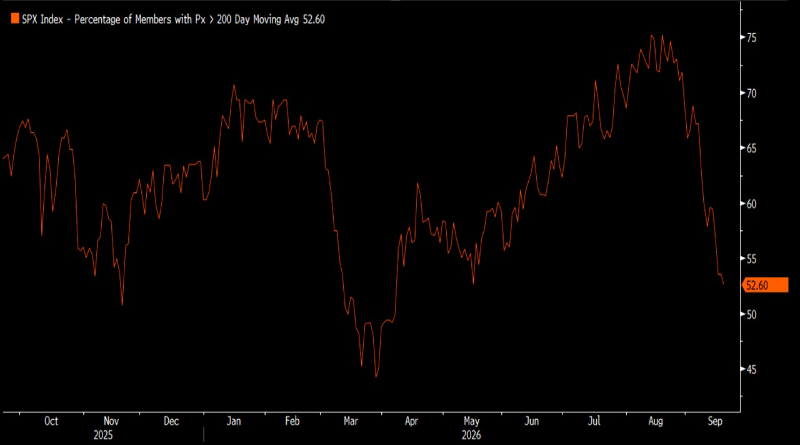
Percentage of S&P 500 members trading above the 200-day moving average | Now 52.6%, down sharply from over 75% in August
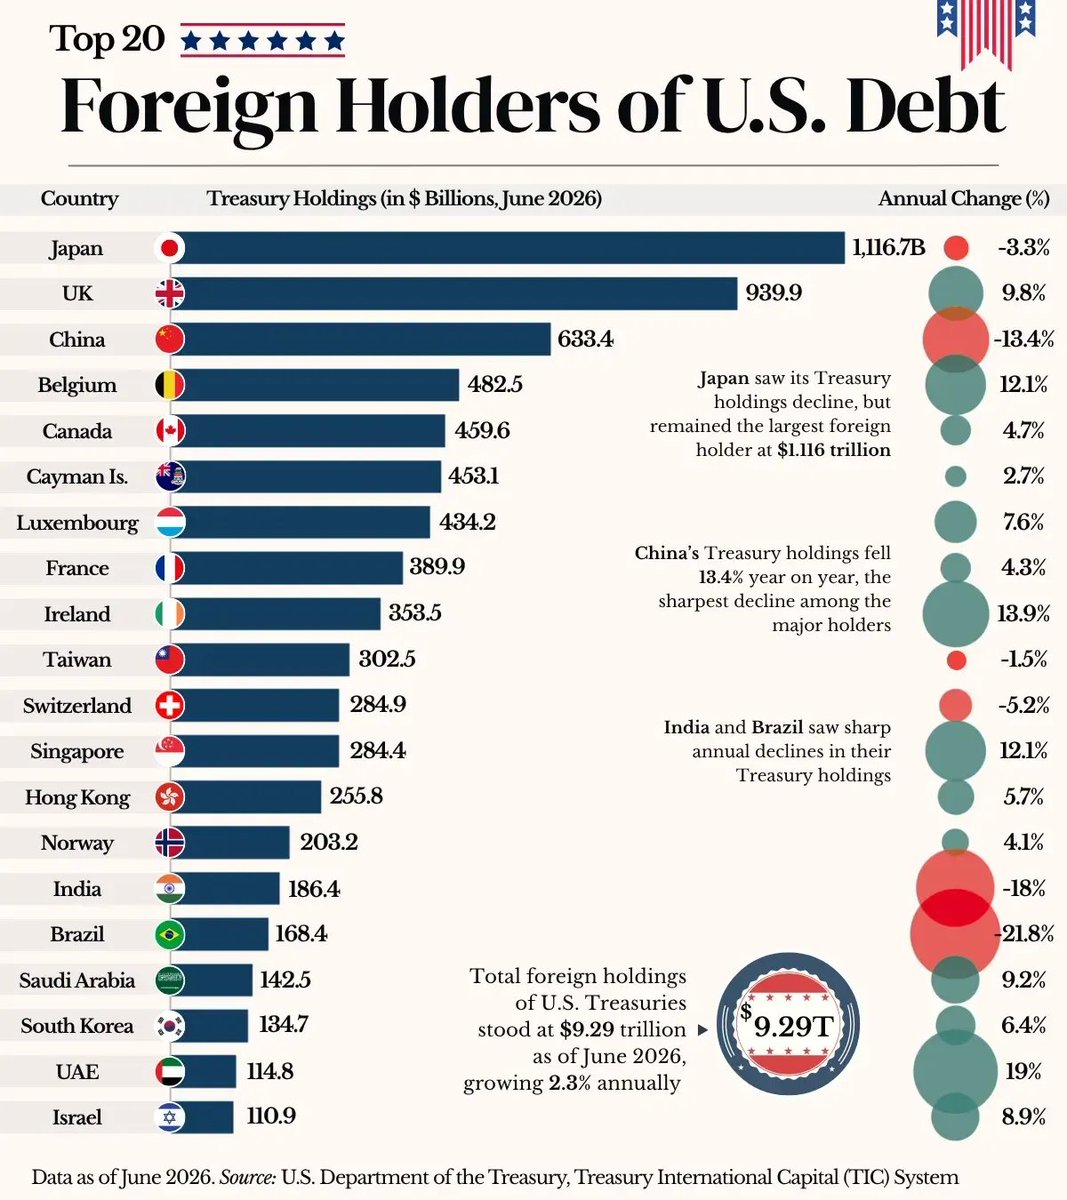
Foreign holdings of US Treasuries by country, June 2026 | Japan $1.12tn, UK $940bn, China $633bn, totaling $9.29tn

Oktoberfest one-litre beer price over time, in euros | About €3.55 in 1990, rising to roughly €15 in 2026
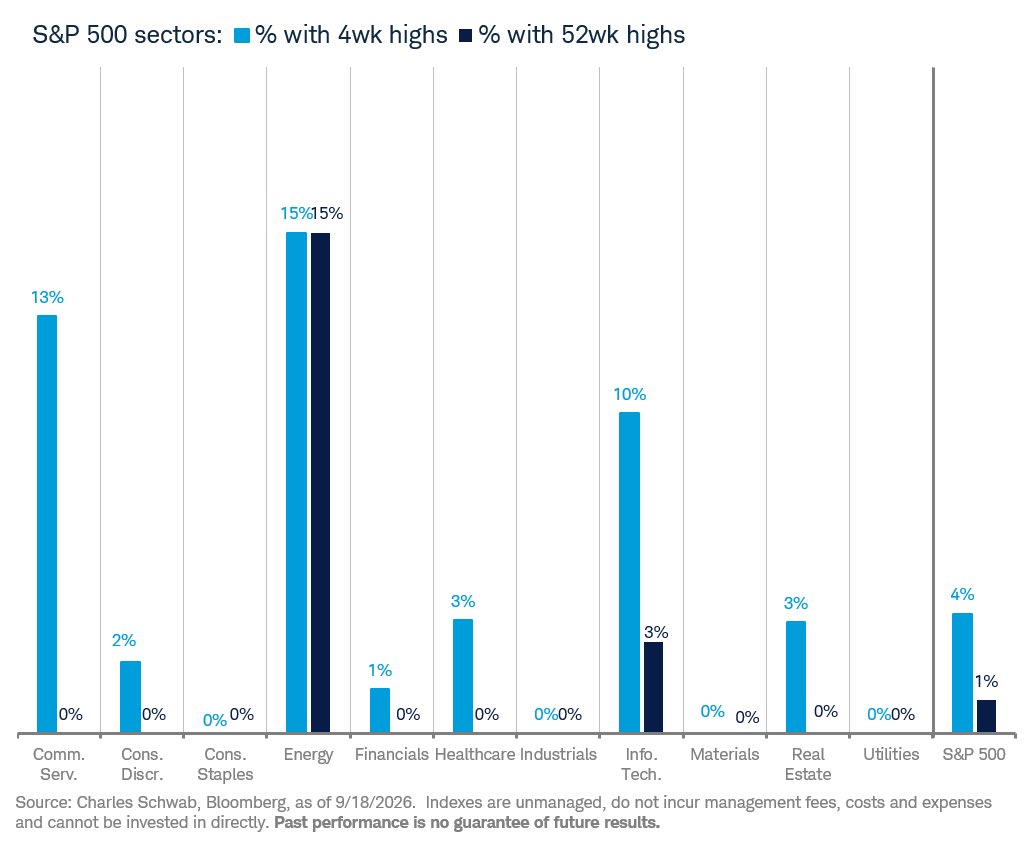
Share of S&P 500 stocks at 4-week and 52-week highs, by sector | Energy tops both at 15%, while the full index sits at 4% and 1%
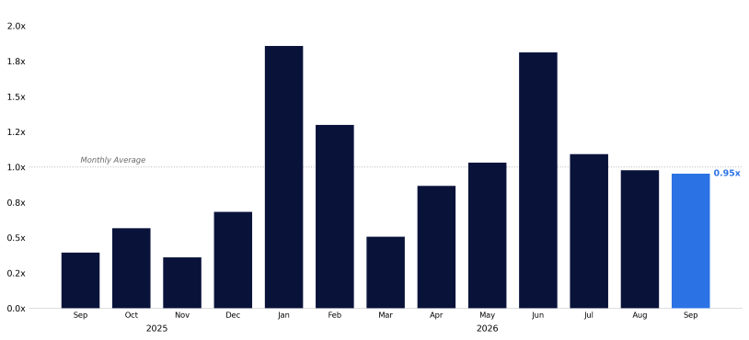
Monthly retail trading activity relative to its monthly average | September 2026 at 0.95x, below the longer-run average
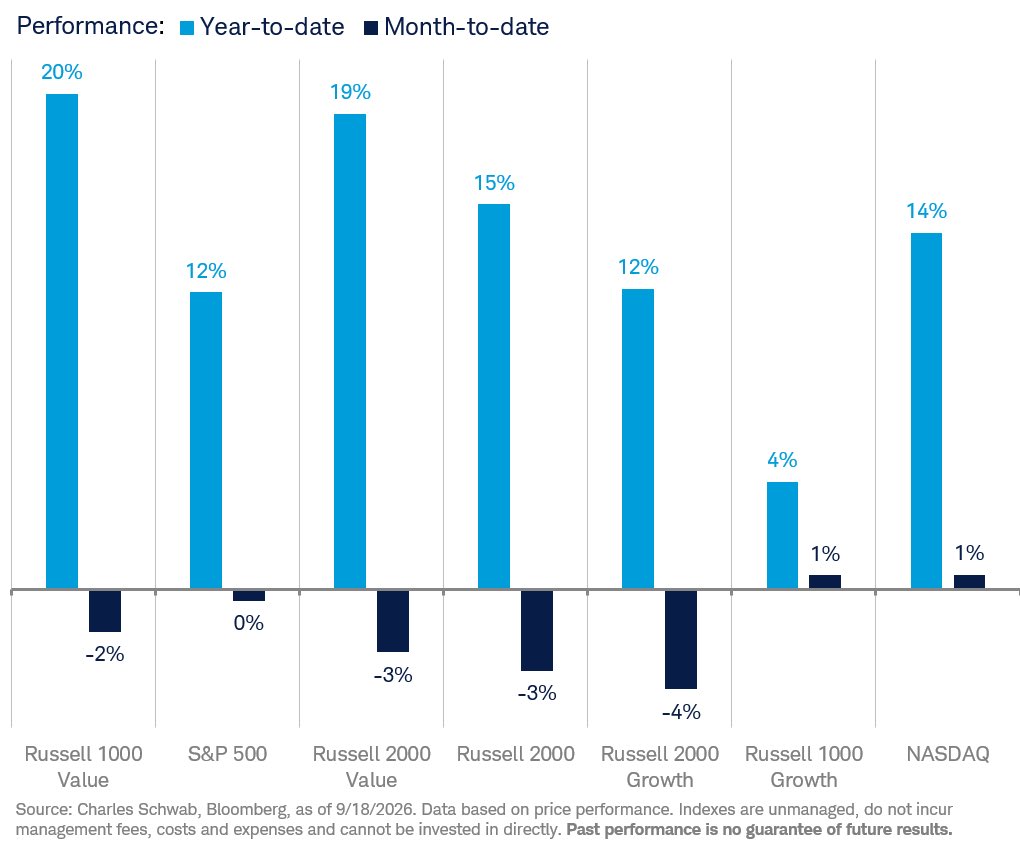
Year-to-date vs month-to-date performance of major US indexes | Russell 1000 Value +20% YTD led, most indexes down month-to-date
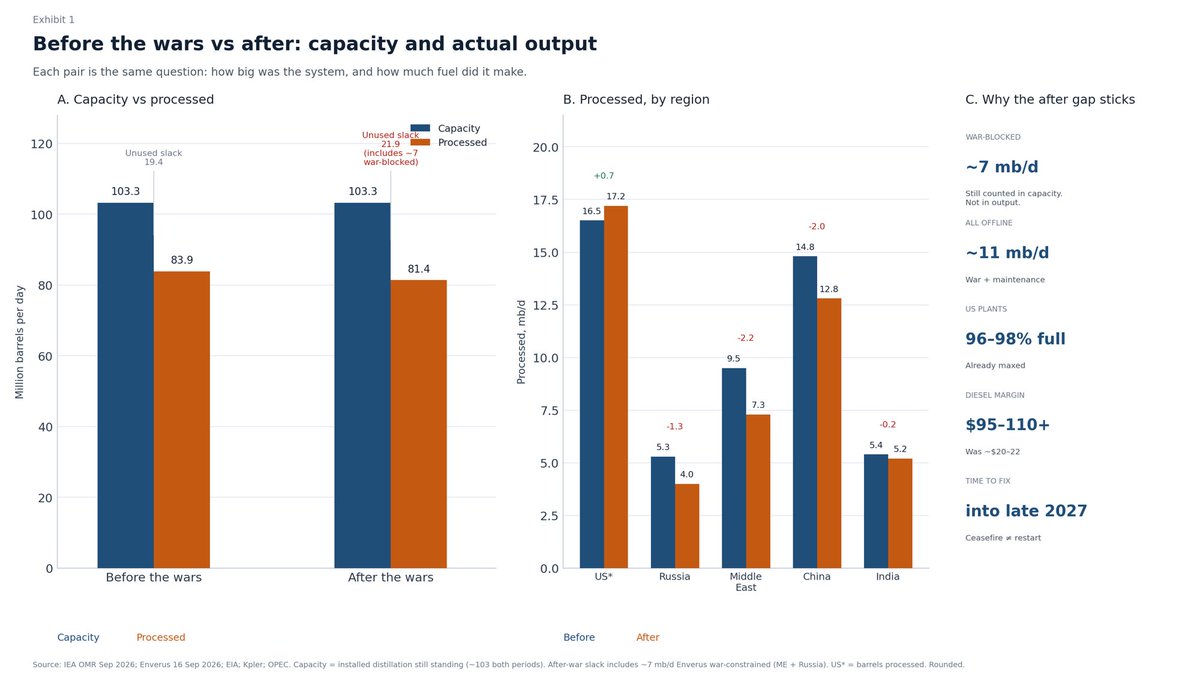
Global refining capacity vs actual runs | 103.3 mb/d capacity but only 81.4 processed, with Russia and the Gulf the biggest gaps
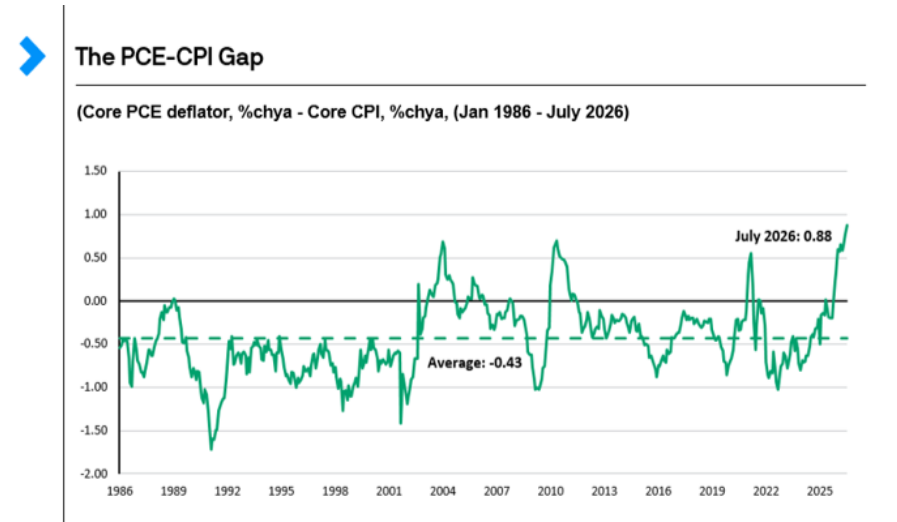
Core PCE deflator minus core CPI, year-over-year, since 1986 | July 2026 at +0.88, far above the long-run average of -0.43
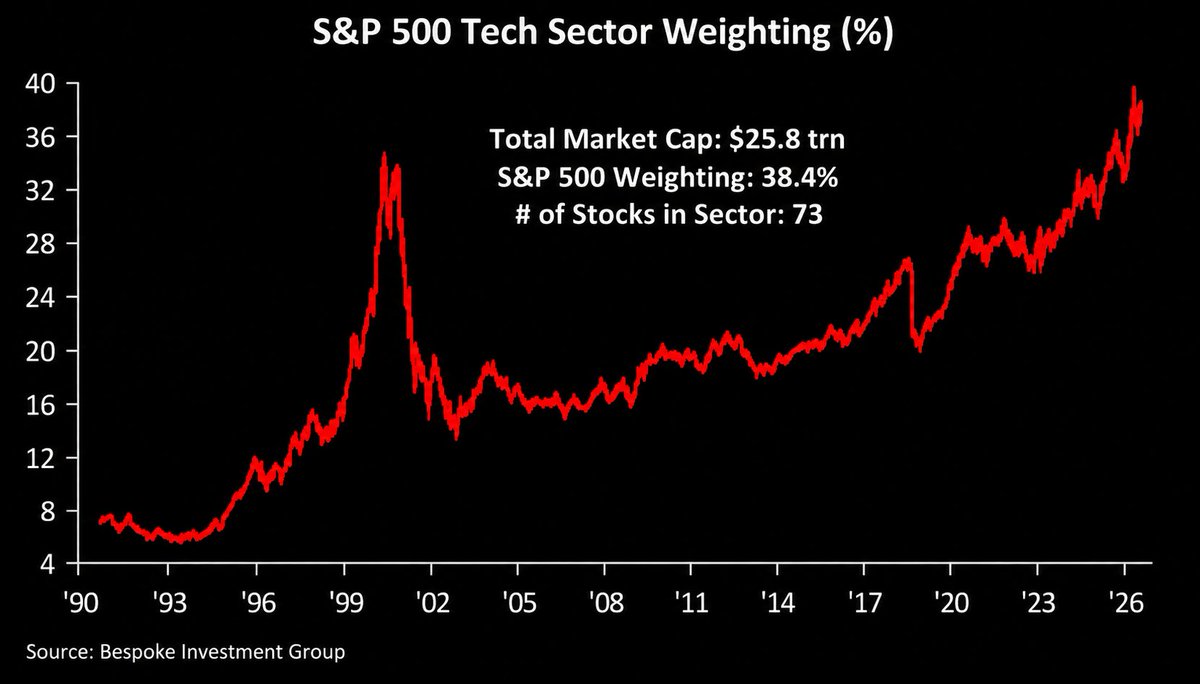
S&P 500 technology sector weighting, 1990-2026 | Now 38.4%, above the roughly 34% peak of the 2000 dot-com bubble
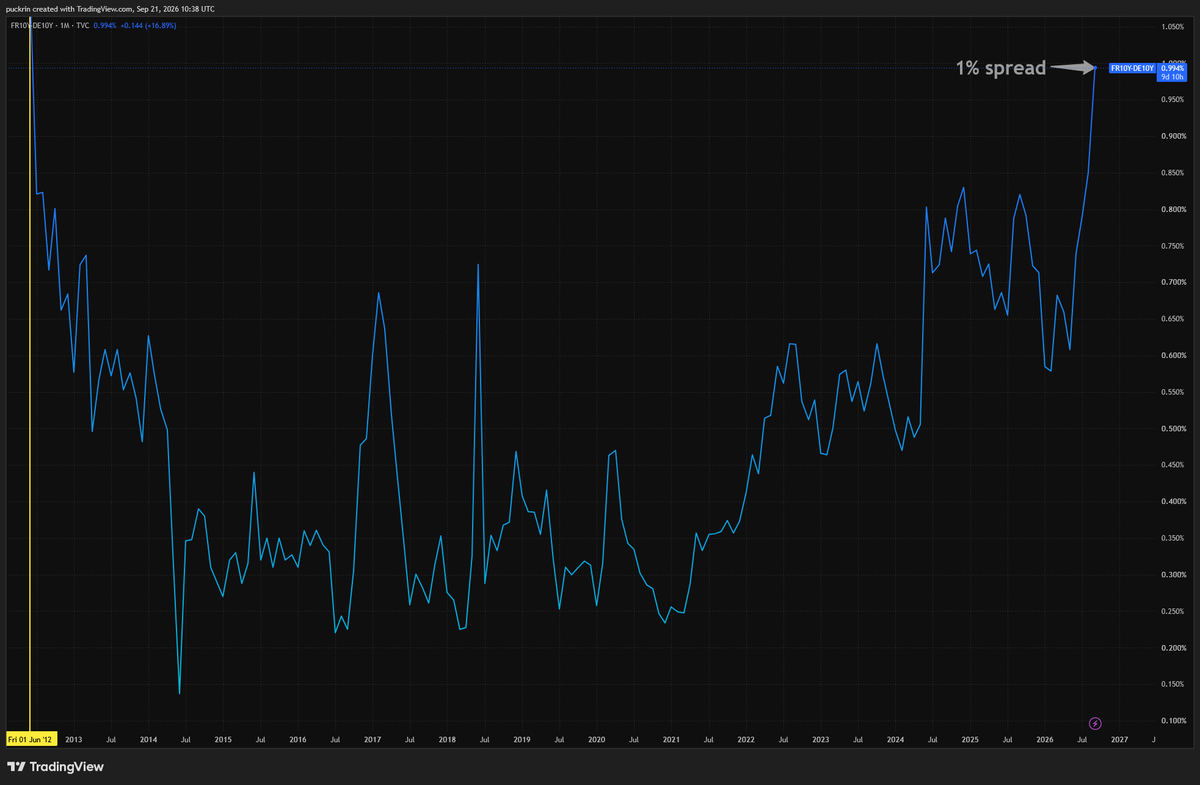
France minus Germany 10-year government bond yield spread | About 0.99%, the widest since 2012
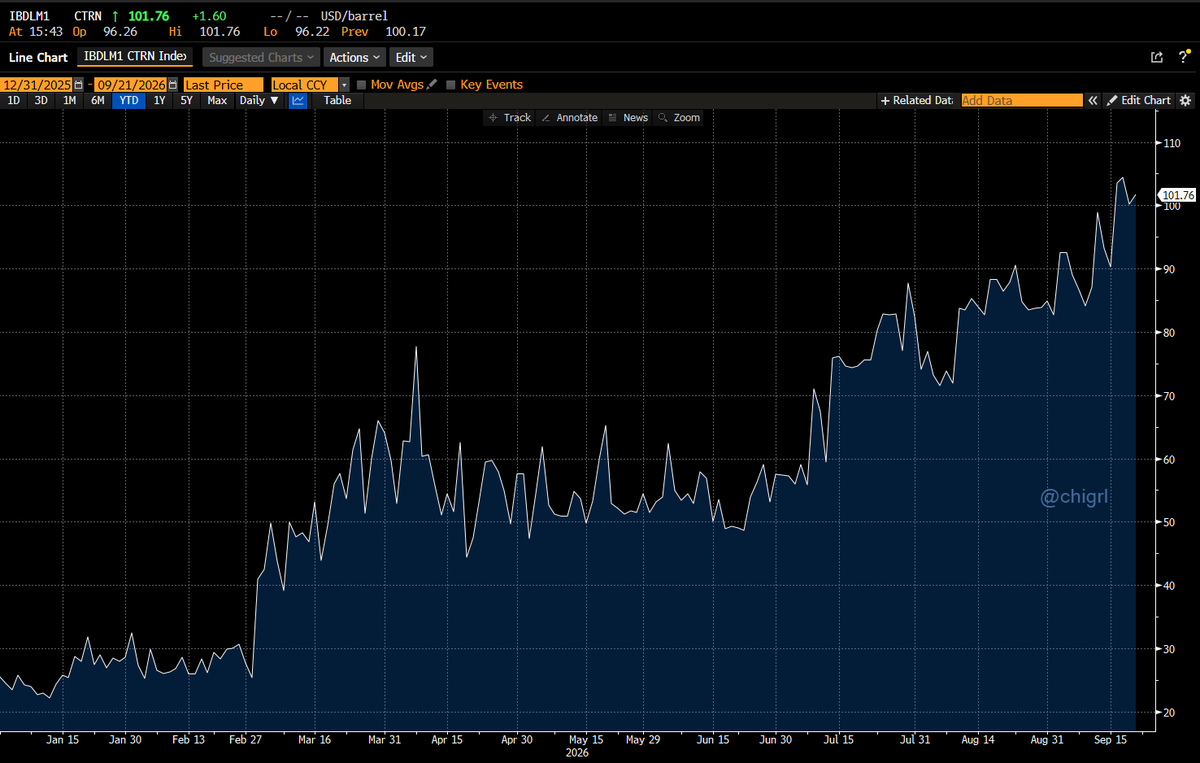
Diesel crack spread year-to-date in 2026 | Up from about $25 to roughly $102/barrel, a year-to-date high
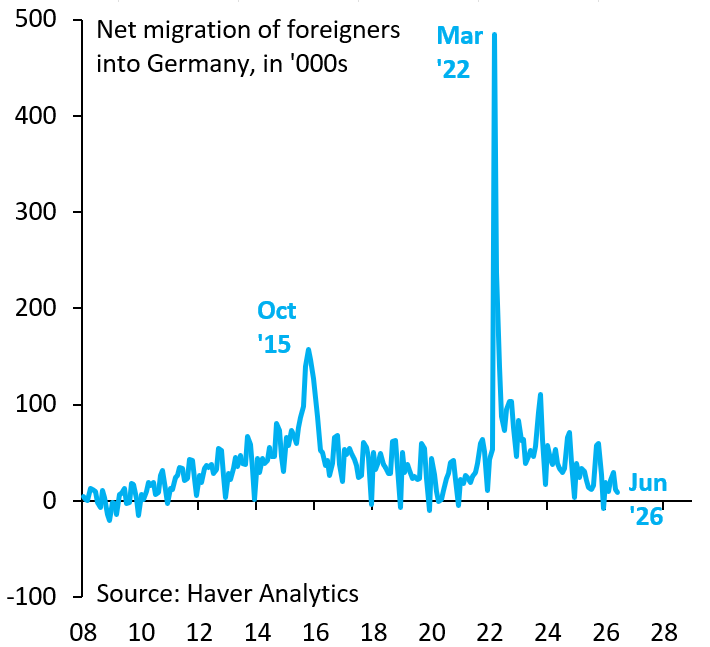
Germany net migration of foreigners, in thousands | Peaked near 483k in March 2022, back to about zero by June 2026
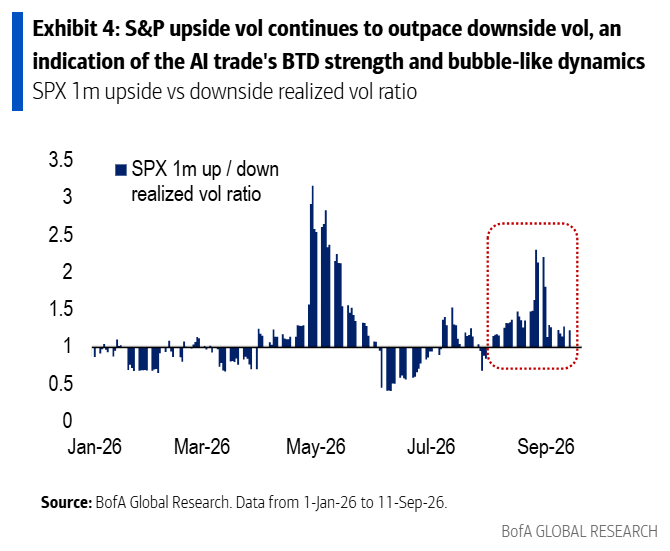
SPX 1-month upside vs downside realized volatility ratio | Recently above 1, with upside vol exceeding downside
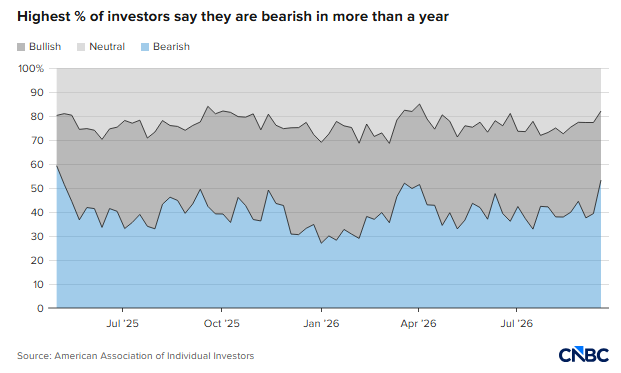
AAII individual-investor bull/neutral/bear sentiment shares | Bearish share rises to about 53%, the highest in over a year
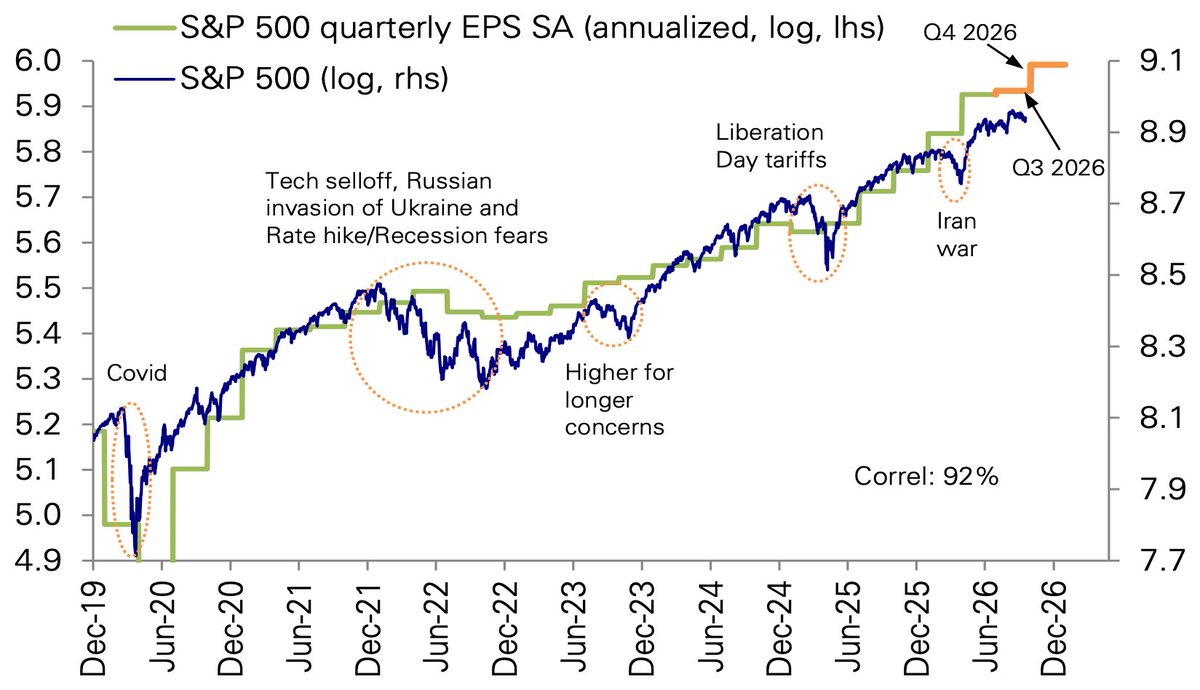
S&P 500 quarterly annualized EPS vs the index, log scale | 92% correlation, with Q3 and Q4 2026 earnings estimated higher
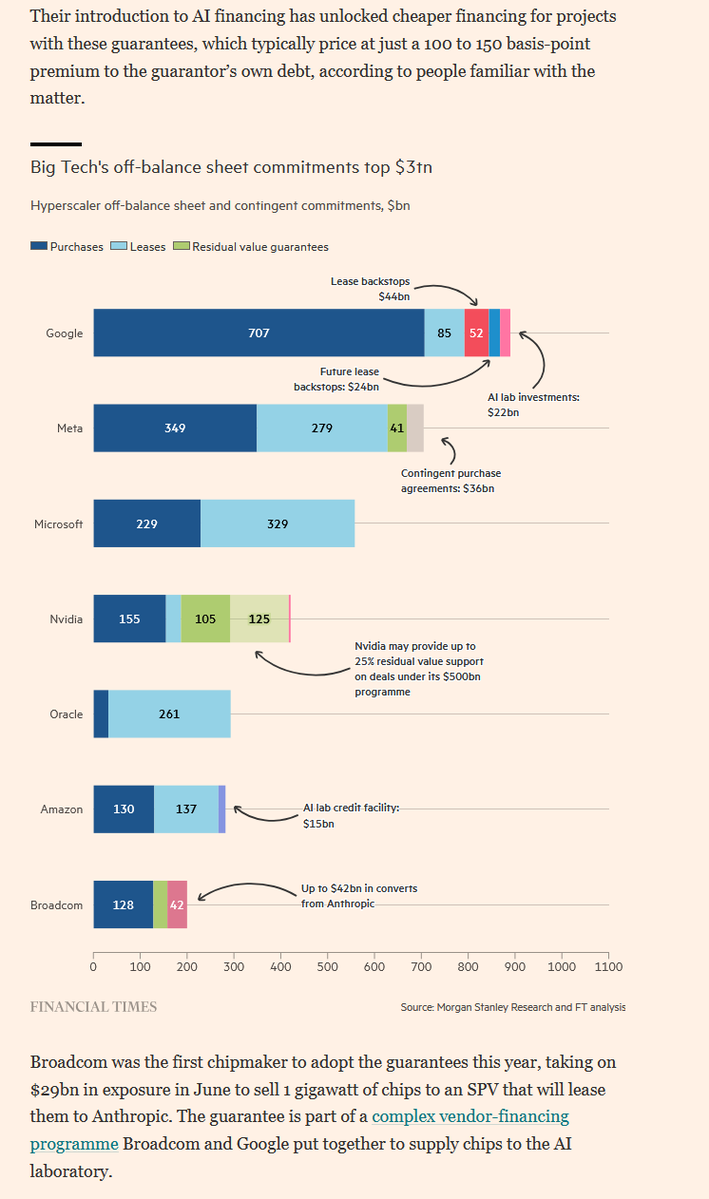
Hyperscaler off-balance-sheet and contingent commitments, $bn | Total exceeds $3tn, with Google at ~$866bn and Meta at ~$705bn
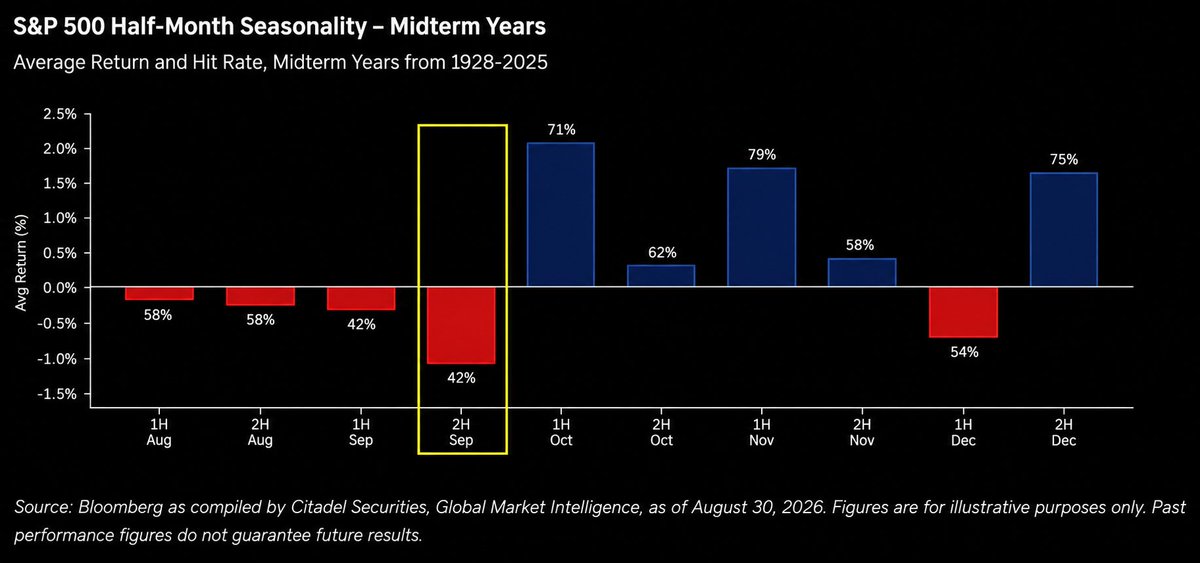
S&P 500 half-month seasonality in midterm years, 1928-2025 | Late September averages -1.1% with a 42% positive rate, rebounding from October
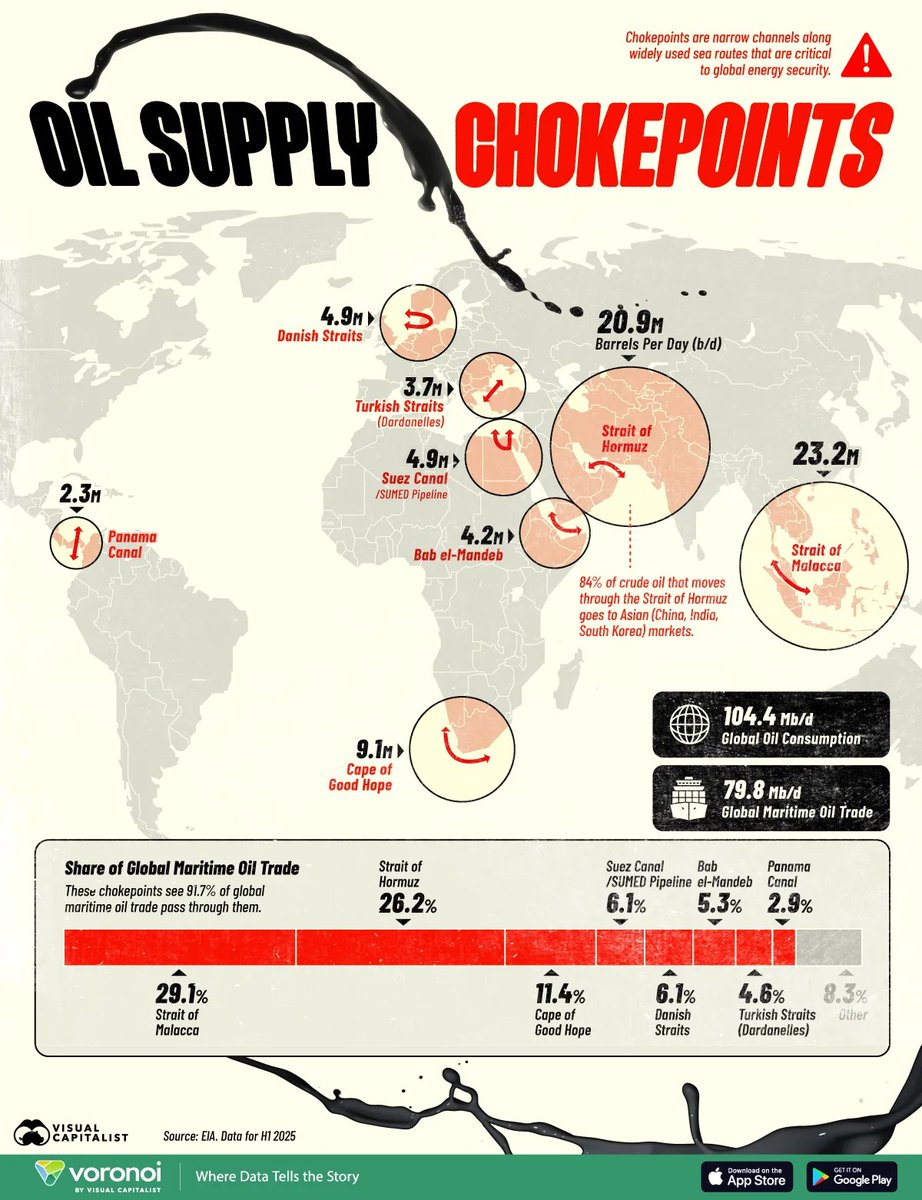
Global oil maritime chokepoints, b/d | Malacca moves 23.2M b/d and Hormuz 20.9M b/d, 26.2% of seaborne trade
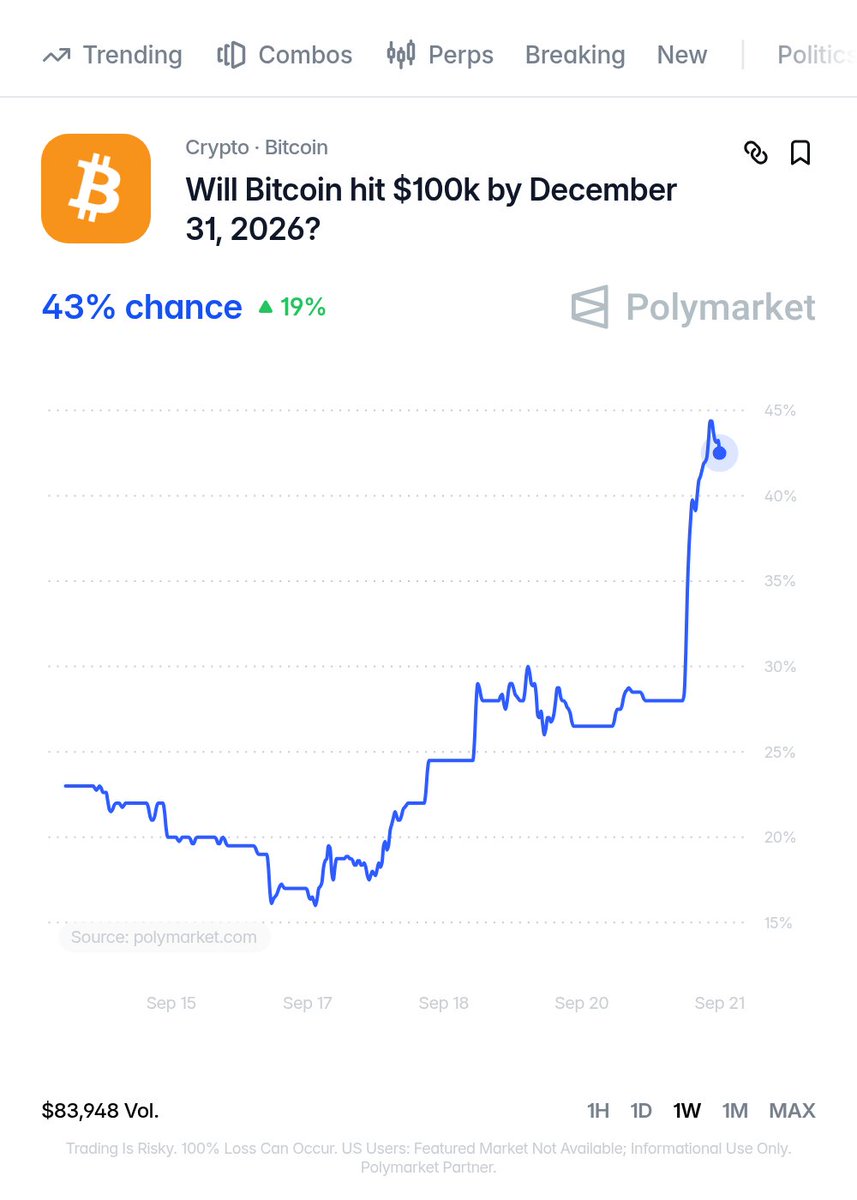
Polymarket odds of Bitcoin hitting $100k by December 31 | Now 43%, up from about 15% a week earlier
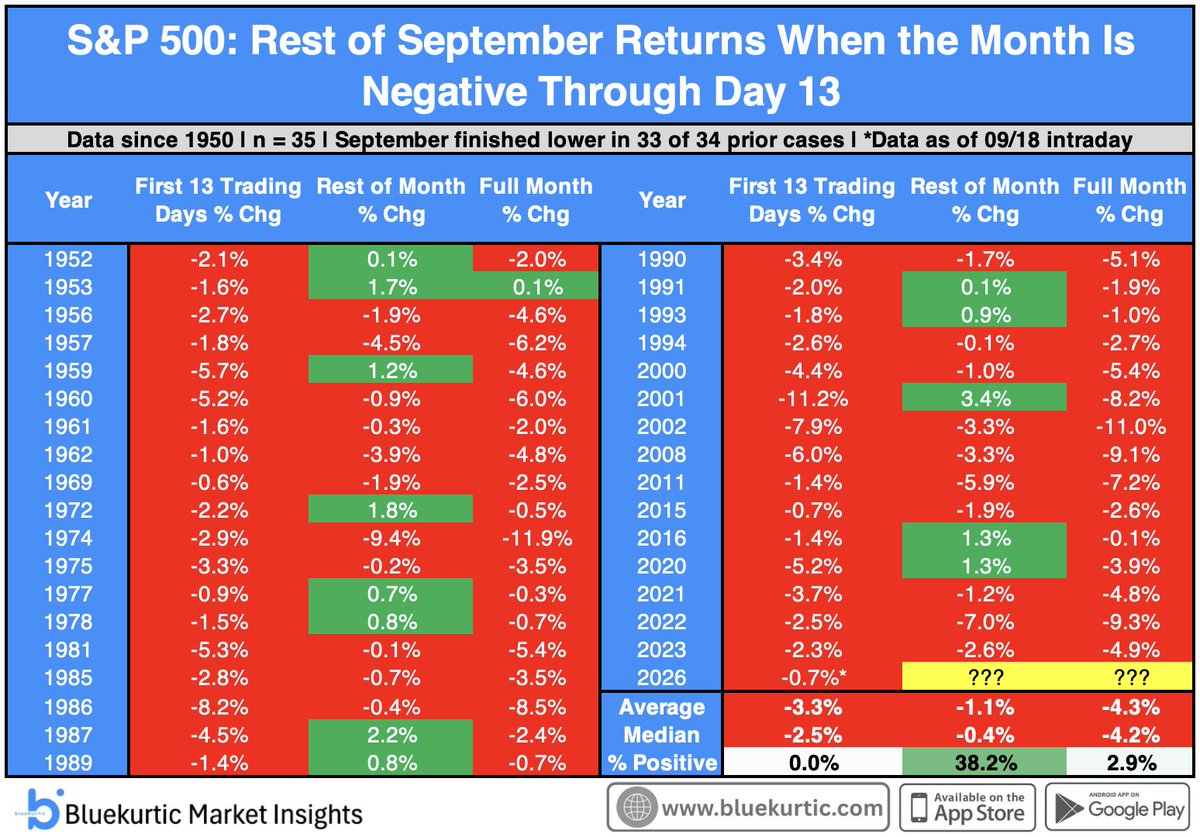
S&P 500 rest-of-September returns after a negative first 13 days, since 1950 | Rest of month is positive only 38.2% of the time, averaging -1.1%
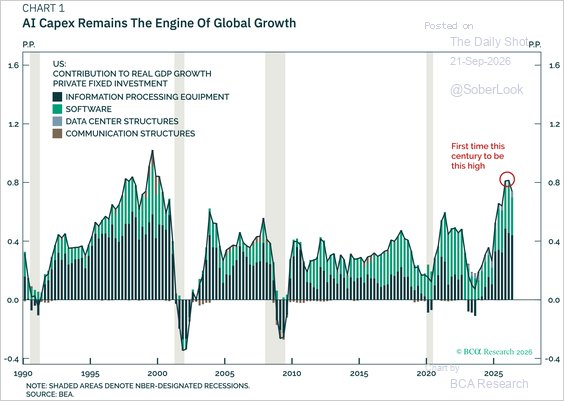
US AI-related investment contribution to real GDP growth | About 0.8pp in 2026, the highest since 2000
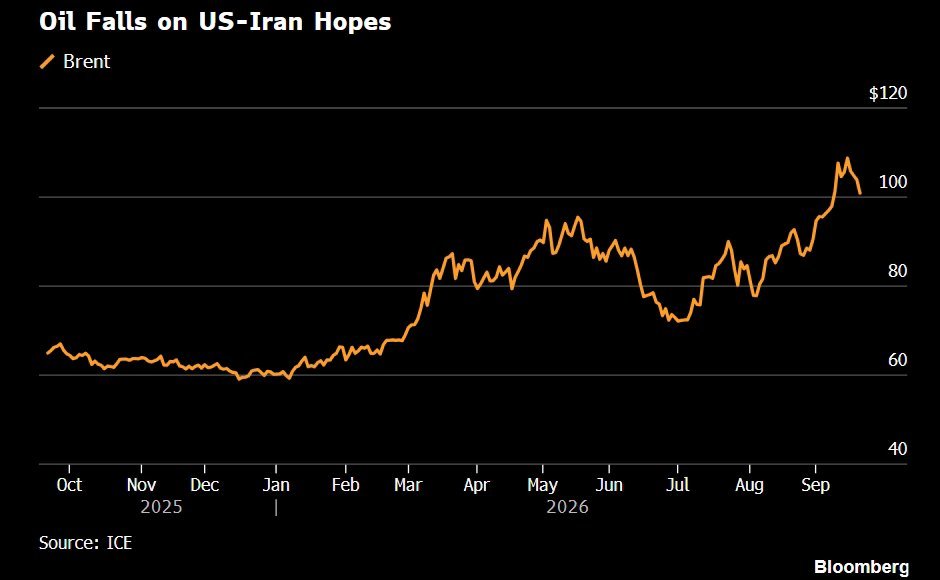
Brent crude price, daily | After peaking near $107 in September, Brent has slipped to around $97
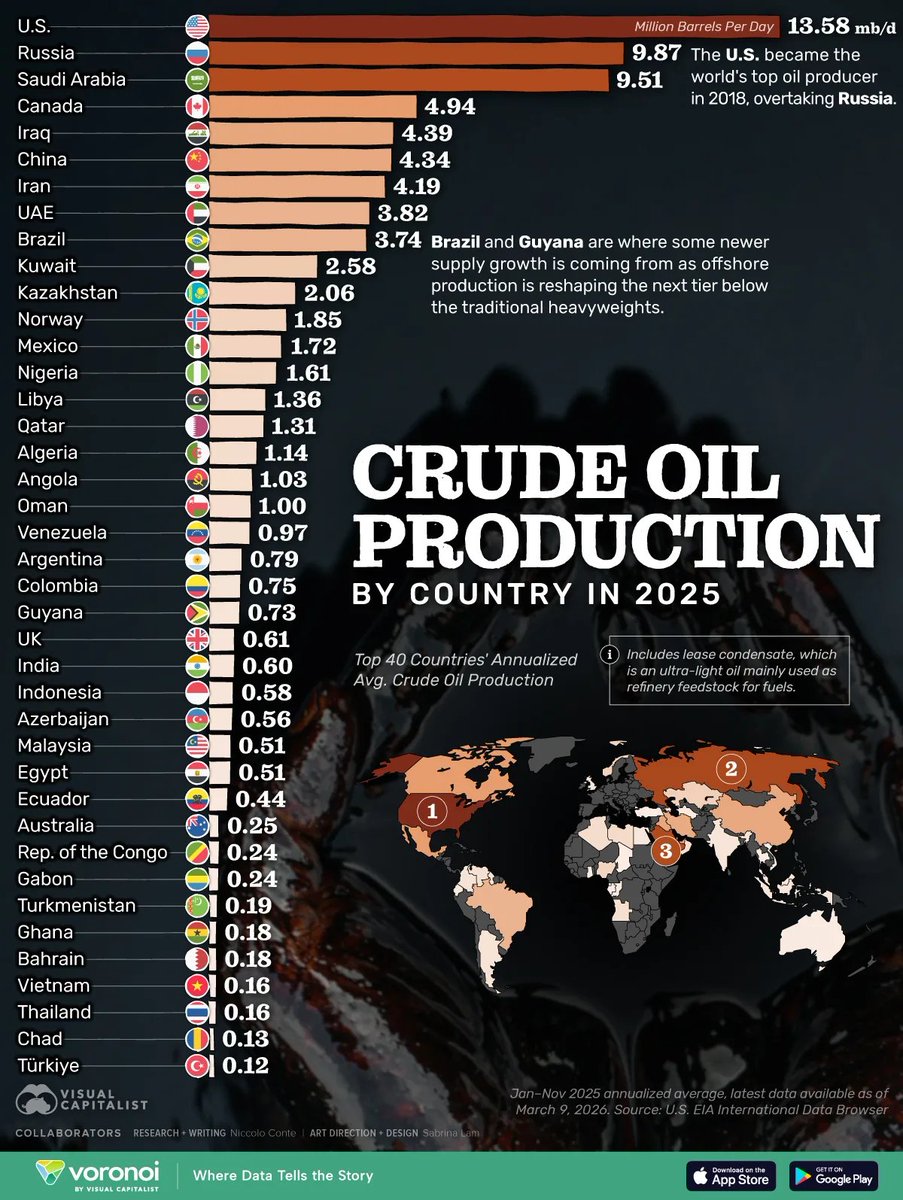
Annualized crude oil production by country, 2025 | US 13.58, Russia 9.87, Saudi Arabia 9.51 mb/d
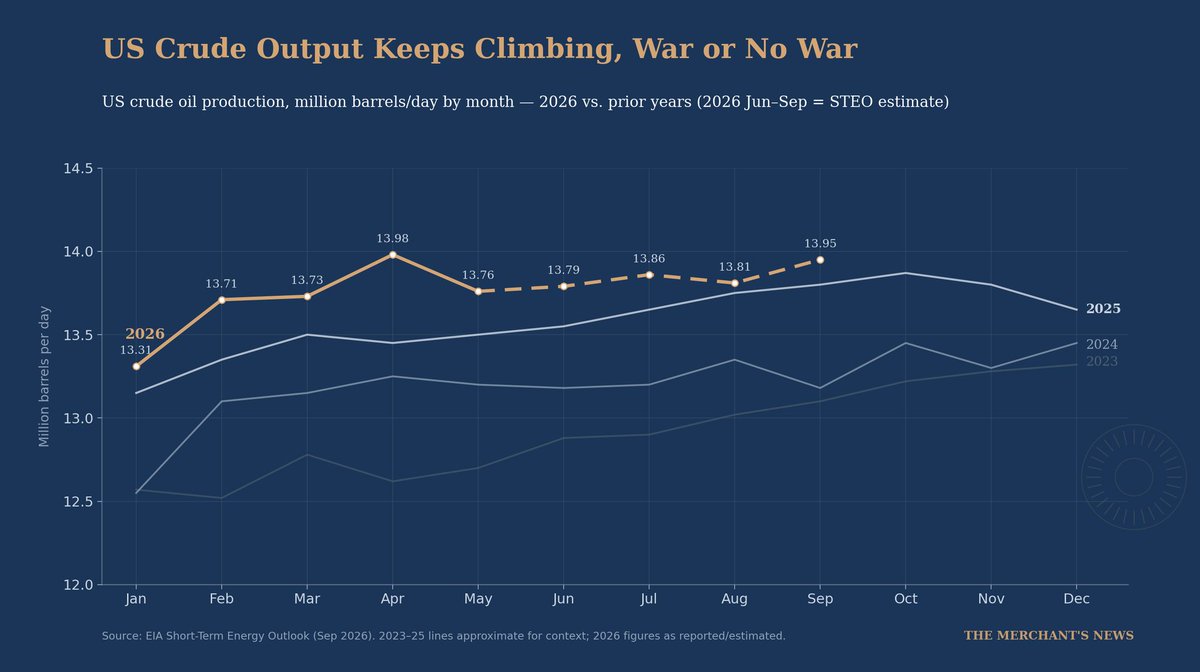
US crude oil production by month, 2026 vs prior years, million b/d | April peaked at 13.98M and September is estimated at 13.95M, above every prior year
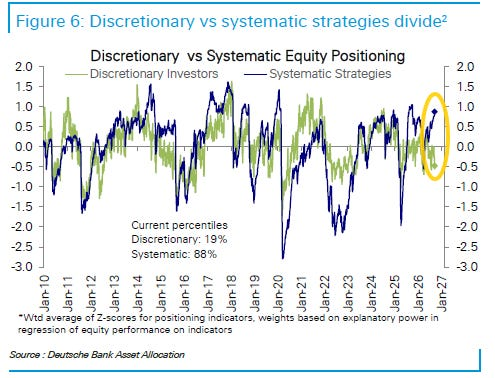
Discretionary vs systematic equity positioning | Discretionary at the 19th percentile, systematic at the 88th
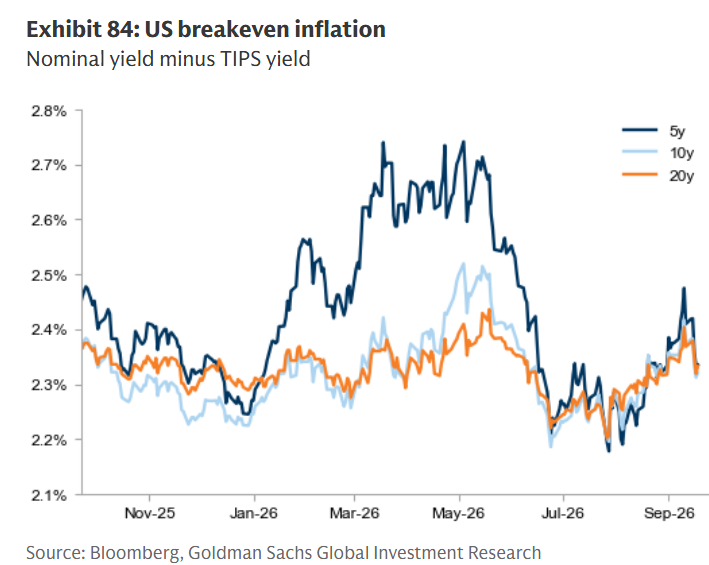
US breakeven inflation, nominal minus TIPS yield | 5y, 10y and 20y converge near 2.3%-2.4%
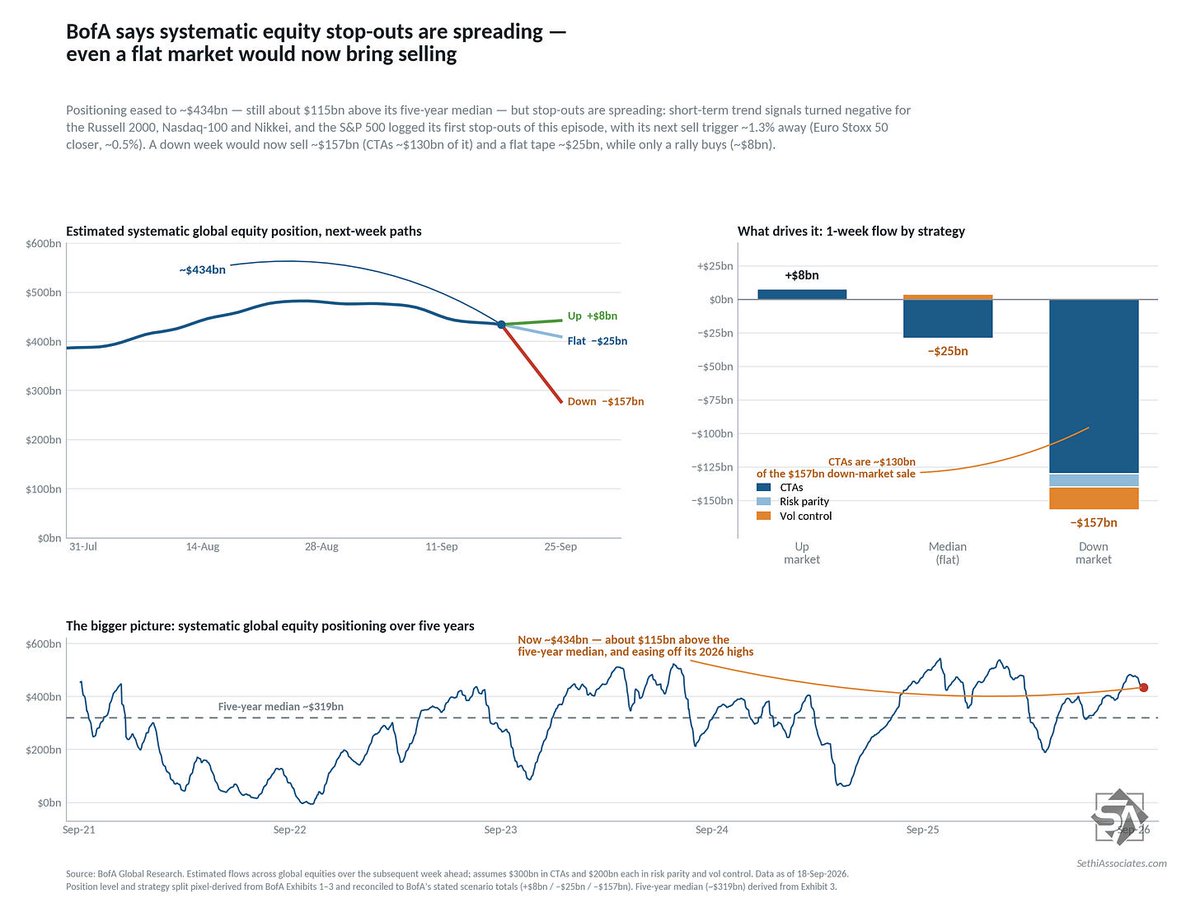
Estimated systematic global equity positioning and next-week flow paths | Now ~$434bn, ~$115bn above the five-year median; a down week would sell ~$157bn
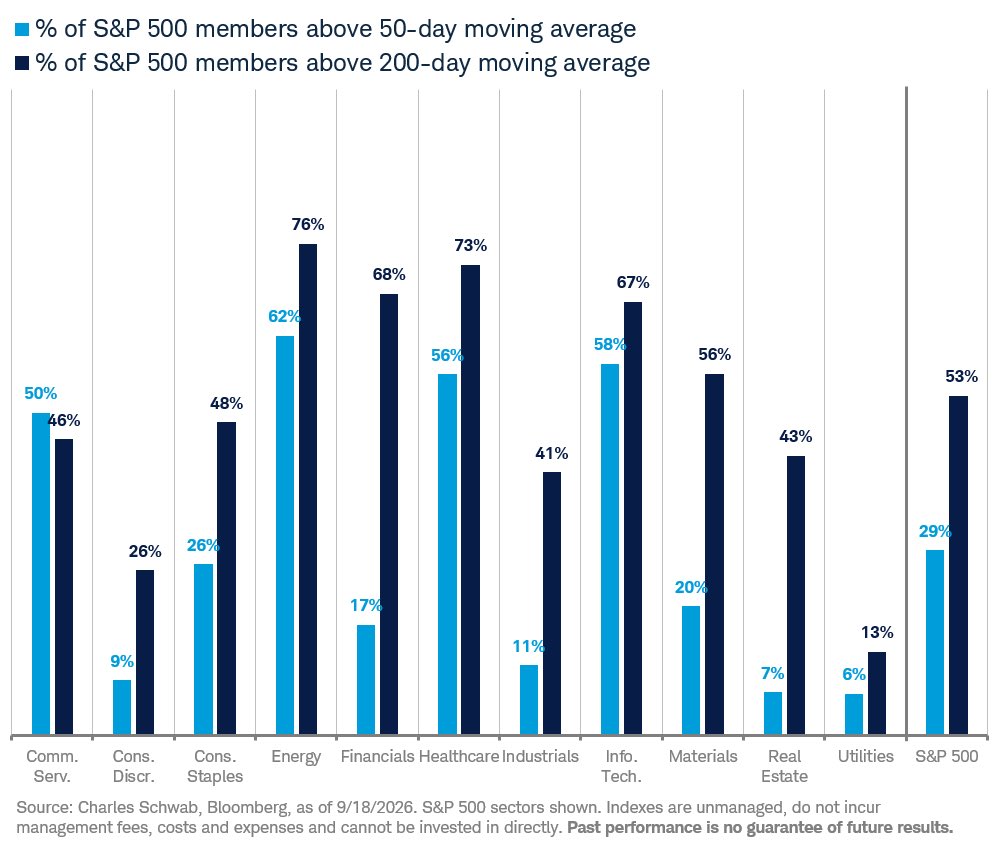
Share of S&P 500 members above 50-day and 200-day moving averages, by sector | Energy strongest at 62%/76%, Utilities weakest at 6%/13%
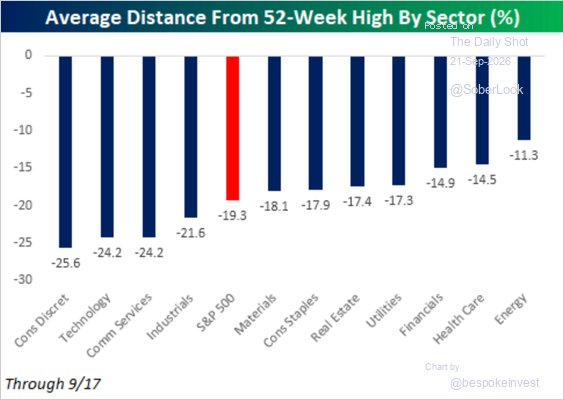
Average distance from 52-week high by sector | Consumer Discretionary -25.6% is deepest, Energy -11.3% shallowest, S&P 500 -19.3%
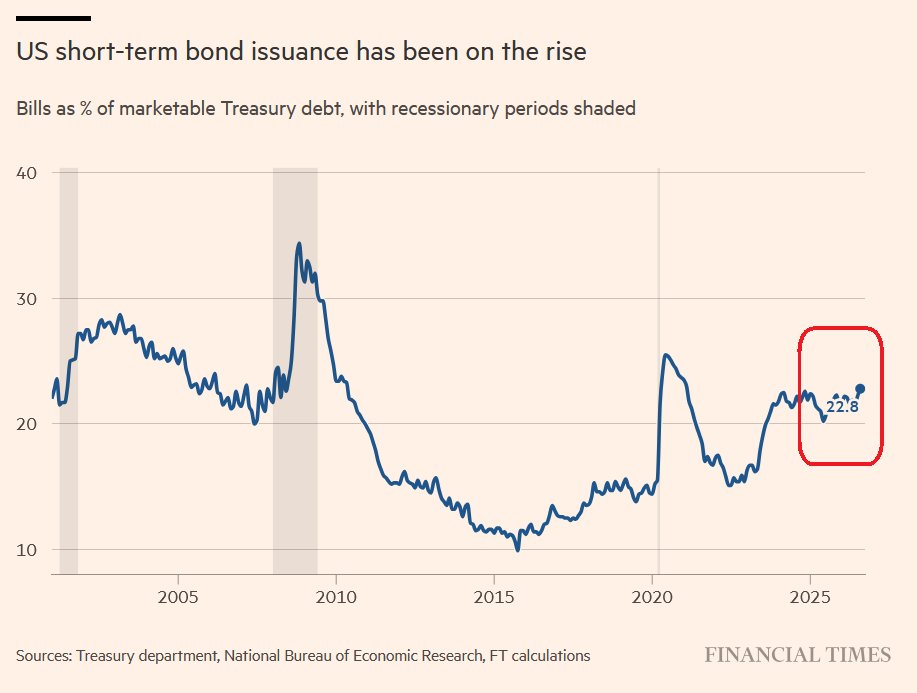
US Treasury bills as a share of marketable debt | Now 22.8%, the highest since the GFC outside the 2020 spike
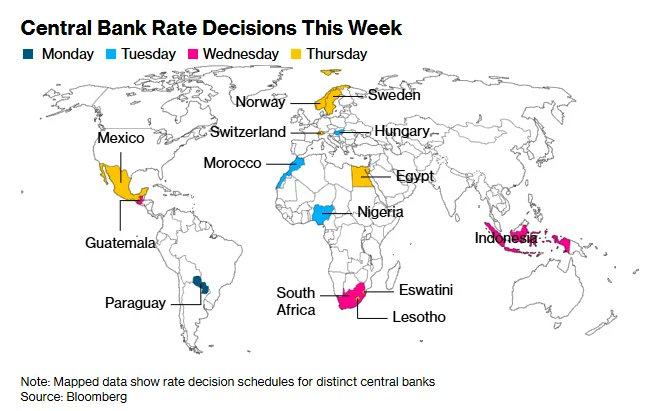
Central-bank rate-decision calendar this week | Covers Norway, Sweden, Switzerland, South Africa, Indonesia and others across Monday-Thursday
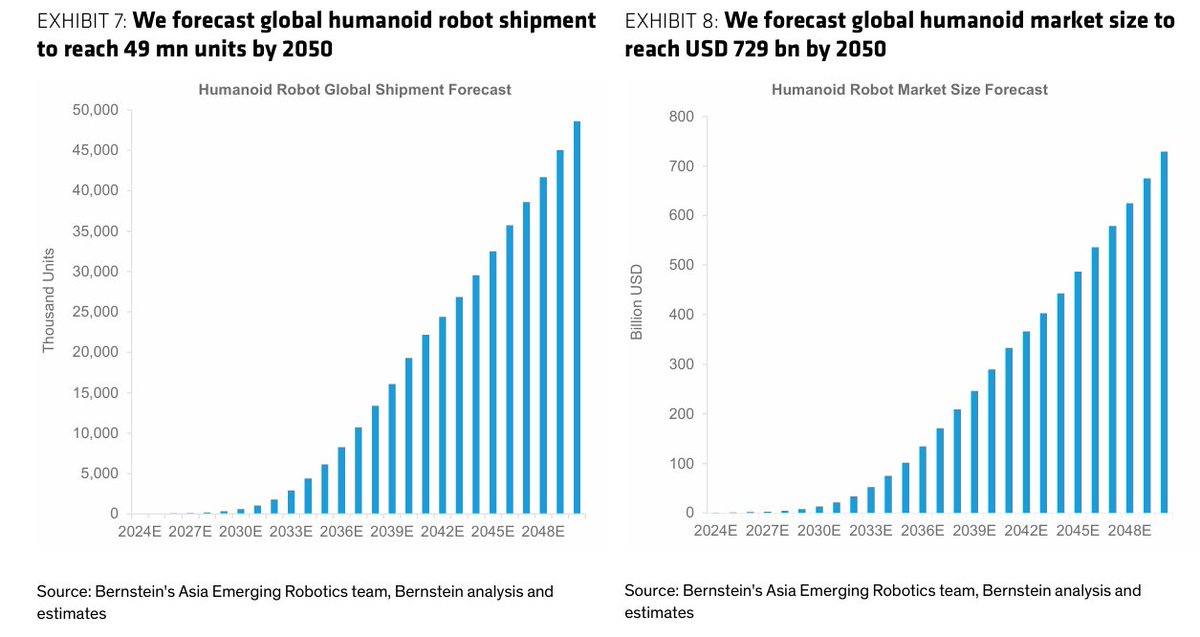
Global humanoid robot shipment and market-size forecast | 49mn units and about $729bn by 2050
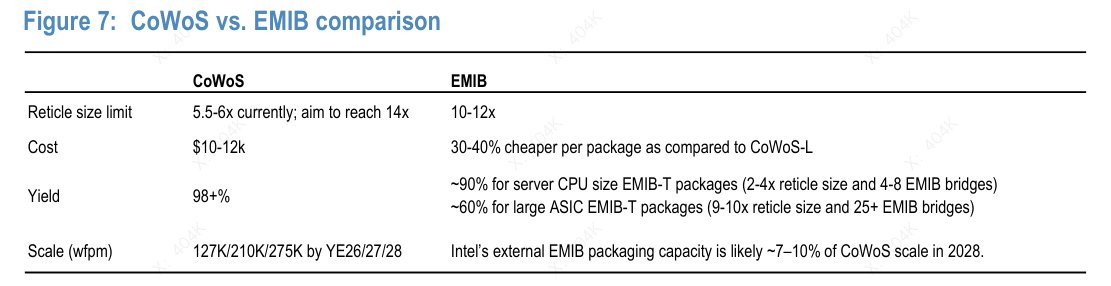
TSMC CoWoS vs. Intel EMIB advanced-packaging comparison | CoWoS delivers 98%+ yield; EMIB is 30-40% cheaper at 10-12x reticle
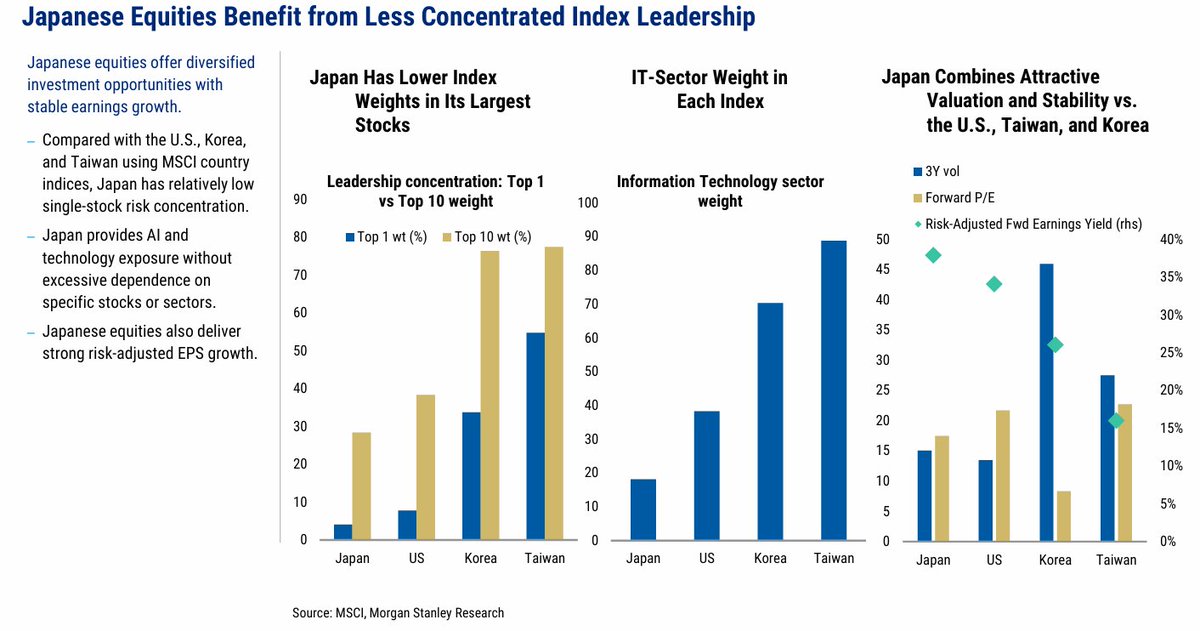
Single-stock and IT-sector concentration across Japan, US, Korea, Taiwan | Japan's top-10 weight is 29% and IT weight 18%, the lowest of the four
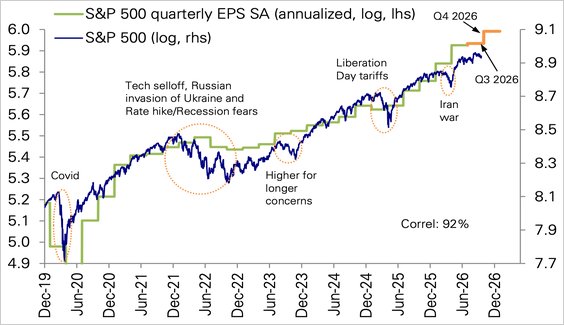
S&P 500 index vs quarterly EPS, log scale, since end-2019 | The two move together with a 92% correlation as earnings pull the index higher
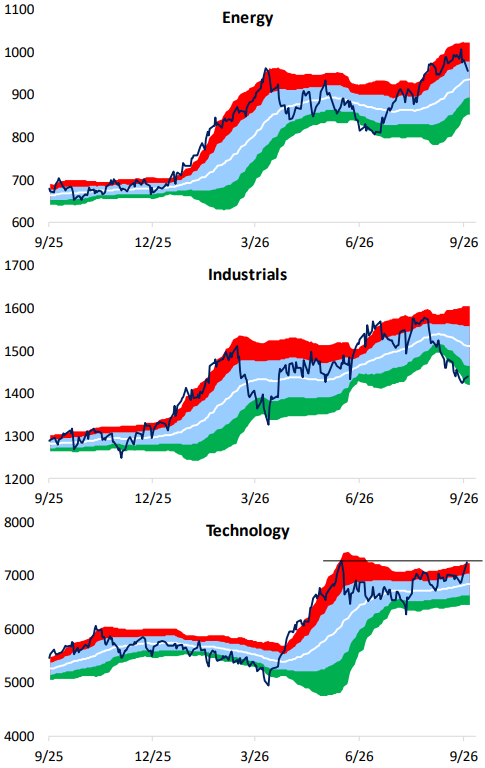
Energy, Industrials and Technology sector price and trading ranges | Tech near the upper band and new highs, Industrials in oversold territory
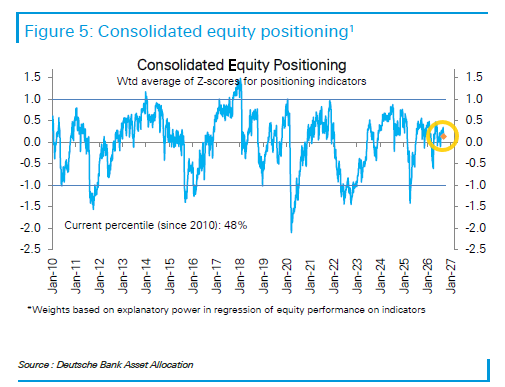
Weighted-average z-score of equity positioning indicators, since 2010 | Now back near zero, in the 48th percentile since 2010
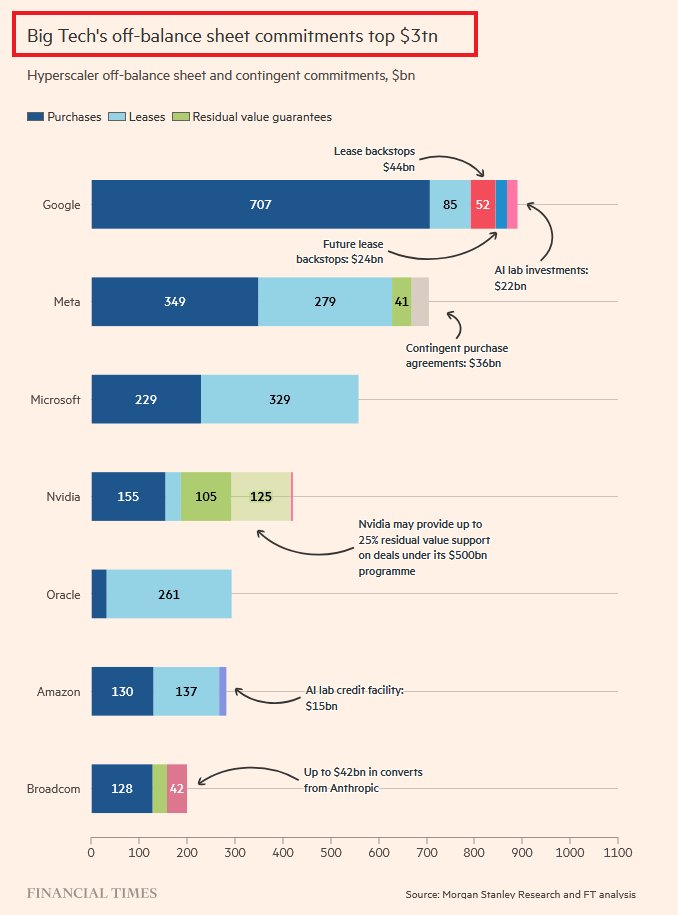
Hyperscaler off-balance-sheet and contingent commitments, $bn | Total tops $3tn; Google ~$866bn, Microsoft ~$558bn
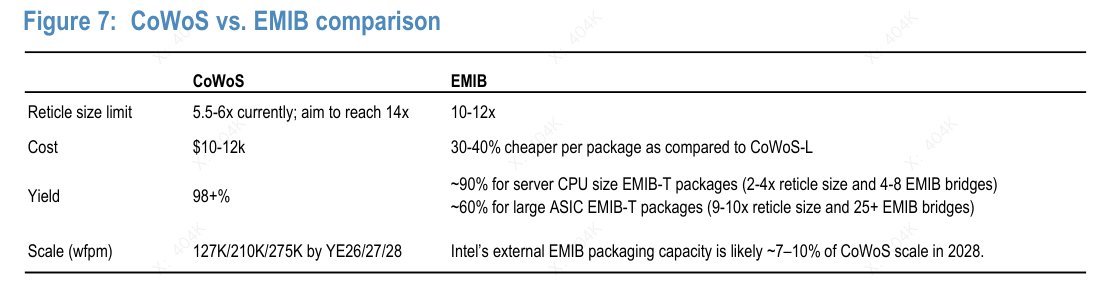
TSMC CoWoS vs. Intel EMIB advanced-packaging comparison | CoWoS delivers 98%+ yield; EMIB is 30-40% cheaper at 10-12x reticle
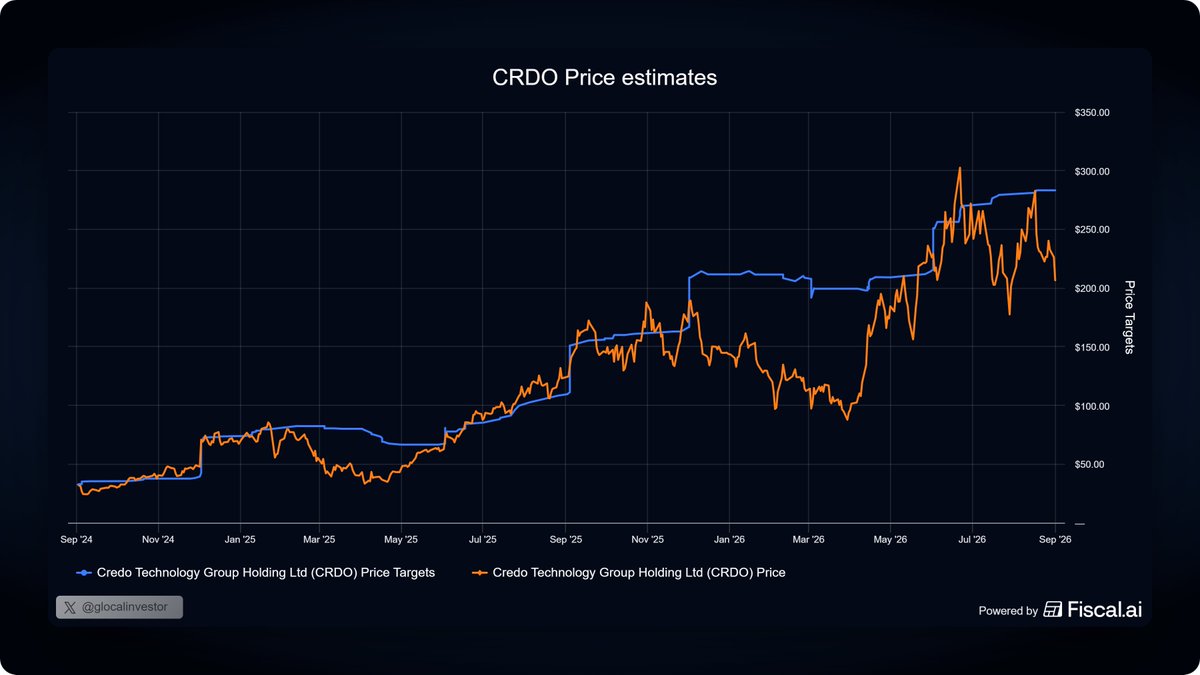
Credo Technology share price vs sell-side estimates | Up from about $30 in September 2024 to a peak near $300, now around $210
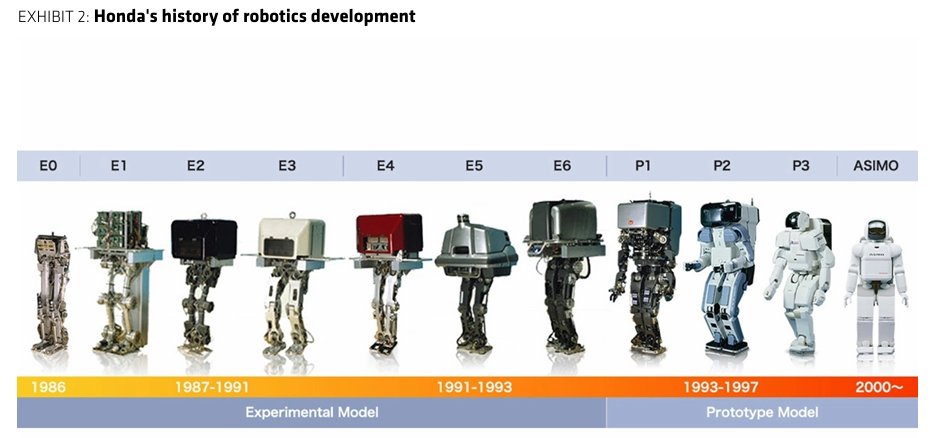
Honda's bipedal robot models over time | From E0 to ASIMO, spanning 1986 to 2000, across experimental and prototype models
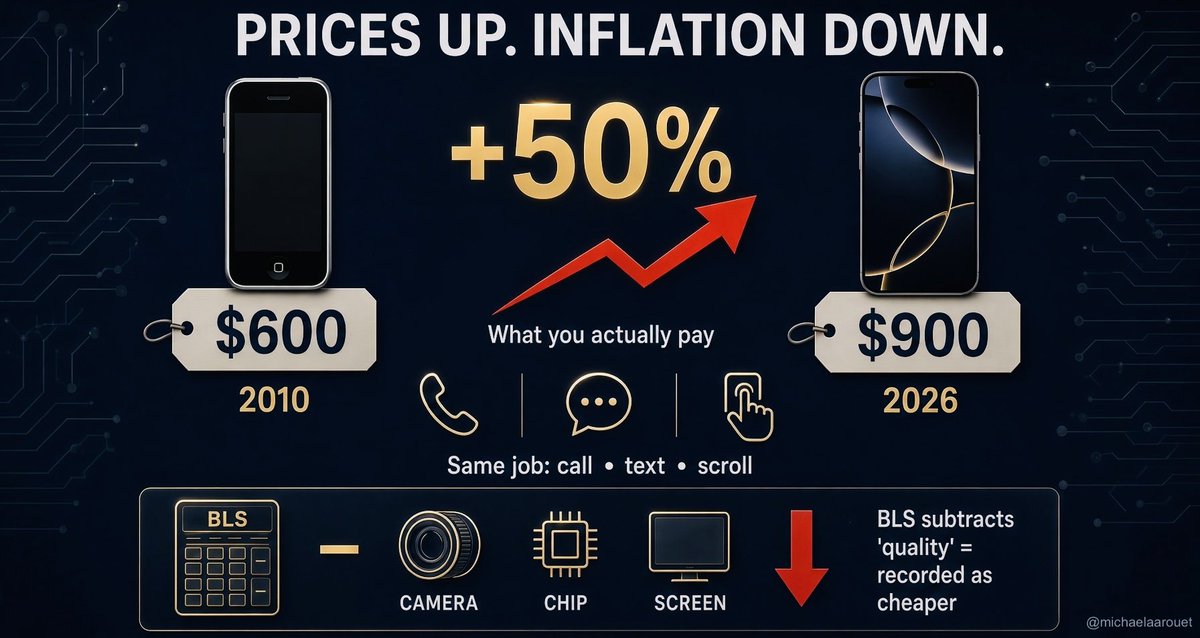
iPhone nominal price vs official inflation treatment | $600 in 2010 to $900 in 2026, a 50% rise
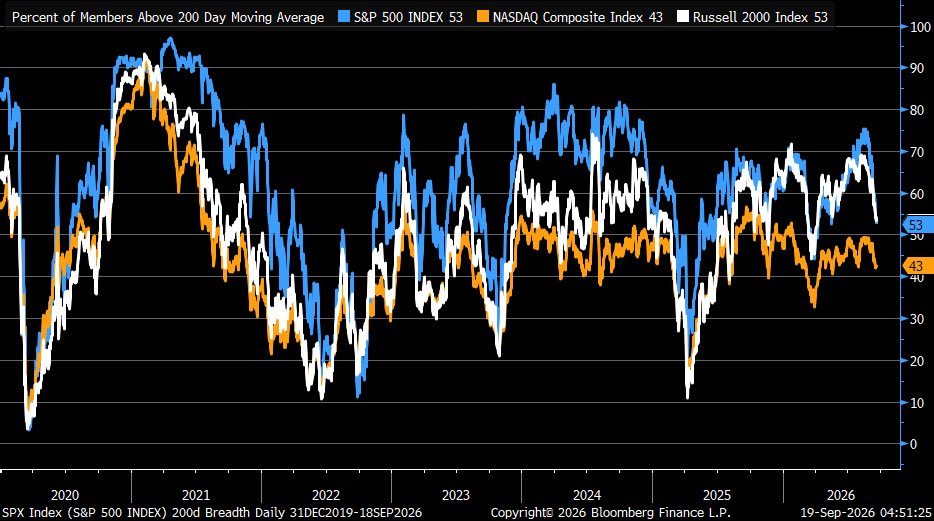
Percentage of index members above their 200-day moving average, since 2020 | S&P 500 and Russell 2000 at 53%, Nasdaq at 43%
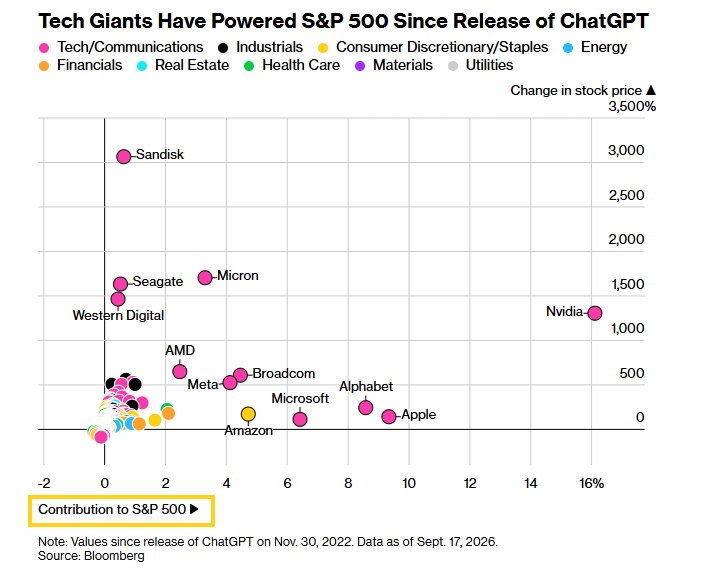
Tech stock price gains vs contribution to the S&P 500 | Nvidia up over 1,300% and about 16% of the gain, Sandisk up nearly 3,000%
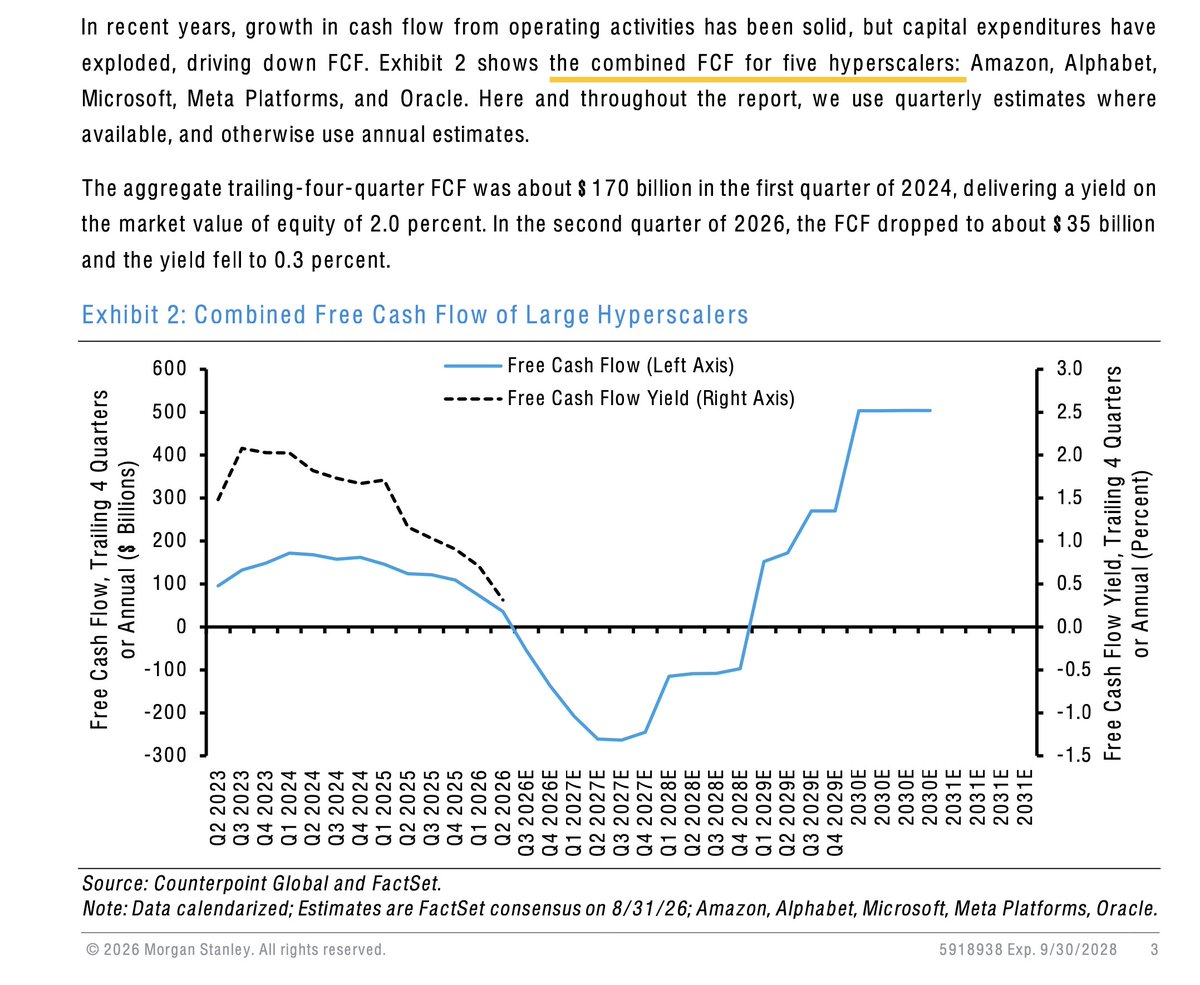
Combined free cash flow of five large hyperscalers and its yield | Down from about $170bn in 2024 to roughly $35bn in Q2 2026
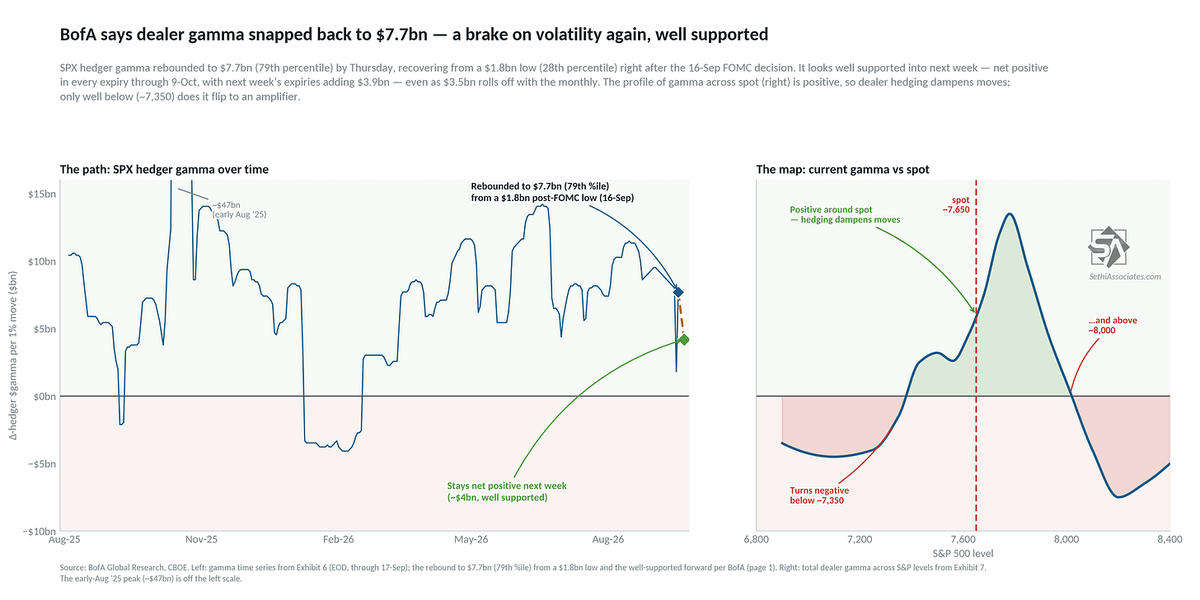
SPX dealer gamma over time and across spot | Rebounded to $7.7bn (79th percentile) from $1.8bn; turns negative only below ~7,350
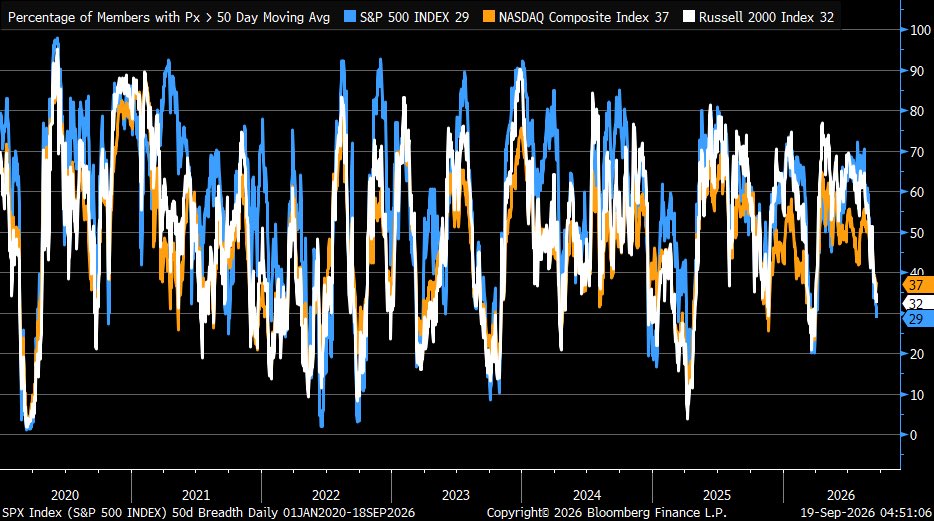
Percentage of index members above their 50-day moving average, since 2020 | S&P 500 at 29%, Nasdaq 37%, Russell 2000 32%
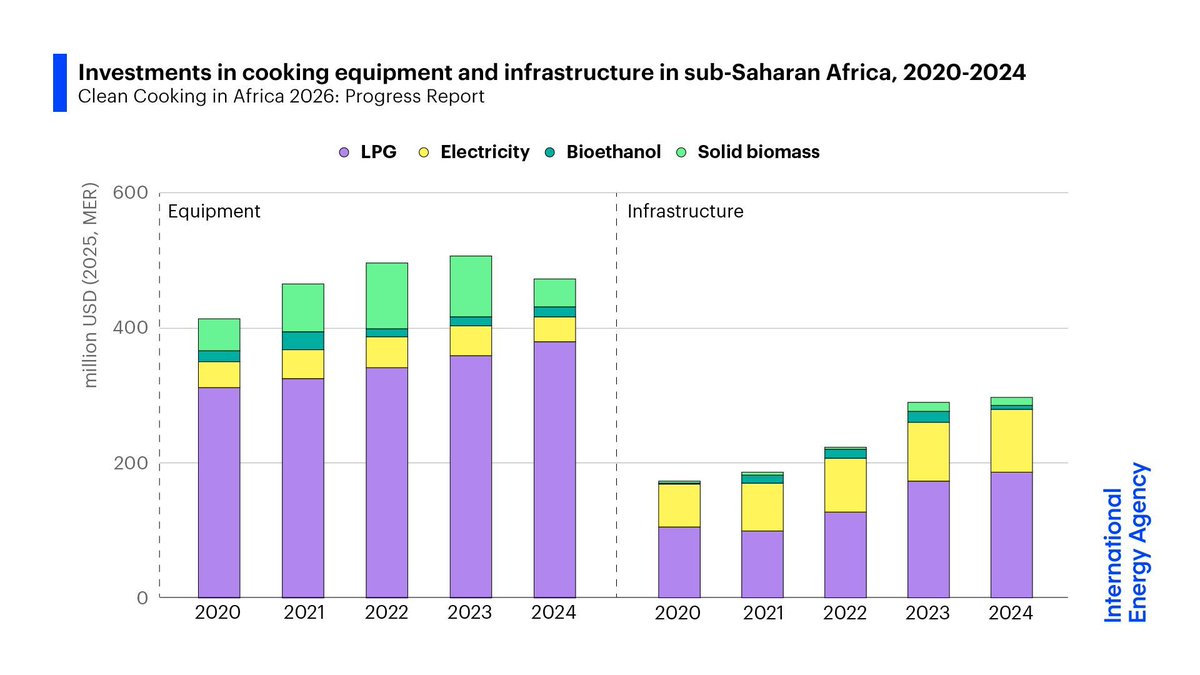
Clean-cooking investment in sub-Saharan Africa by use | Equipment near $470mn in 2024, with LPG the largest share
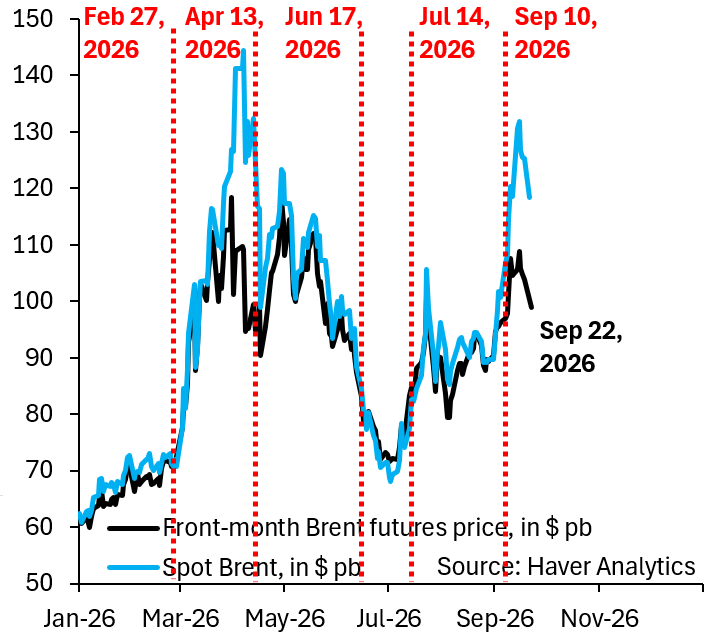
Front-month Brent futures and spot Brent ($/bbl), 2026 | On Sep 22, front-month Brent slipped back below $100 to around $98, though spot stays elevated
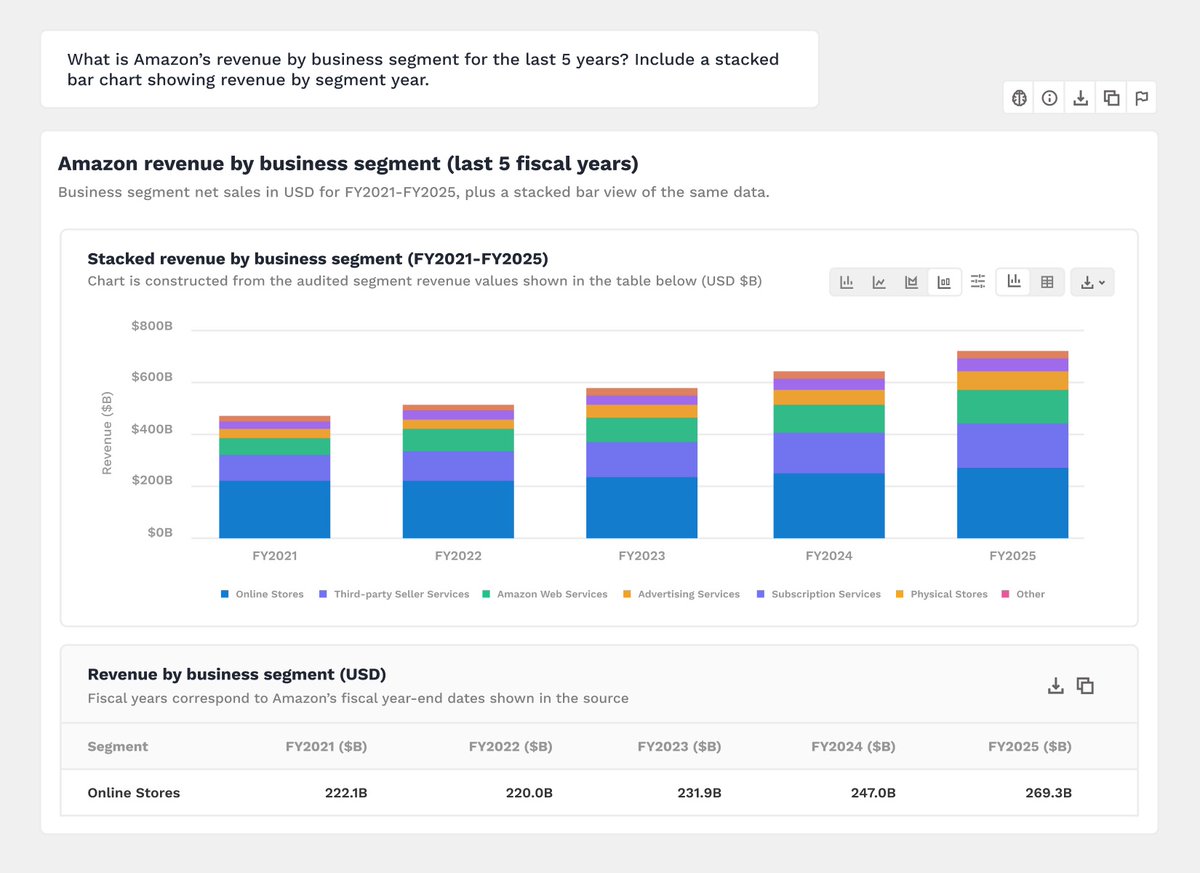
Amazon revenue by segment, stacked, FY2021-FY2025 (USD $B) | FY2025 total about $710B, with Online Stores at $269.3B plus AWS and advertising
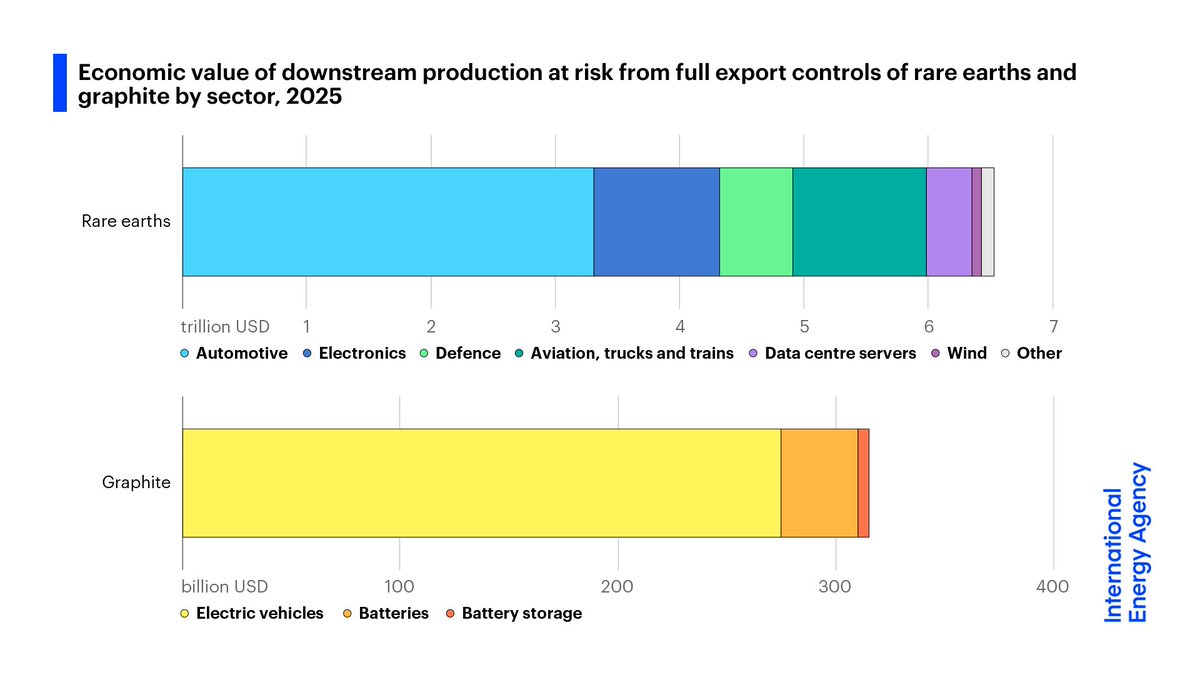
Economic value of downstream production at risk from full export controls of rare earths and graphite, by sector, 2025 | Rare earths underpin over $6.5T, led by automotive, while graphite covers ~$320B
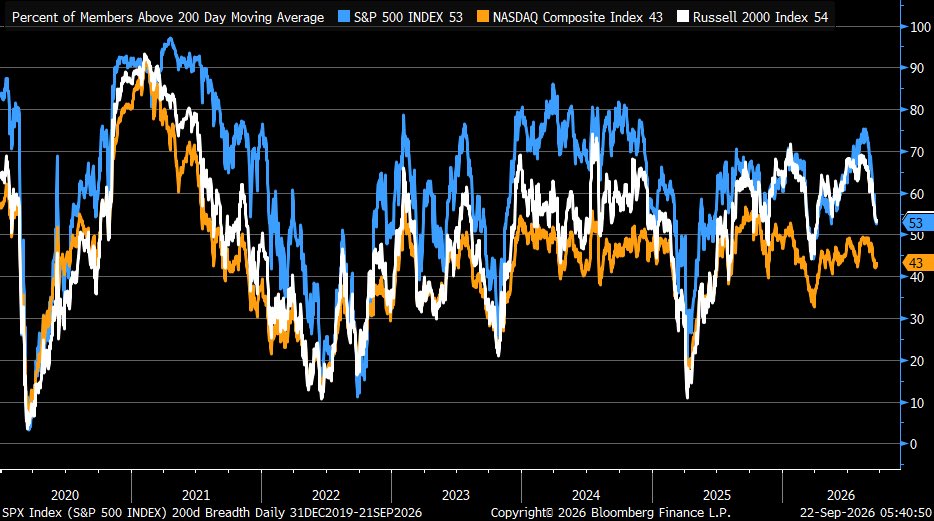
Percent of members above the 200-day moving average, S&P 500 / Nasdaq / Russell 2000 | S&P 500 at 53%, Russell 2000 at 54%, Nasdaq at 43% as breadth weakens
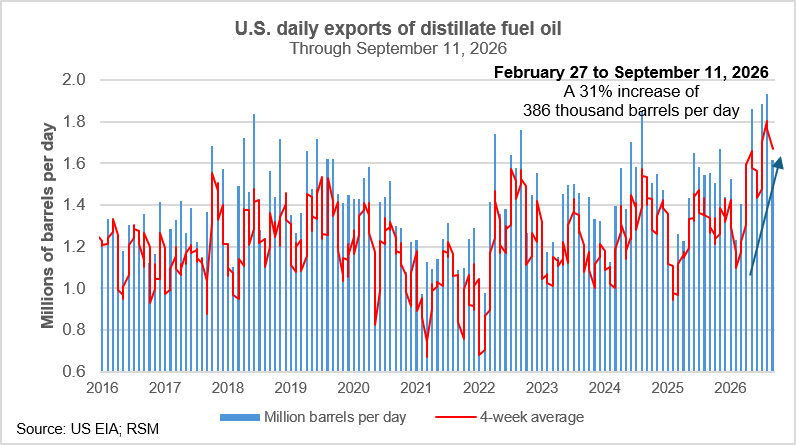
US daily distillate (diesel) fuel exports, 2016-2026 | Up 31% from Feb 27 to Sep 11, 2026, a gain of 386,000 barrels per day
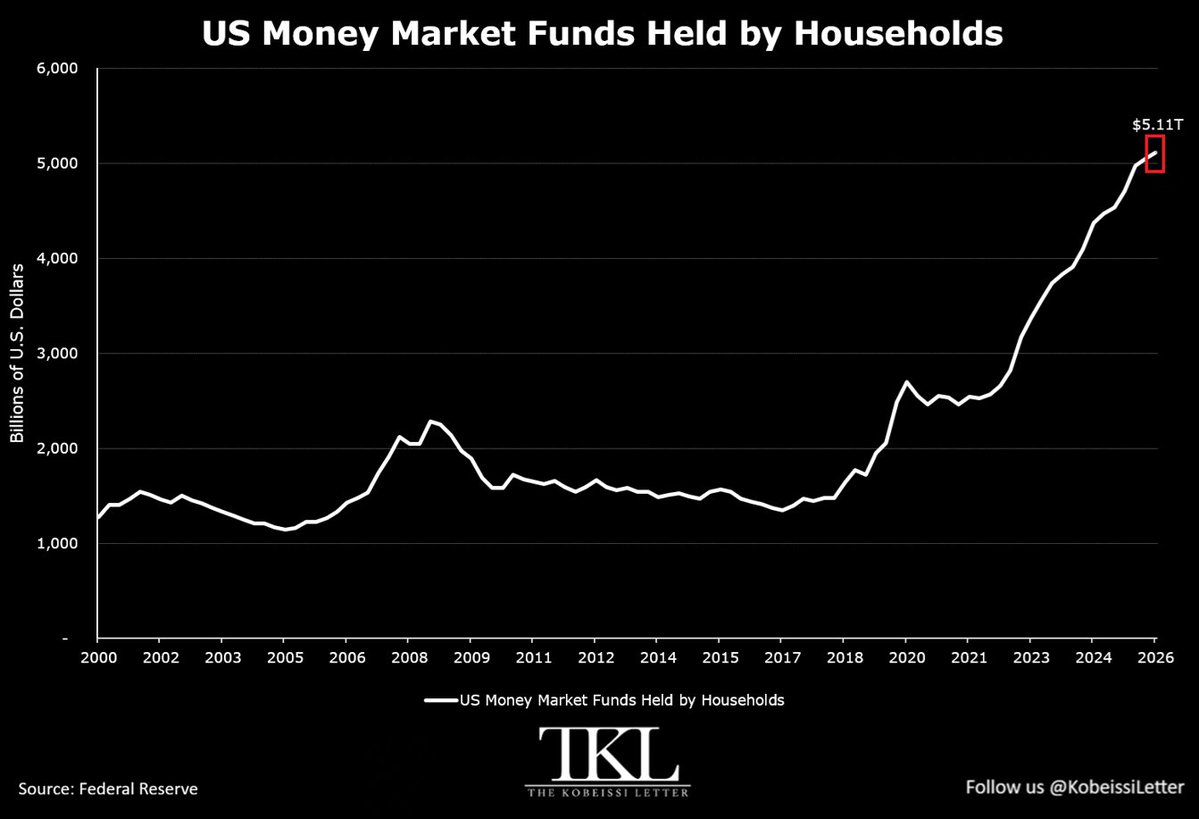
US money market funds held by households, 2000-2026 | Up to a record $5.11 trillion, about 89% above the 2020 pandemic peak
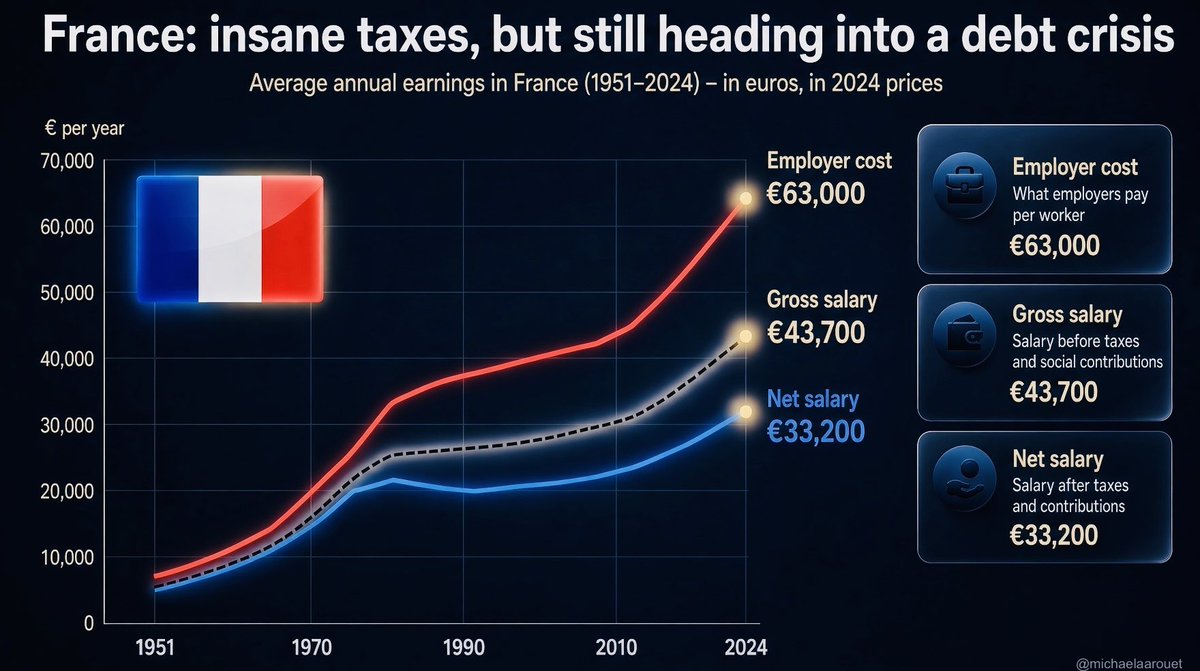
France average annual earnings, 1951-2024 (constant 2024 euros) | 2024: employer cost €63,000, gross salary €43,700, net salary €33,200
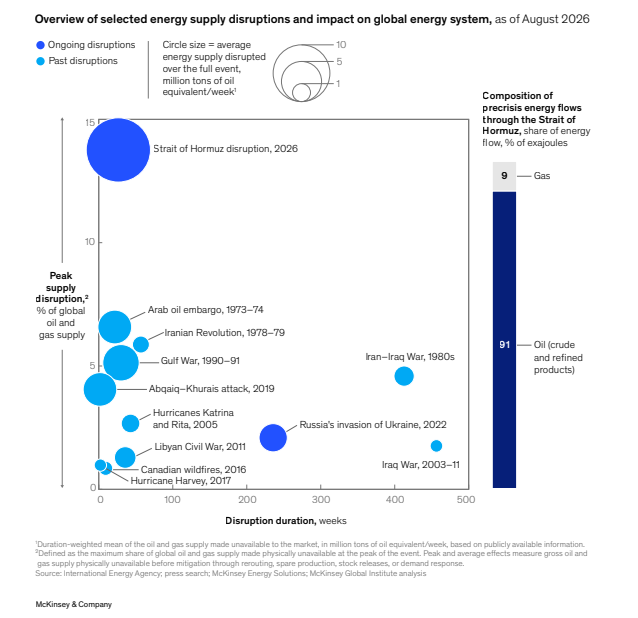
Selected energy supply disruptions by duration and peak impact | The 2026 Strait of Hormuz disruption peaks at ~15% of global oil and gas supply, the largest on the chart
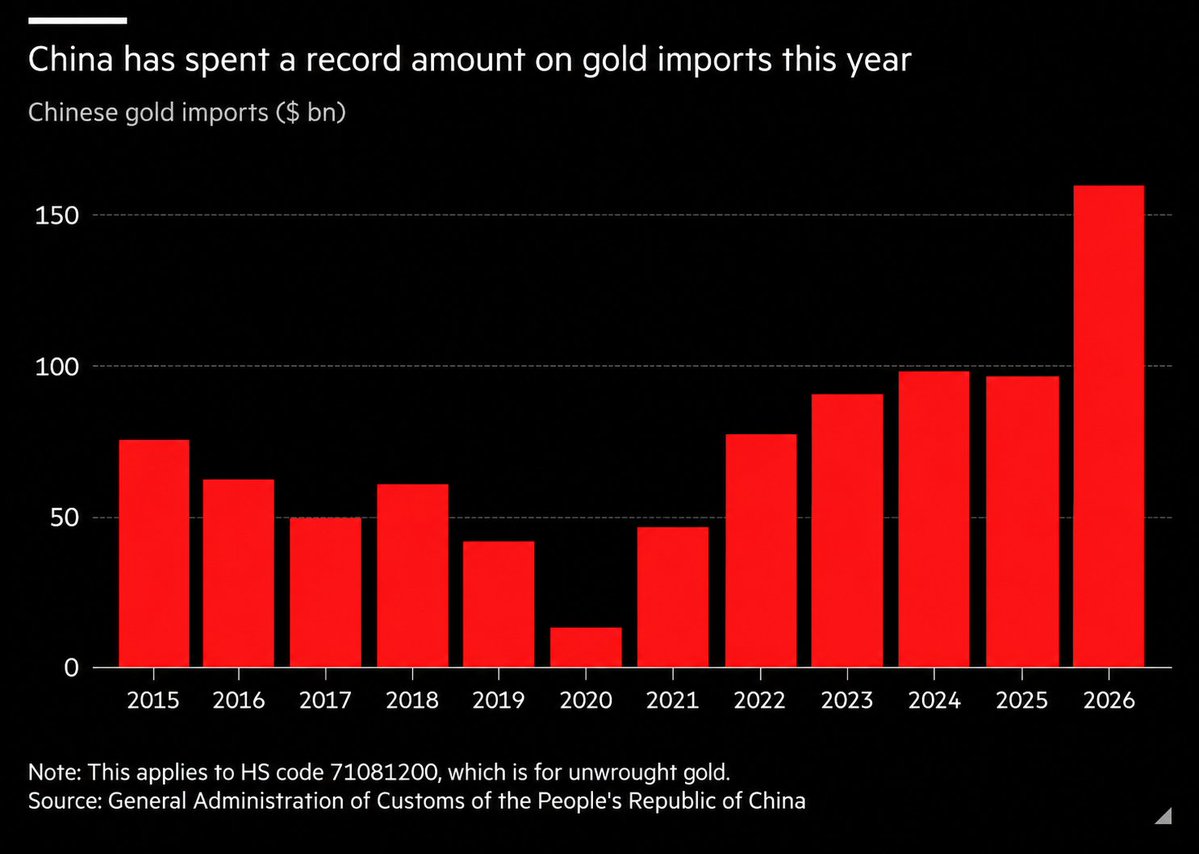
Chinese gold imports (US$bn), 2015-2026 | $158.8bn in the first eight months of 2026, already above the $96.5bn full-year 2025
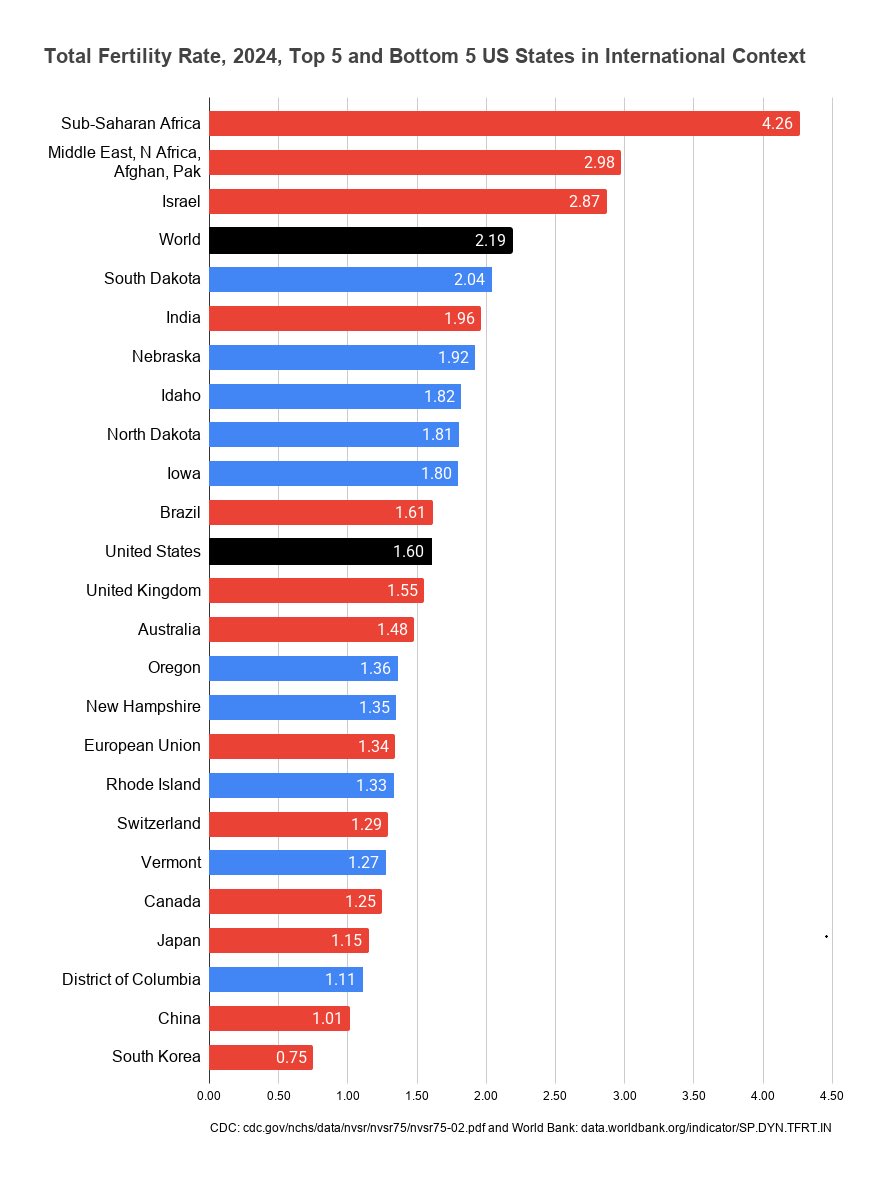
Total fertility rate by country and US state, 2024 (births per woman) | World 2.19, US 1.60, Washington DC 1.11, China 1.01, South Korea lowest at 0.75
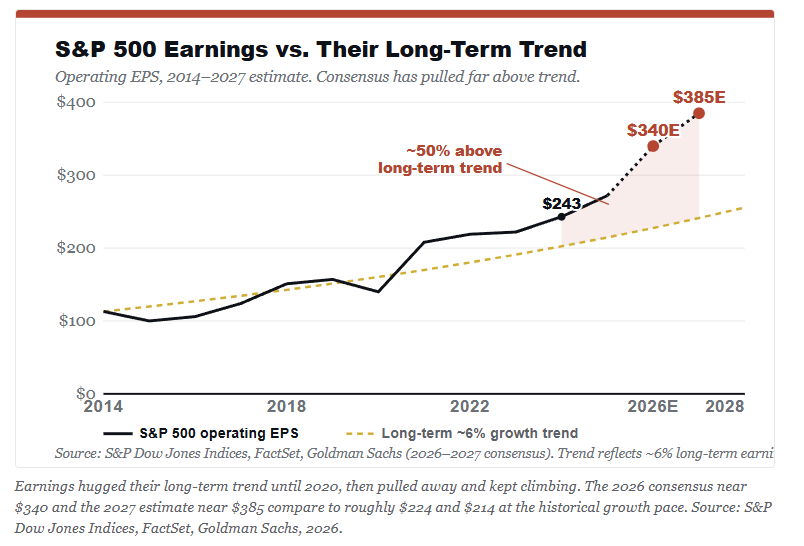
S&P 500 operating EPS versus its long-term ~6% growth trend, 2014-2027E | Consensus of ~$340 in 2026 and ~$385 in 2027 sits about 50% above trend
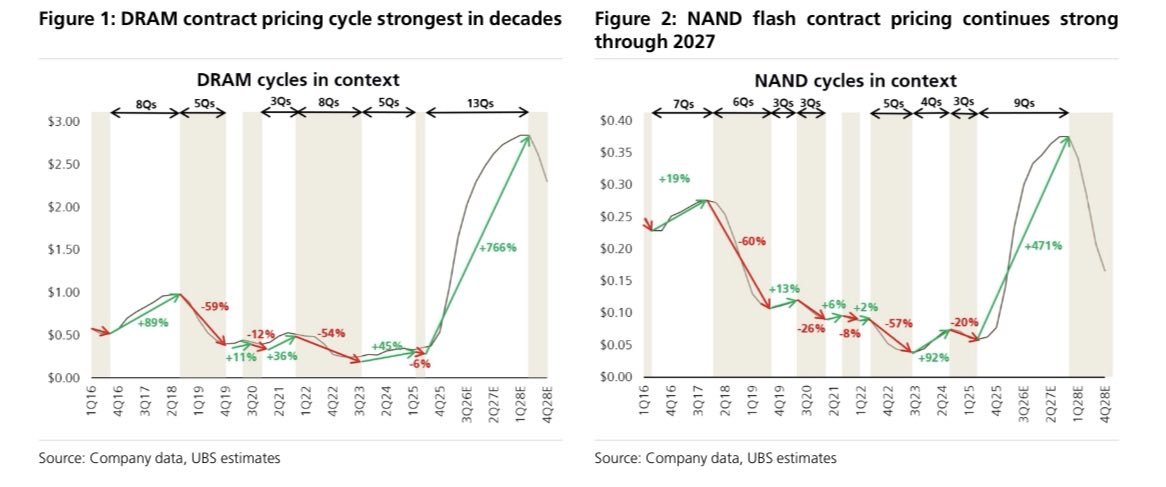
DRAM and NAND contract-price cycles, UBS | Current cycle +766% for DRAM over 13 quarters and +471% for NAND over 9 quarters
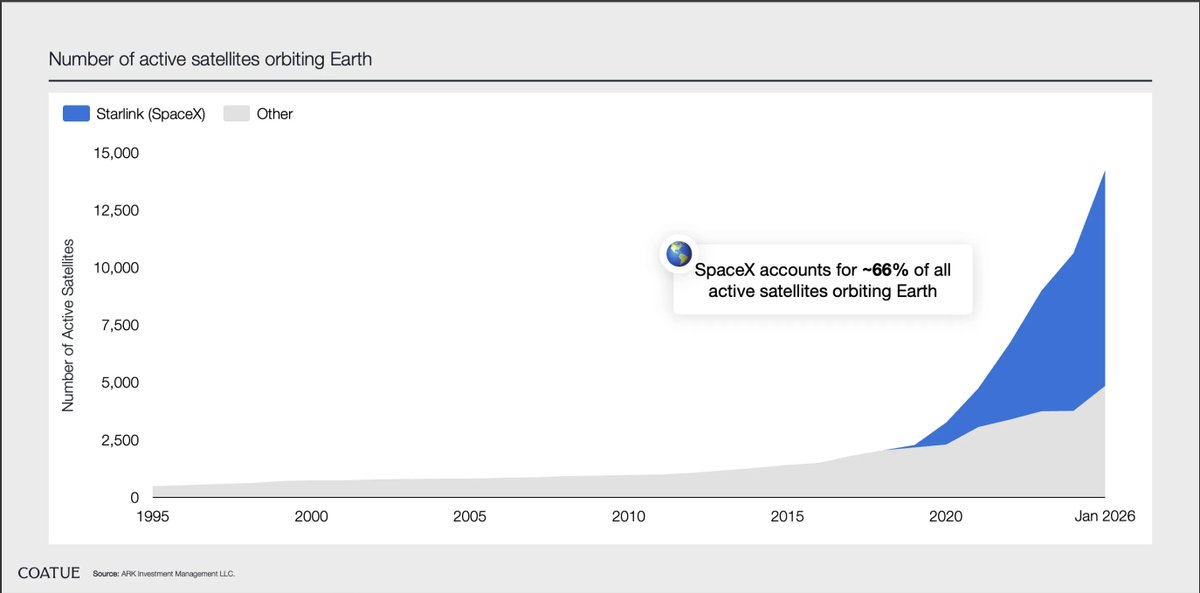
Number of active satellites orbiting Earth, 1995 to early 2026 | The total exceeds 14,000, with SpaceX's Starlink making up about 66%
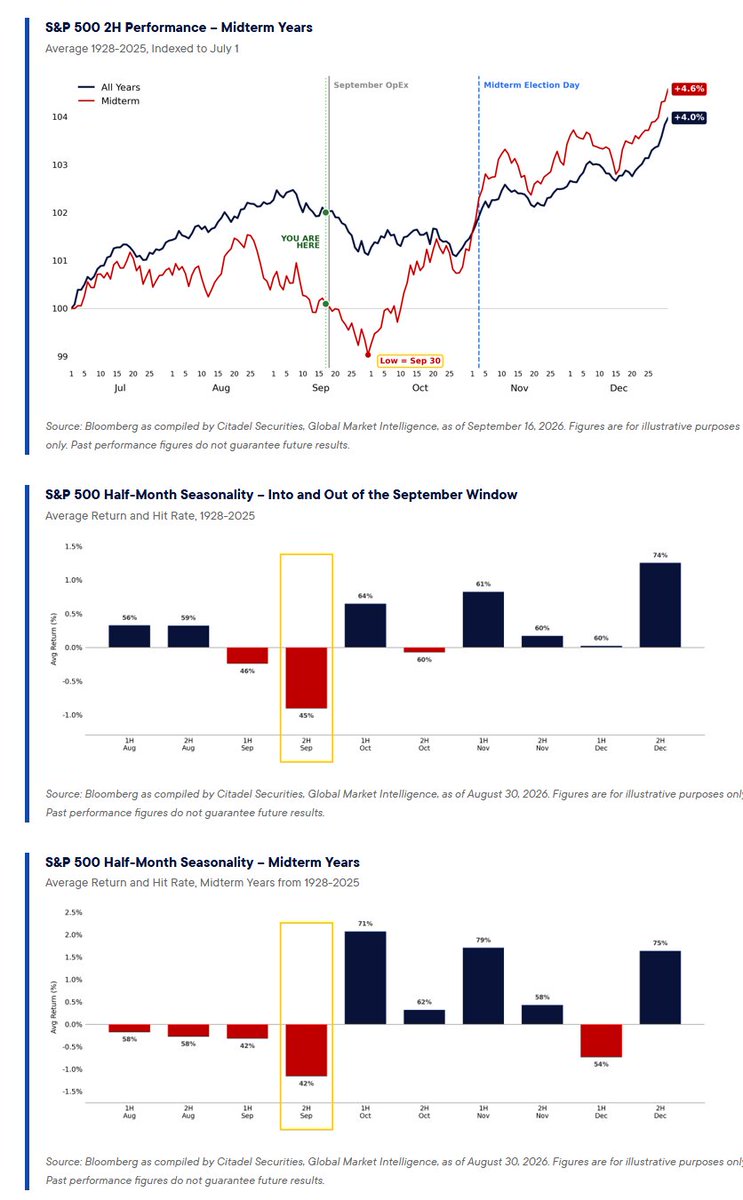
S&P 500 second-half seasonality in midterm years (1928-2025, indexed to July 1) | Average path troughs on Sep 30, then rises to +4.6% by year-end vs +4.0% for all years
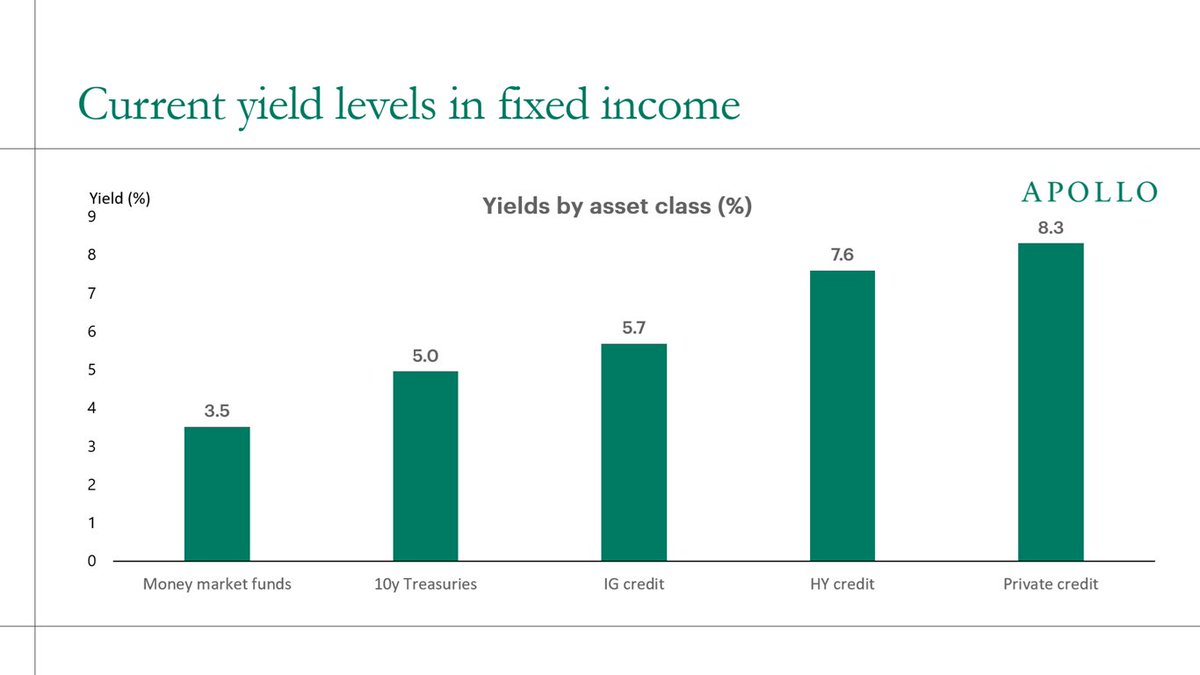
Current yields by fixed-income asset class | Private credit yields 8.3%, versus 5.0% for 10y Treasuries and 3.5% for money-market funds
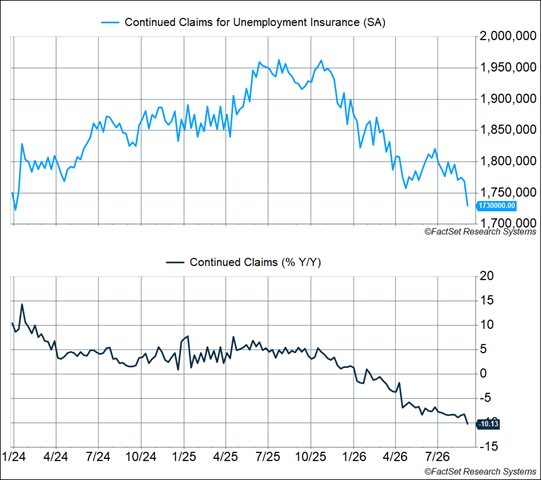
US continuing unemployment claims (SA) and its YoY change, 2024-2026 | The latest ~1.73M is the lowest since January 2024, down 10.13% year-on-year
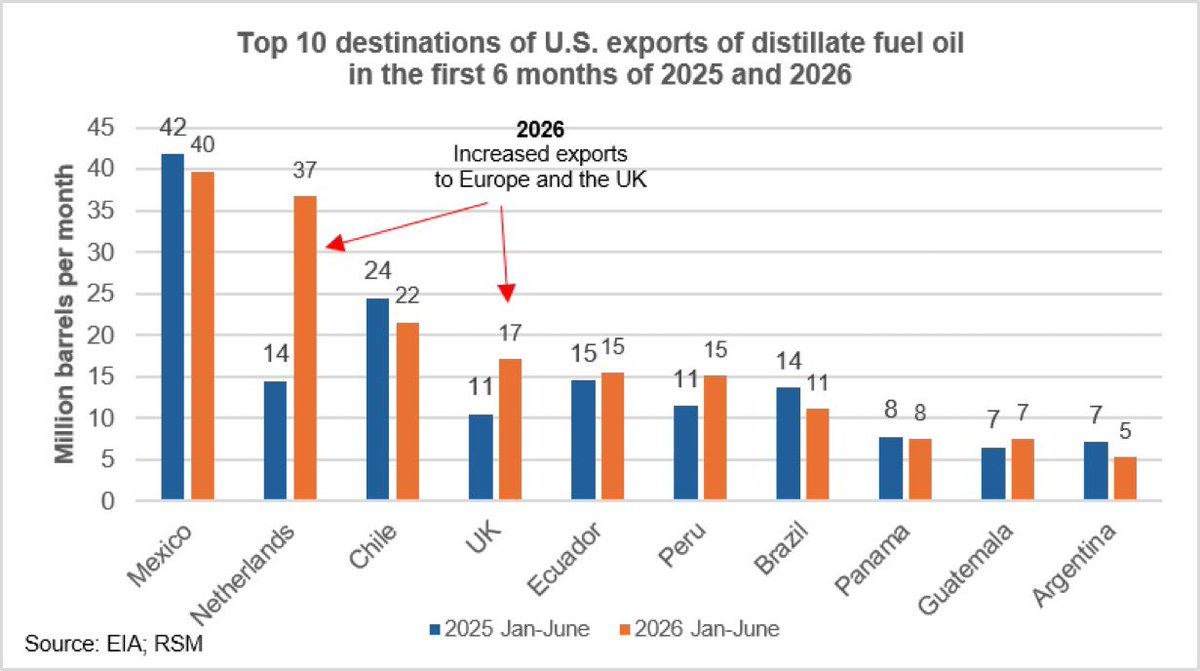
Top 10 destinations of US distillate fuel oil exports, first half of 2025 vs 2026 (million barrels/month) | Exports to the Netherlands jump from 14M to 37M, while Mexico stays No.1
Yields by fixed-income asset class (%) | Private credit 8.3%, high yield 7.6%, IG credit 5.7%, 10Y Treasuries 5.0%, money-market funds 3.5%
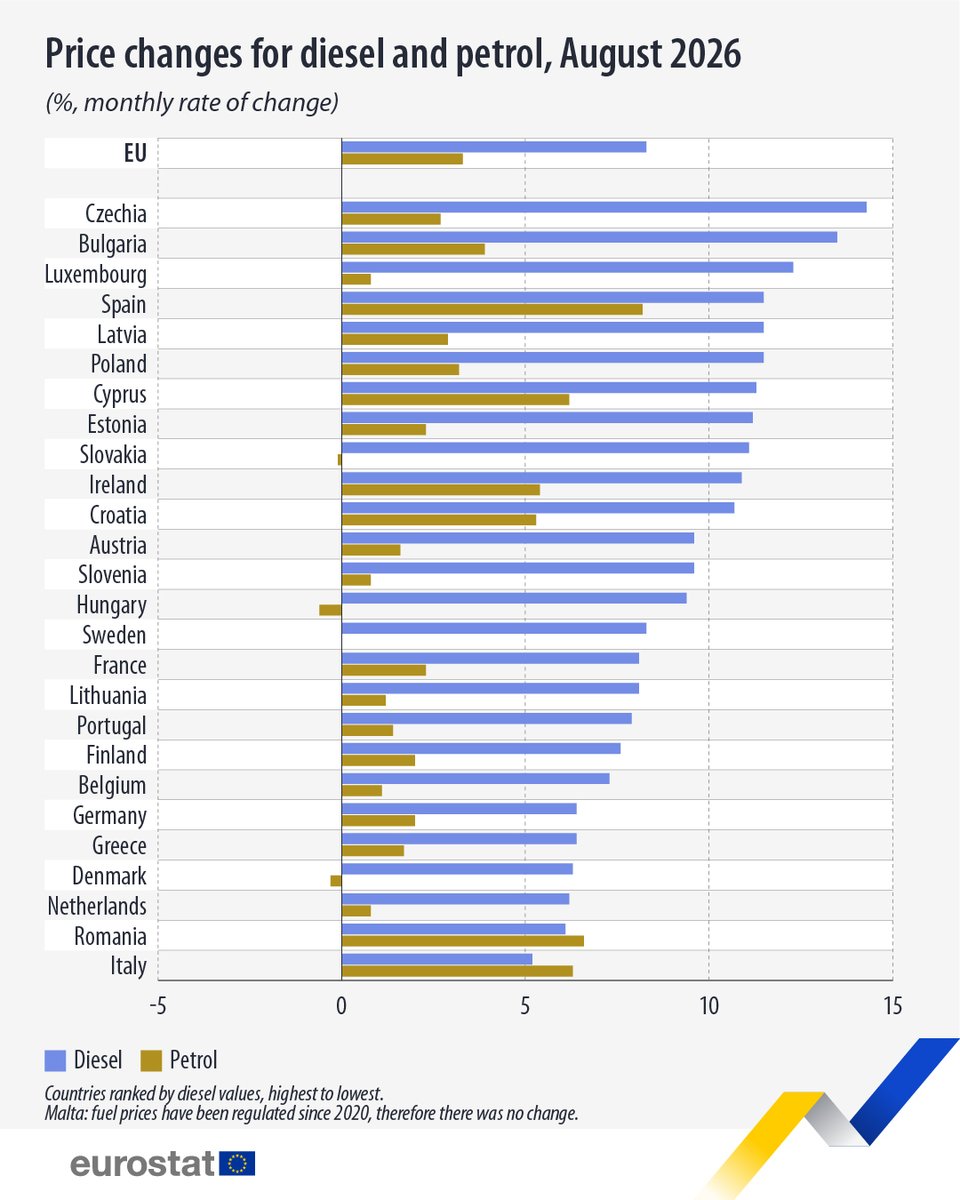
Monthly price change for diesel and petrol by EU country, August 2026 (%) | EU diesel +8.3% and petrol +3.3%, Czechia diesel +14.3% the largest
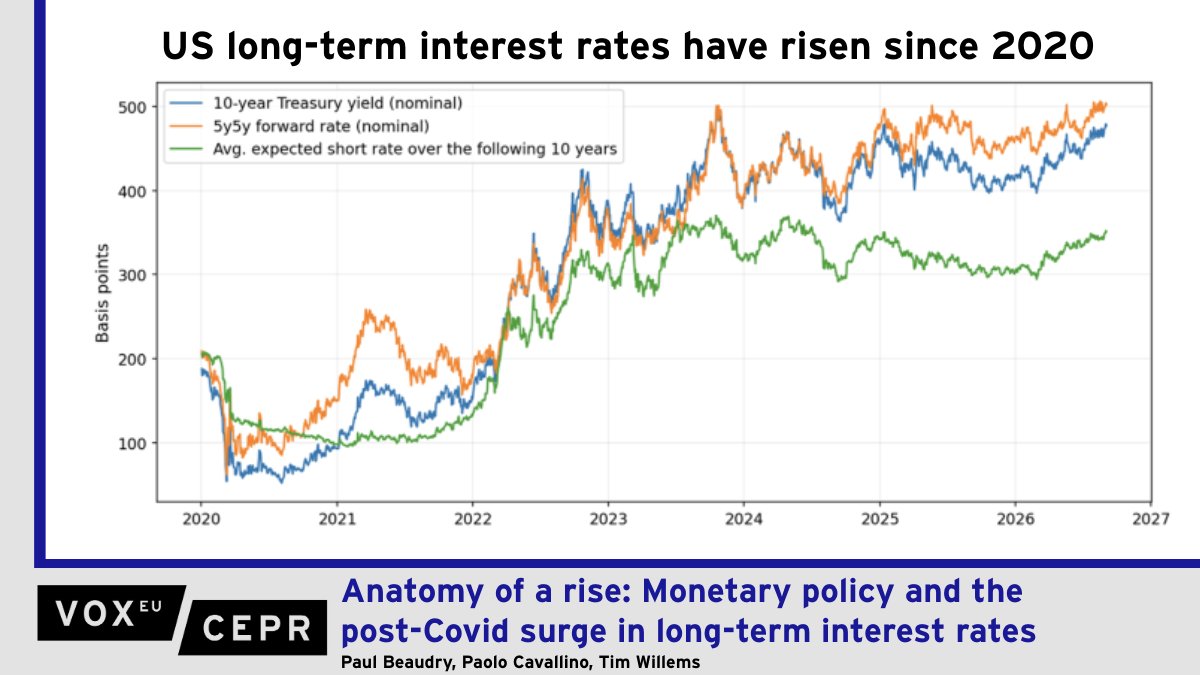
US 10-year Treasury yield, 5y5y forward rate, and average expected short rate over 10 years (bp) | The 10-year yield rose from ~60bp in 2020 to ~475bp, with expected short rates up to ~350bp
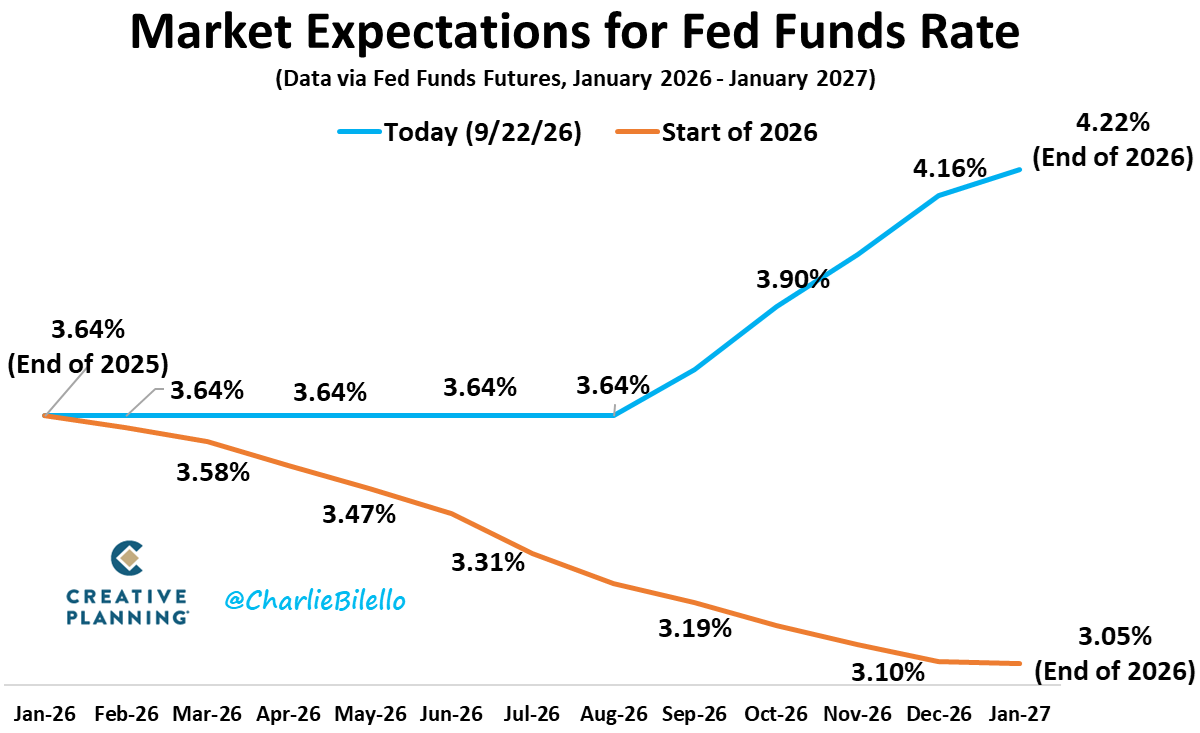
Market-implied fed funds rate, Fed Funds futures (Jan-2026 to Jan-2027) | End-2026 now seen at 4.22% vs 3.05% at the start of the year, a swing from cuts to hikes
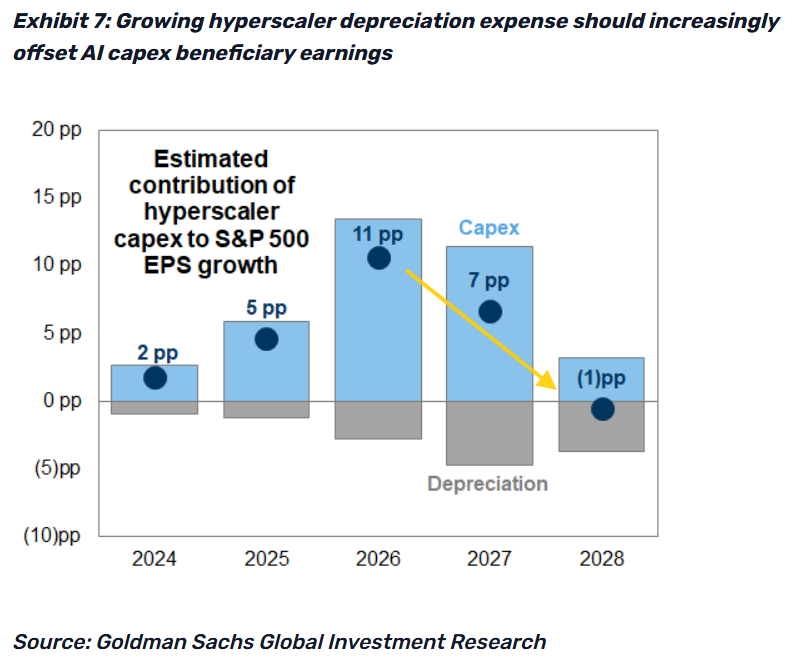
Estimated contribution of hyperscaler capex to S&P 500 EPS growth | Peaks at ~+11pp in 2026, then fades to ~-1pp by 2028 as depreciation rises
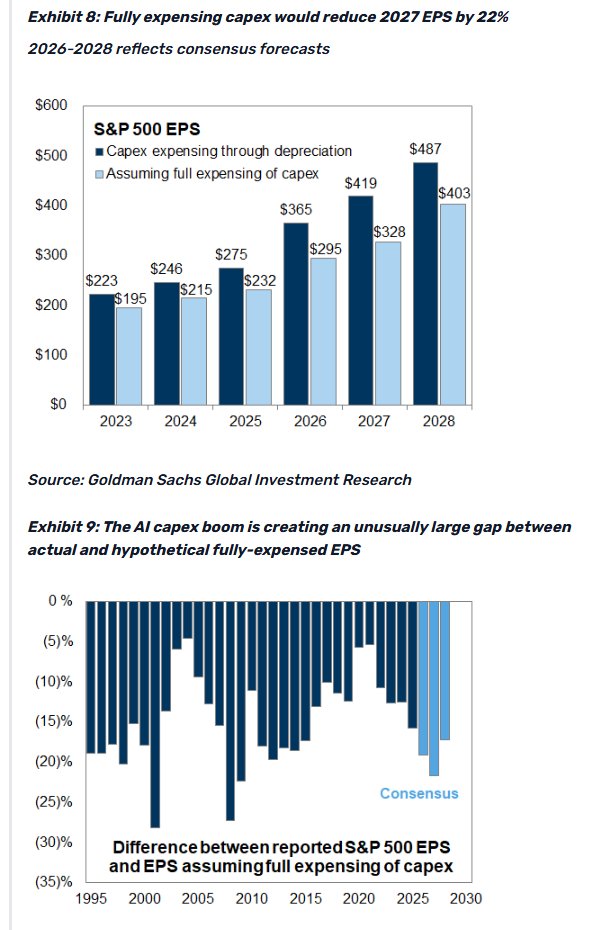
S&P 500 EPS, capex through depreciation vs full expensing (2023-2028) | 2027 EPS $419 vs $328 (22% lower), the widest gap in decades amid the AI capex boom
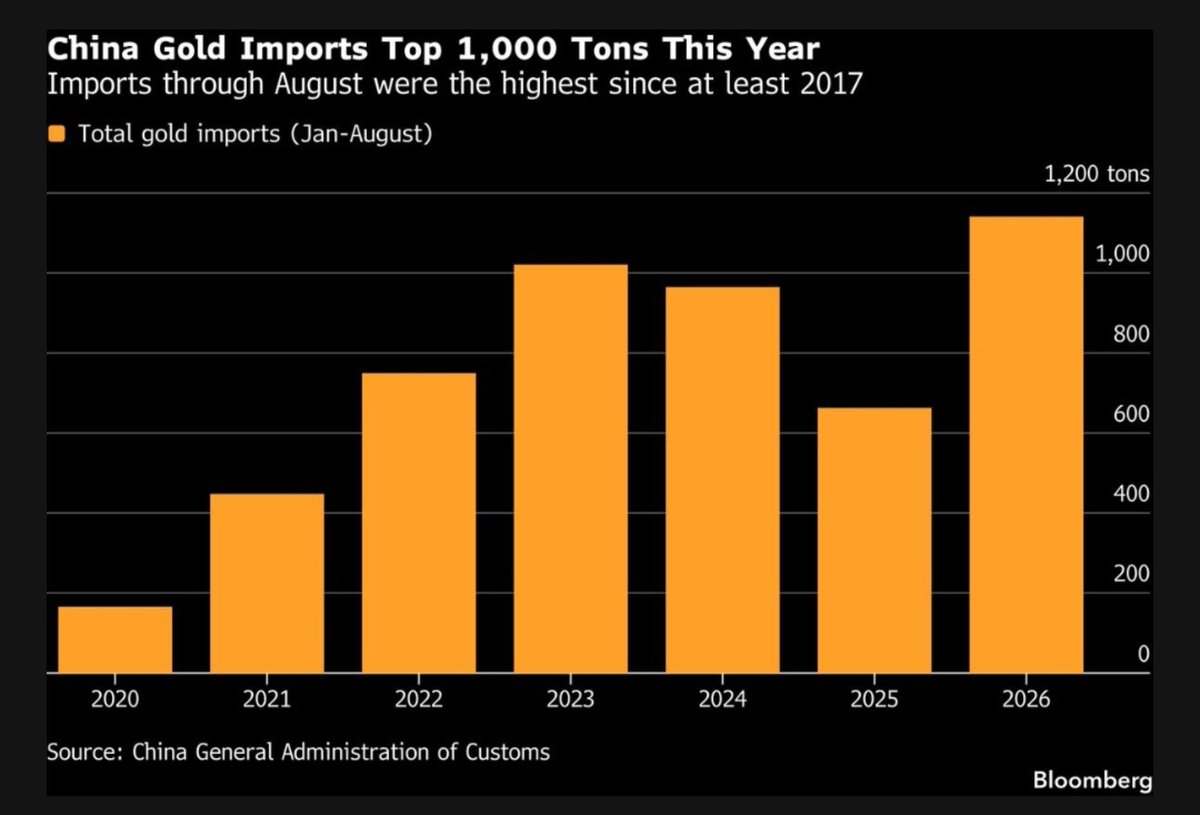
China gold imports, Jan-Aug by year (tons) | 2026 ran above 1,000 tons through August, the highest for the period since at least 2017
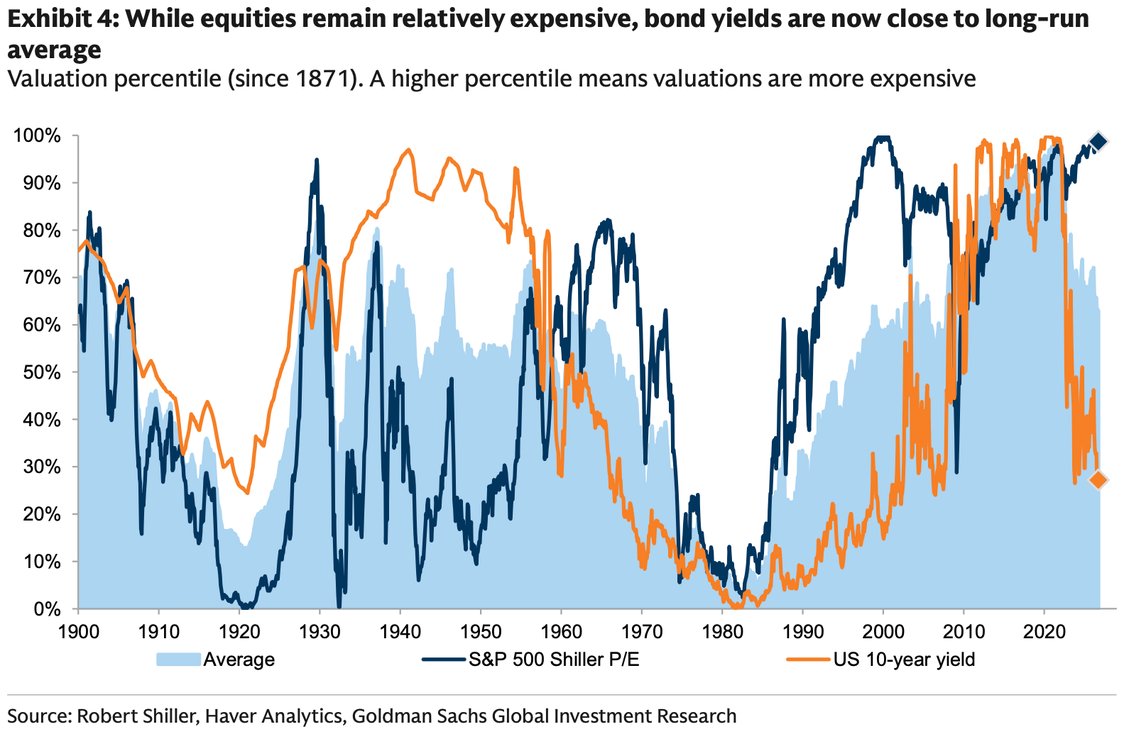
Valuation percentiles since 1871 for the S&P 500 Shiller P/E and the US 10-year yield | Equity valuations are near the 99th percentile while bond yields sit around the 27th, close to their long-run average
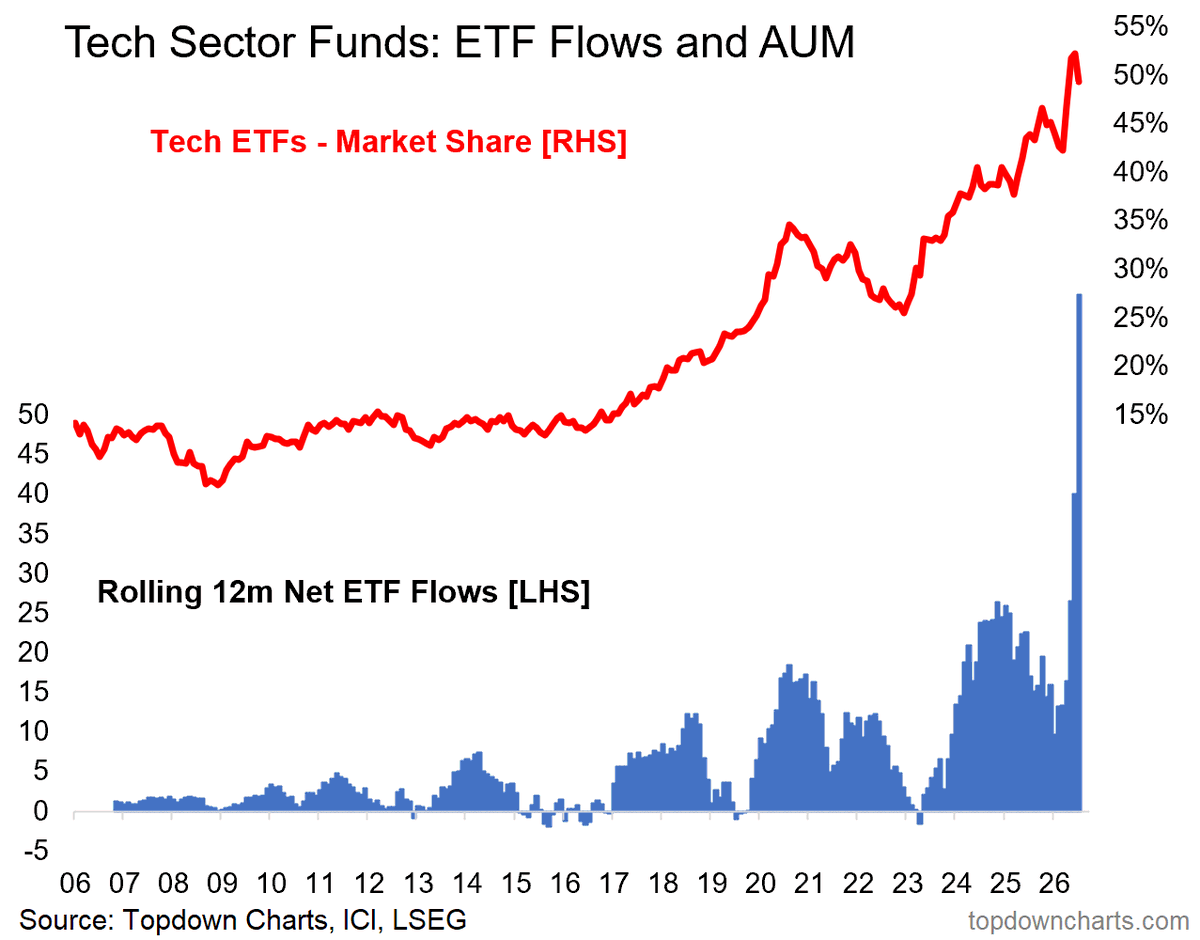
Tech ETF market share (RHS) and rolling 12m net flows (LHS), 2006-2026 | Market share near 50%, an all-time high, as rolling inflows hit a record
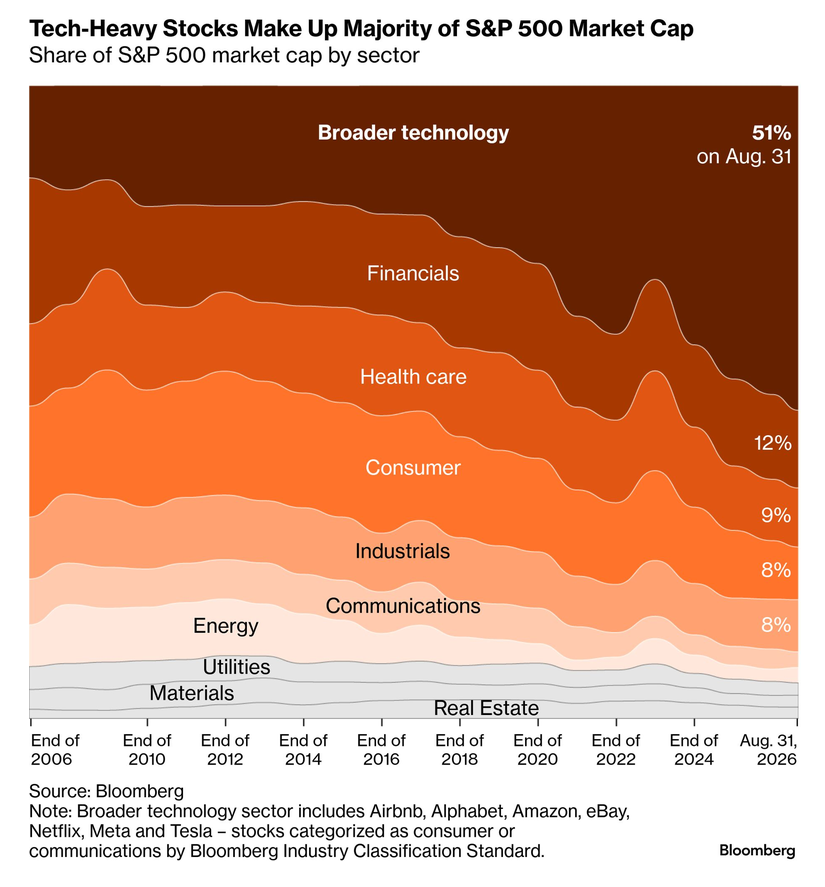
Share of S&P 500 market cap by sector (stacked, since 2006) | Broader technology at 51% on Aug 31, 2026, an all-time high, with financials 12% and health care 9%
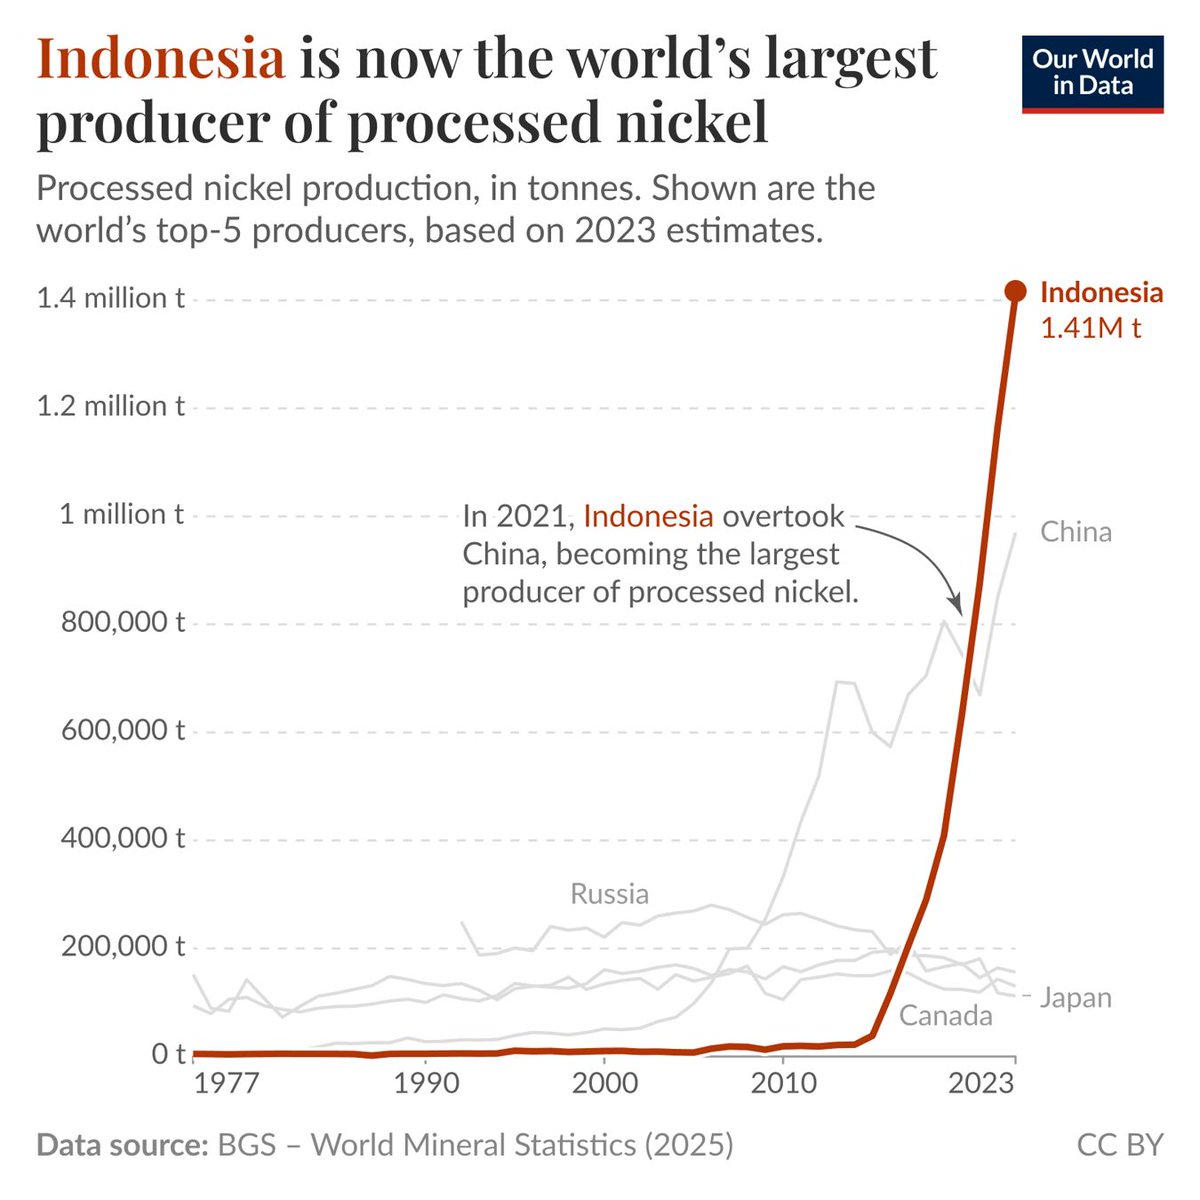
Processed nickel production, top-5 producers, tonnes, 1977-2023 | Indonesia at 1.41M t in 2023, having overtaken China in 2021
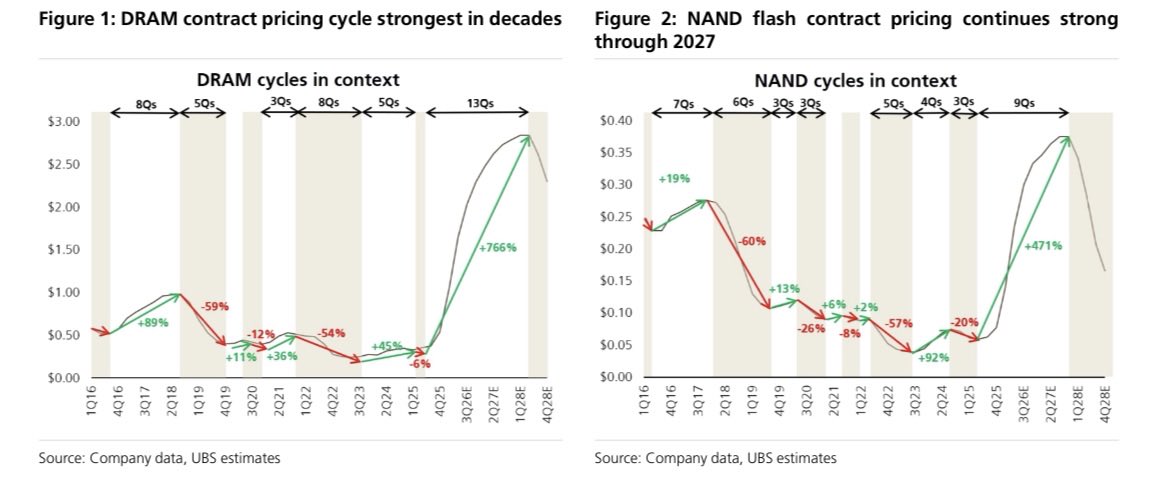
DRAM and NAND contract pricing cycles (UBS) | DRAM +766% over 13 quarters and NAND +471% over 9 quarters, with gains projected into end-2027
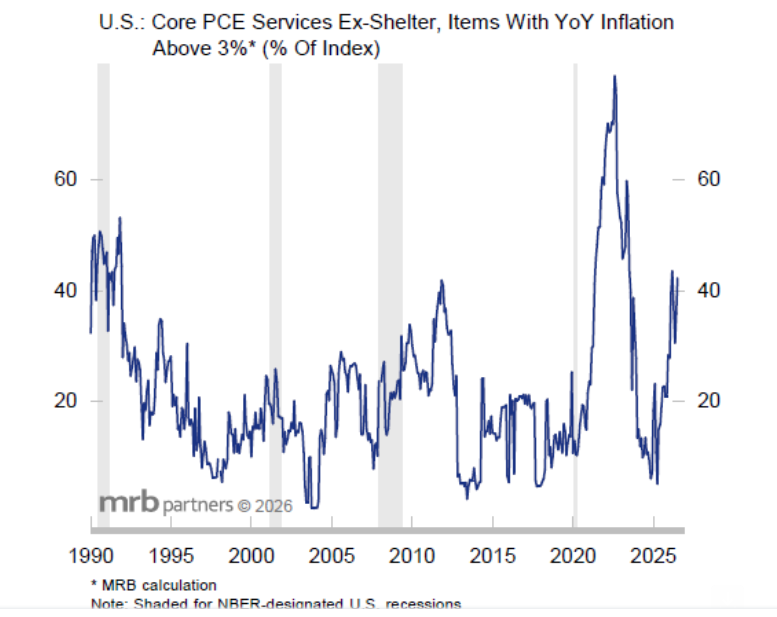
US core PCE services ex-shelter, share of items with YoY inflation above 3% (since 1990) | Latest back to about 40%, well above the mid-2010s lows
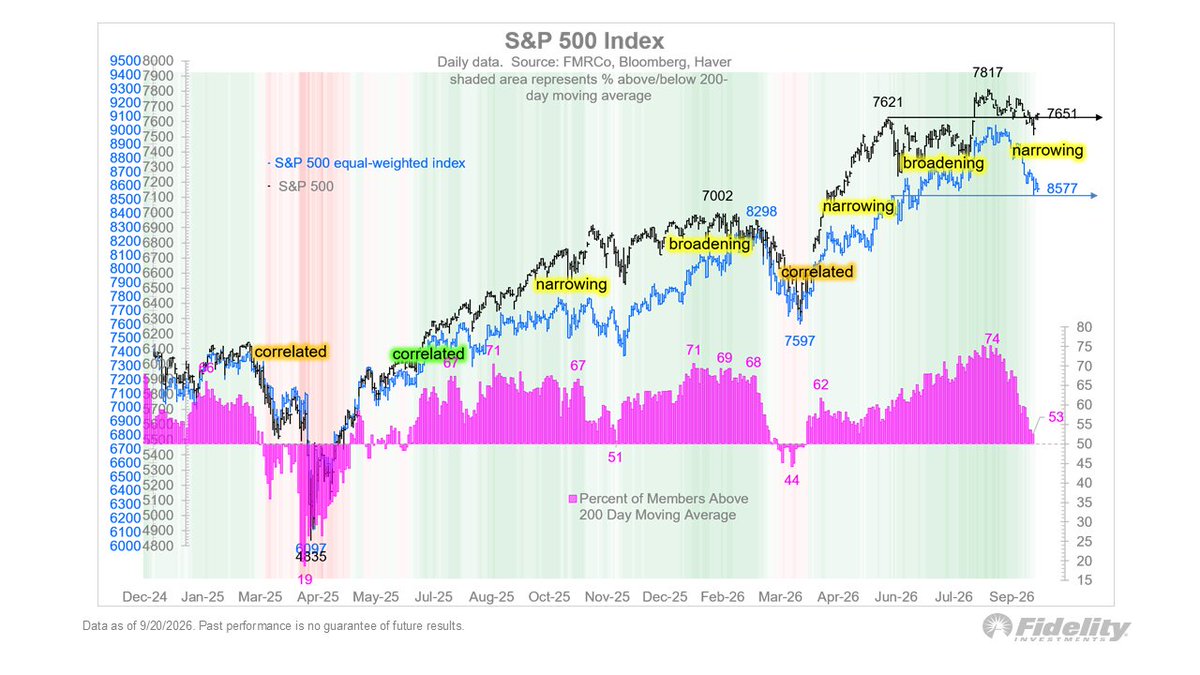
S&P 500 vs equal-weighted index with 200-day breadth, 2024-2026 | Index at 7,651, equal-weight 8,577, and members above the 200-day average down from 74% to 53%
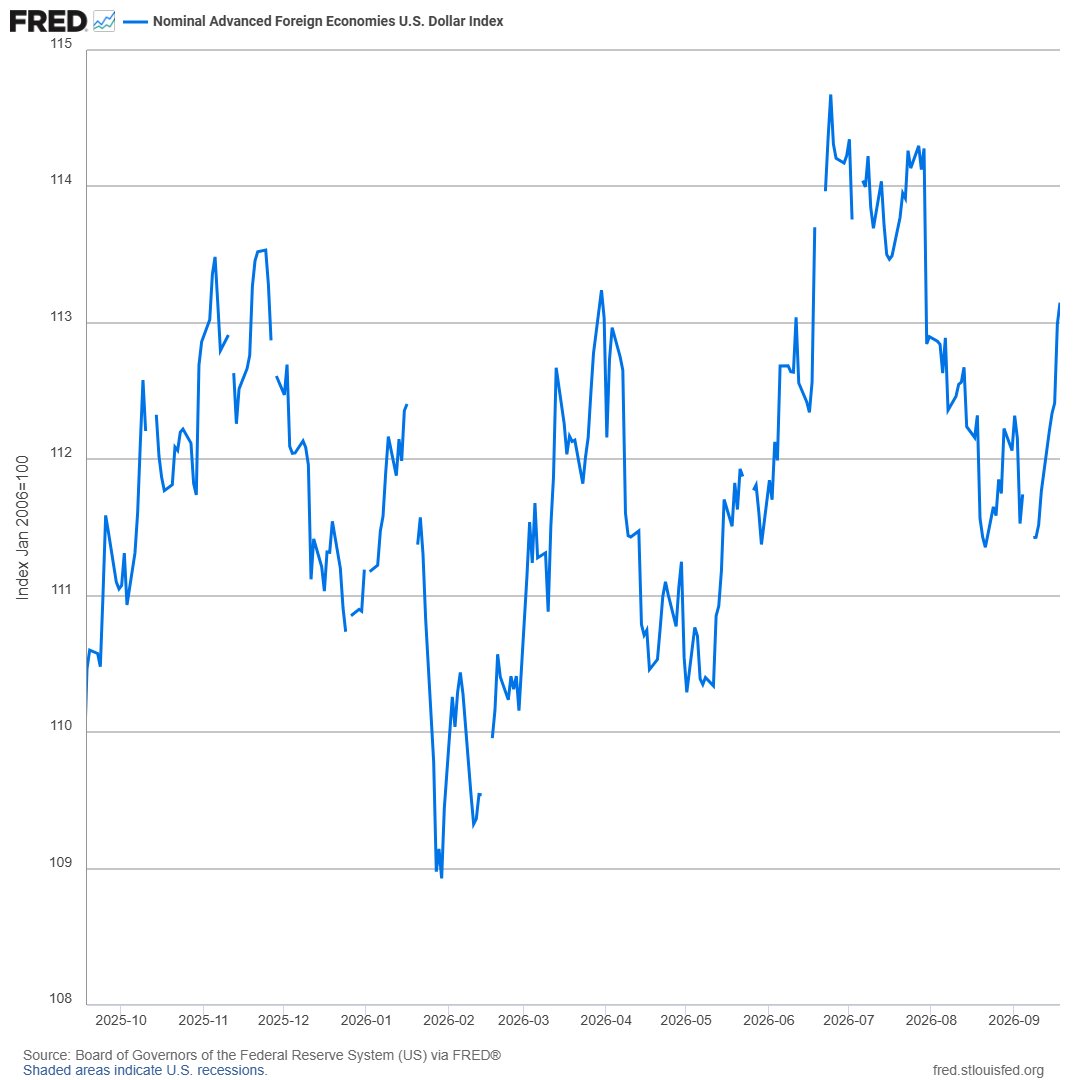
Nominal advanced foreign economies U.S. dollar index (Jan 2006=100) | Up to 113.1 on Sept 18, rebounding from the early-September dip
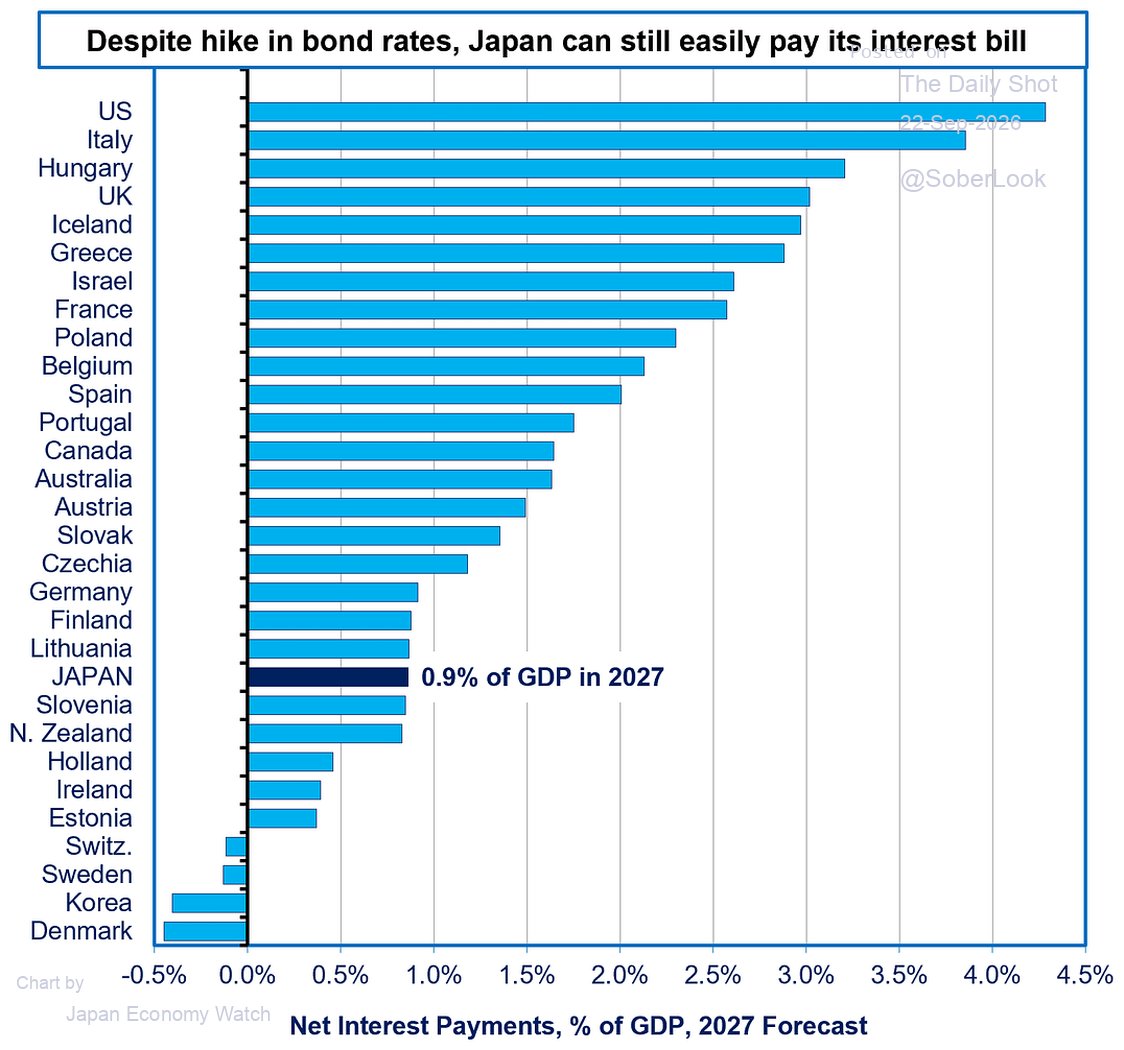
Net interest payments as % of GDP, 2027 forecast | Japan at 0.9%, near the OECD low, vs the US around 4.3% and Italy 3.8%
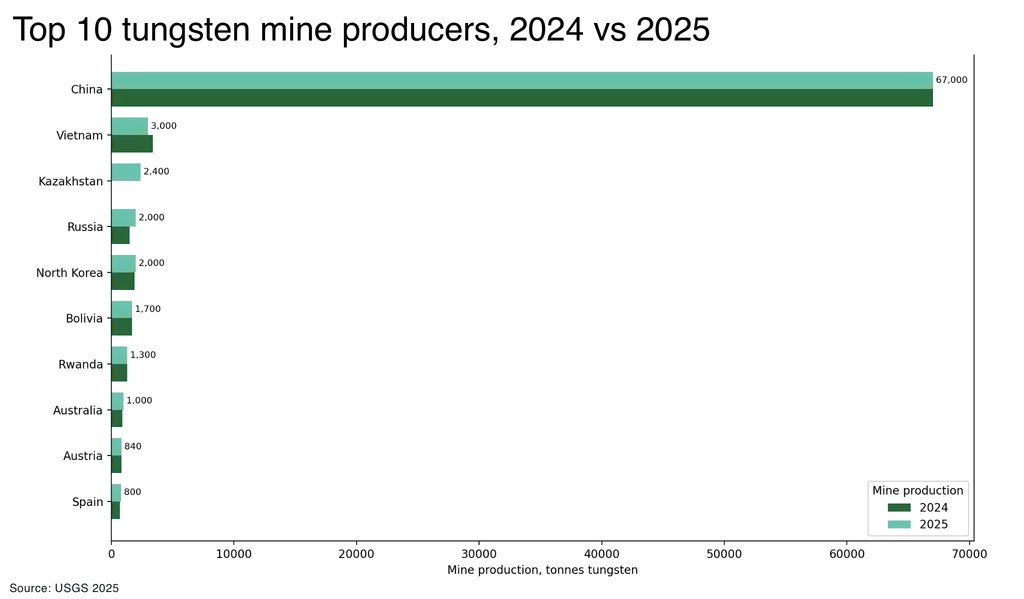
Top 10 tungsten mine producers, 2024 vs 2025 | China at 67,000 tonnes dwarfs No.2 Vietnam's 3,000 tonnes
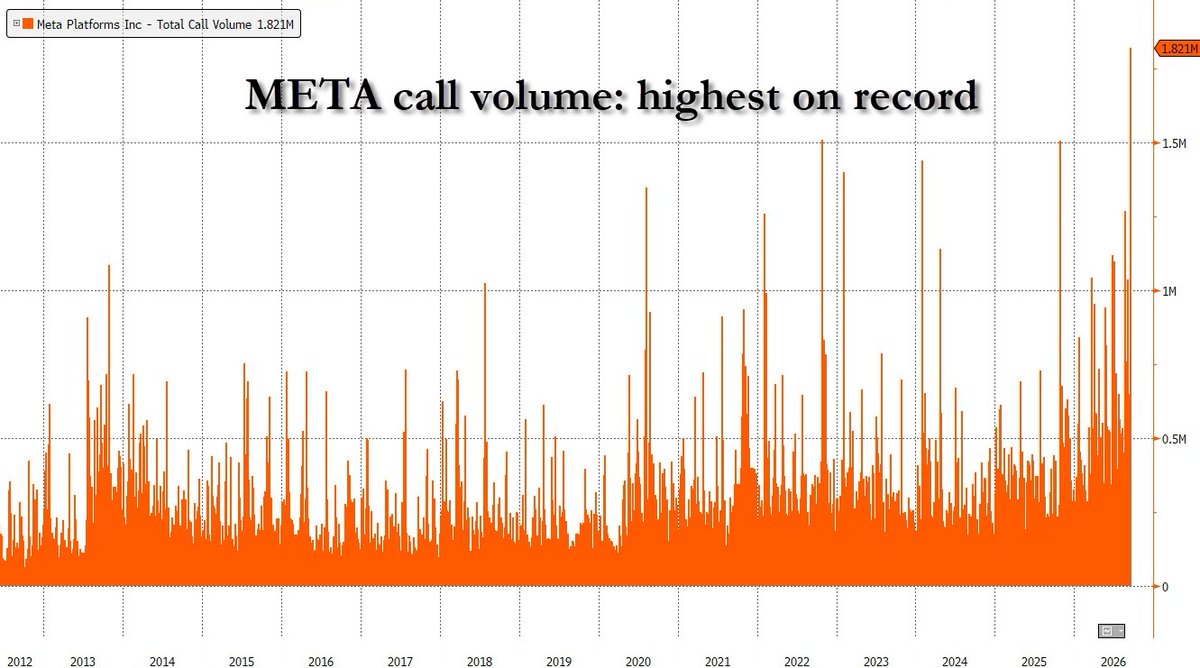
Meta total call option volume, 2012-2026 (contracts) | Latest single-day reading 1.821M, the highest on record
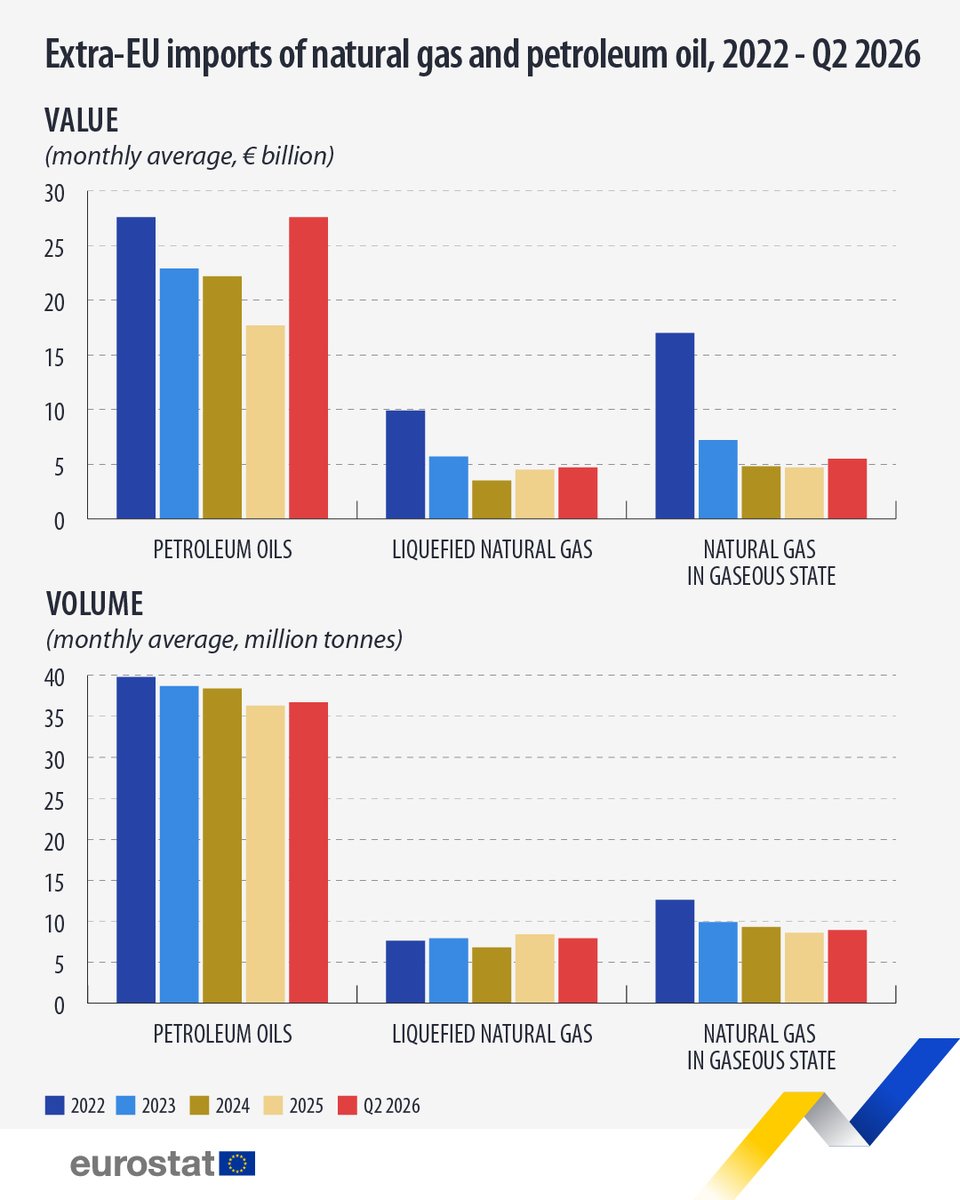
Extra-EU imports of energy by value and volume, 2022 to Q2 2026 | Petroleum oil import value rebounds to ~€28B/month, near 2022 levels, while volume is roughly flat
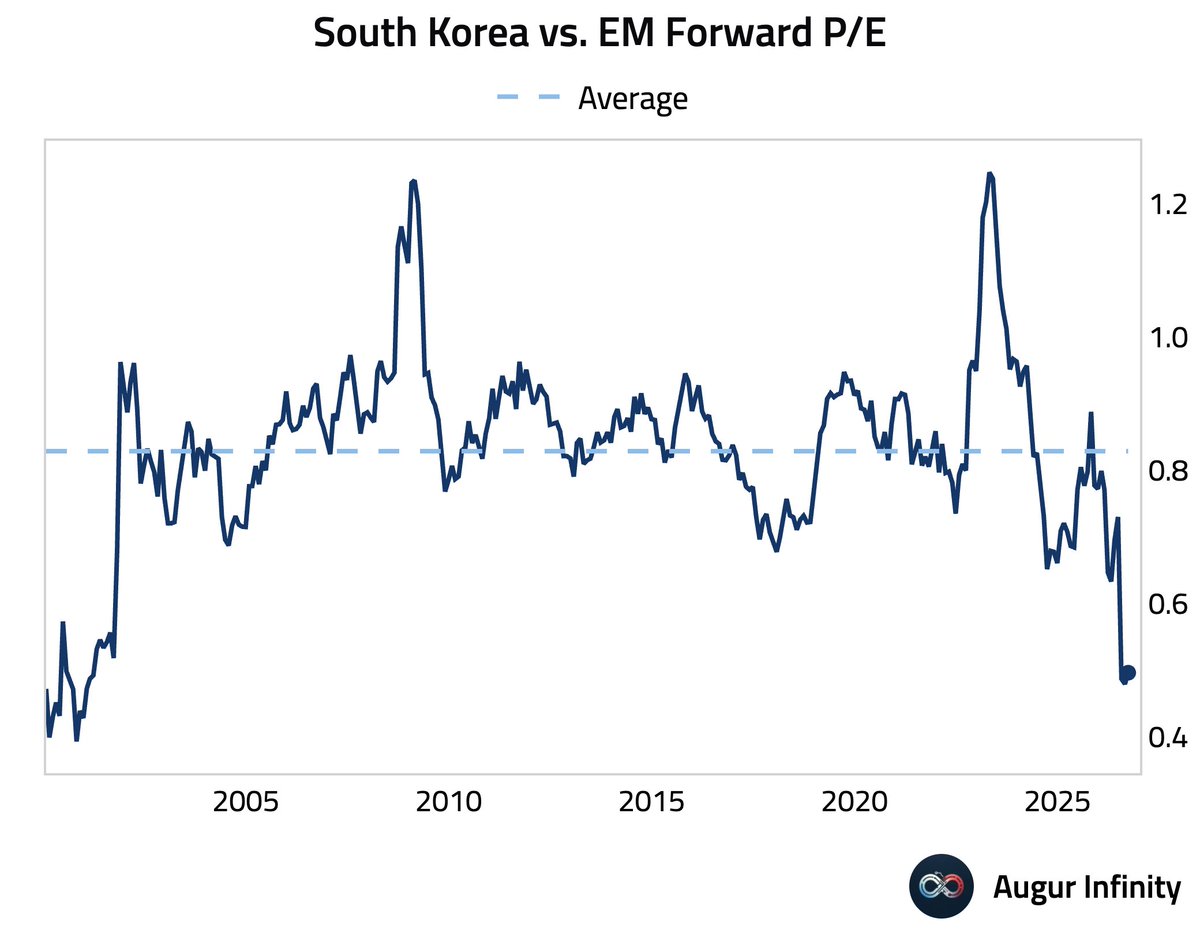
South Korea forward P/E relative to emerging markets (since 2001, with average) | Latest about 0.5x versus a long-run average near 0.83, the deepest discount since 2001
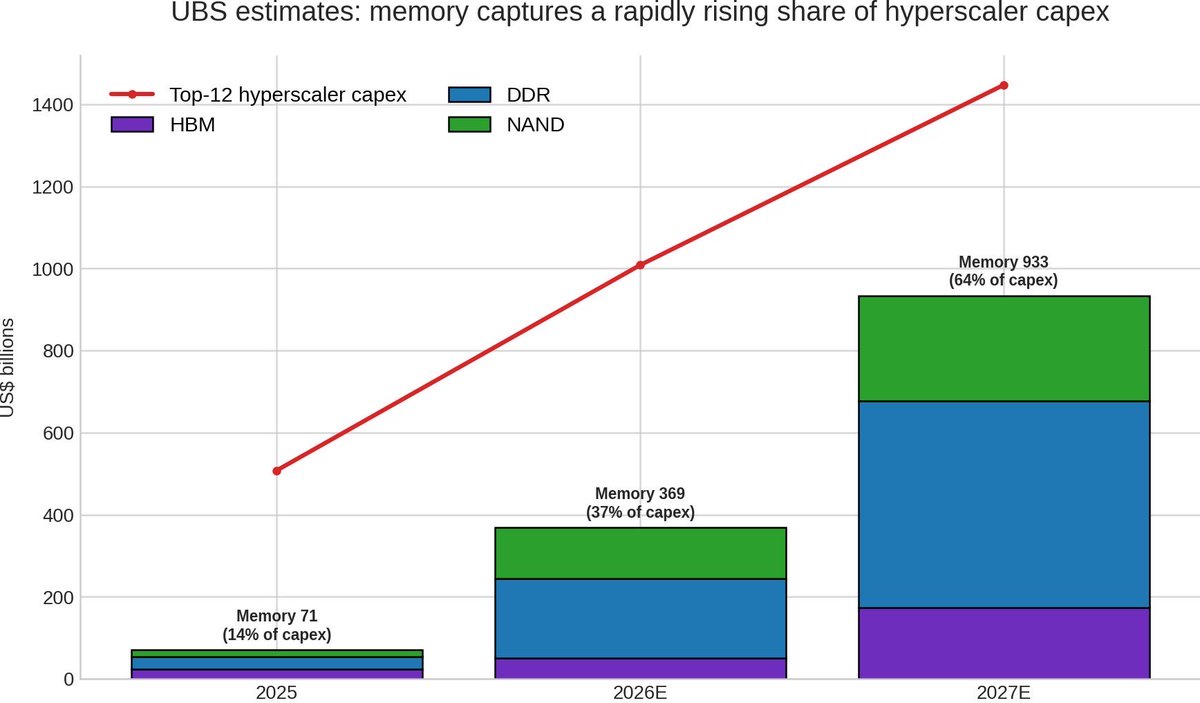
Top-12 hyperscaler capex and memory spending (US$bn) | Memory rises from $71bn (14%) in 2025 to $933bn (64%) in 2027E
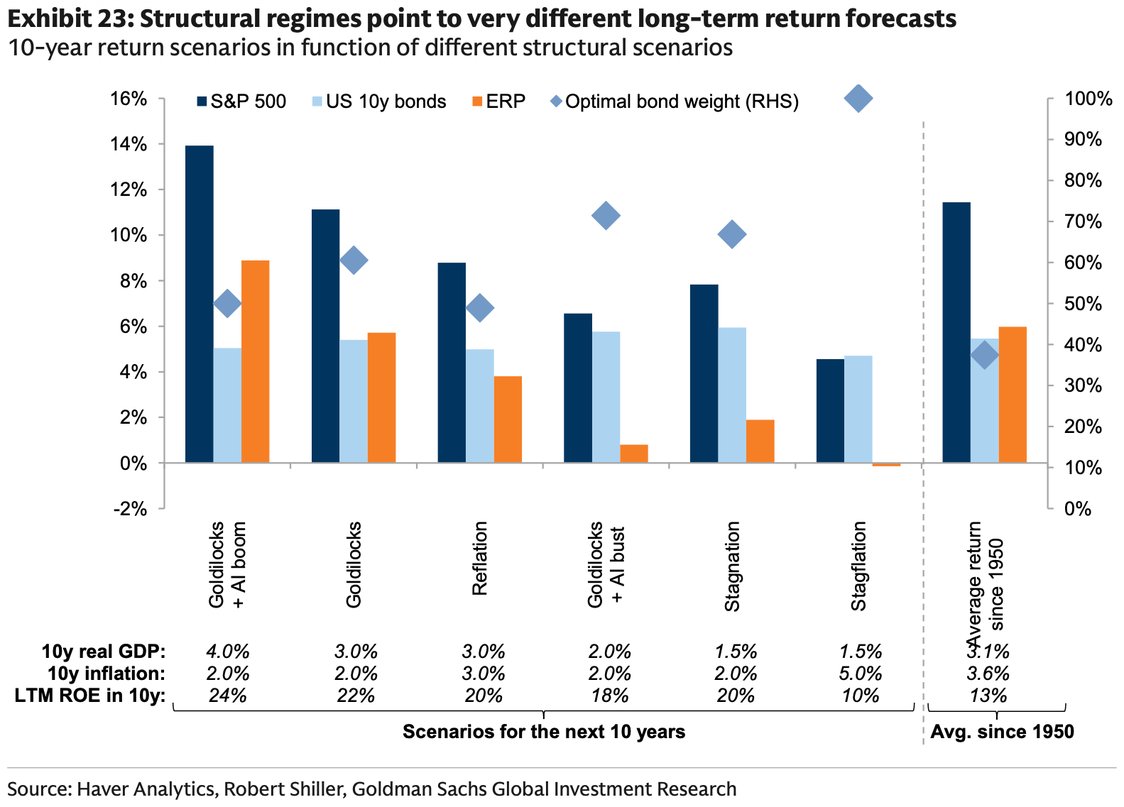
Goldman 10-year annualized return scenarios by structural regime | S&P 500 at 14% in "Goldilocks + AI boom" vs ~4.5% in stagflation
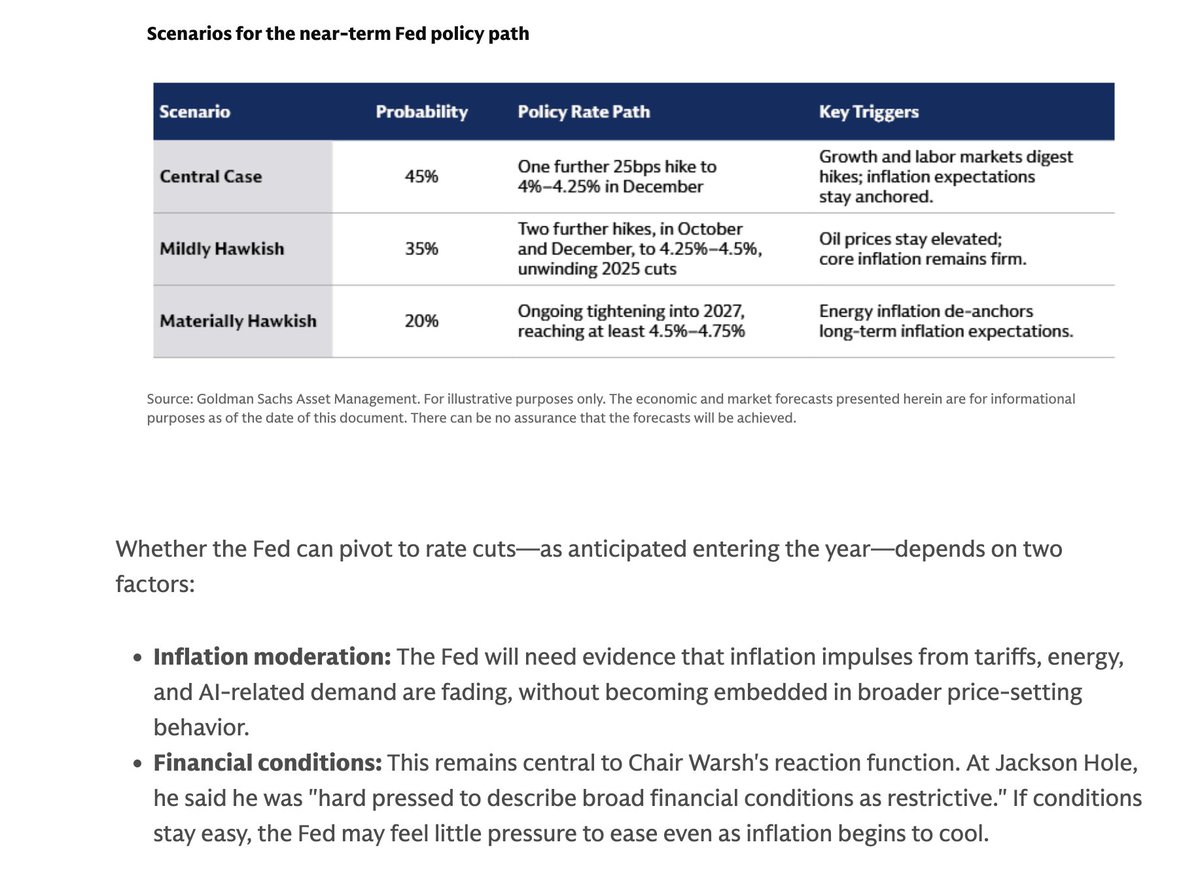
Goldman's near-term Fed policy scenarios and probabilities | The base case (45%) sees a December hike to 4-4.25%, while the most hawkish (20%) has tightening extend into 2027
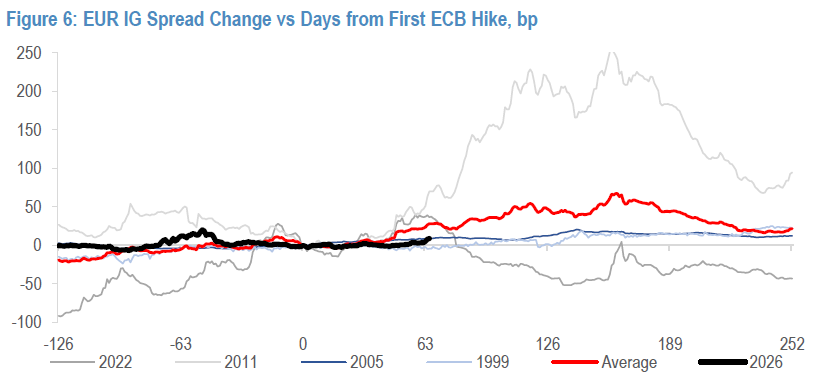
EUR IG credit spread change vs days from the first ECB hike (bp) | 2011 widened more than 250bp after the first hike while 2022 tightened about 43bp, a wide dispersion