Key points
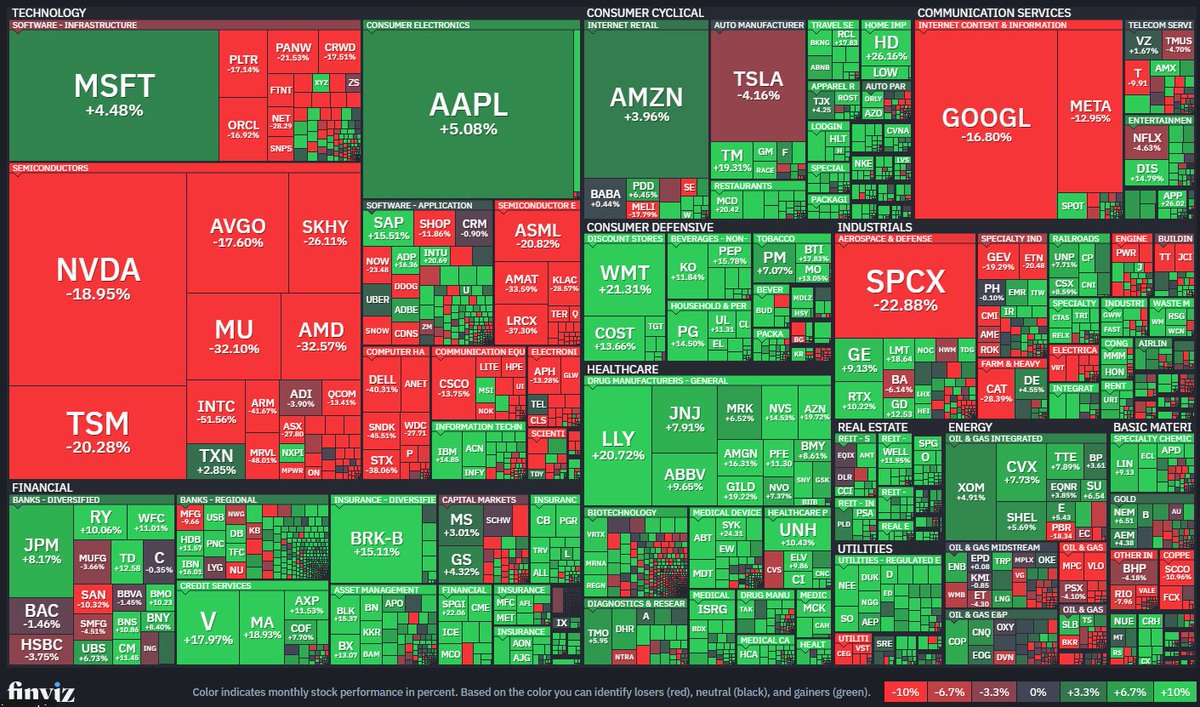
Monthly performance heatmap of US stocks (finviz; red down, green up) | INTC -52% and NVDA -19%, while HD +26% and WMT +21%
Image source: @MikeZaccardi
Monthly performance heatmap of US stocks (finviz; red down, green up) | INTC -52% and NVDA -19%, while HD +26% and WMT +21%
Image source: @MikeZaccardi