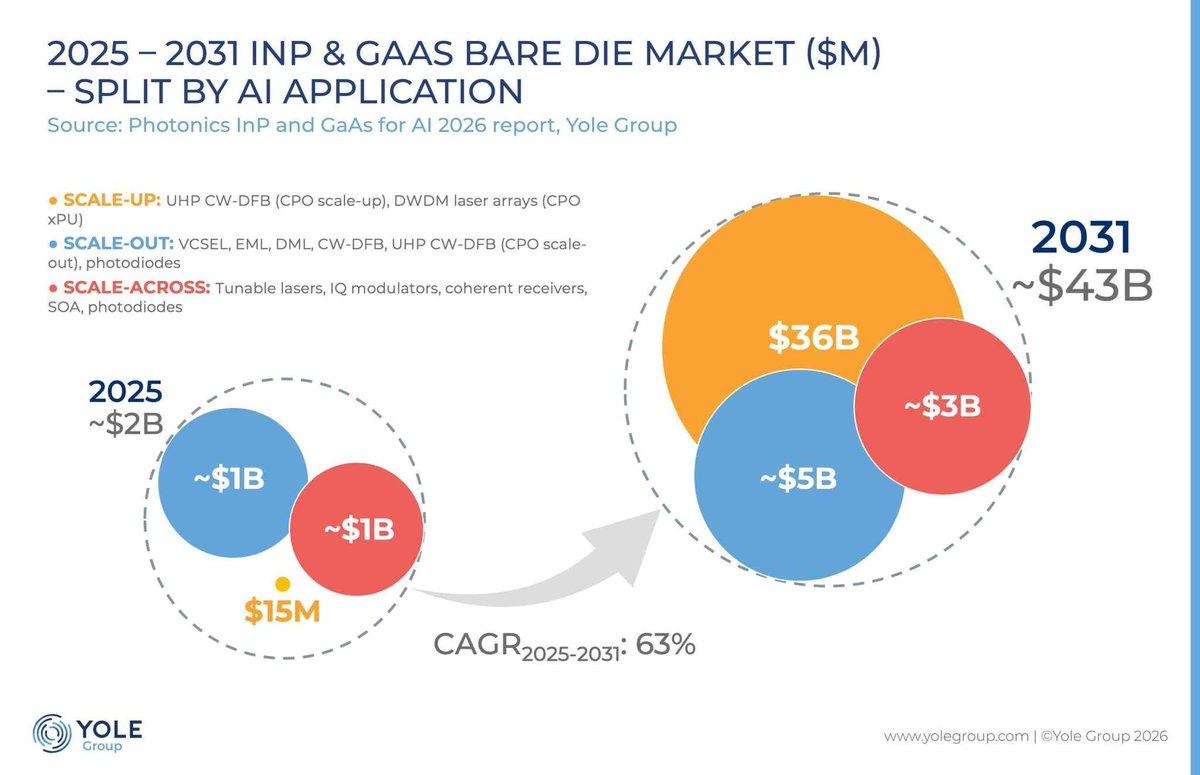
Yole: AI InP/GaAs Bare-Die Market Grows to ~$43B by 2031, a 63% CAGR
AI InP/GaAs bare-die market, 2025 vs 2031, split by application | Rising from ~$2B in 2025 to ~$43B by 2031 at a 63% CAGR, with scale-up at $36B
English financial charts and market context published in 2026-11, page 13.
AI InP/GaAs bare-die market, 2025 vs 2031, split by application | Rising from ~$2B in 2025 to ~$43B by 2031 at a 63% CAGR, with scale-up at $36B
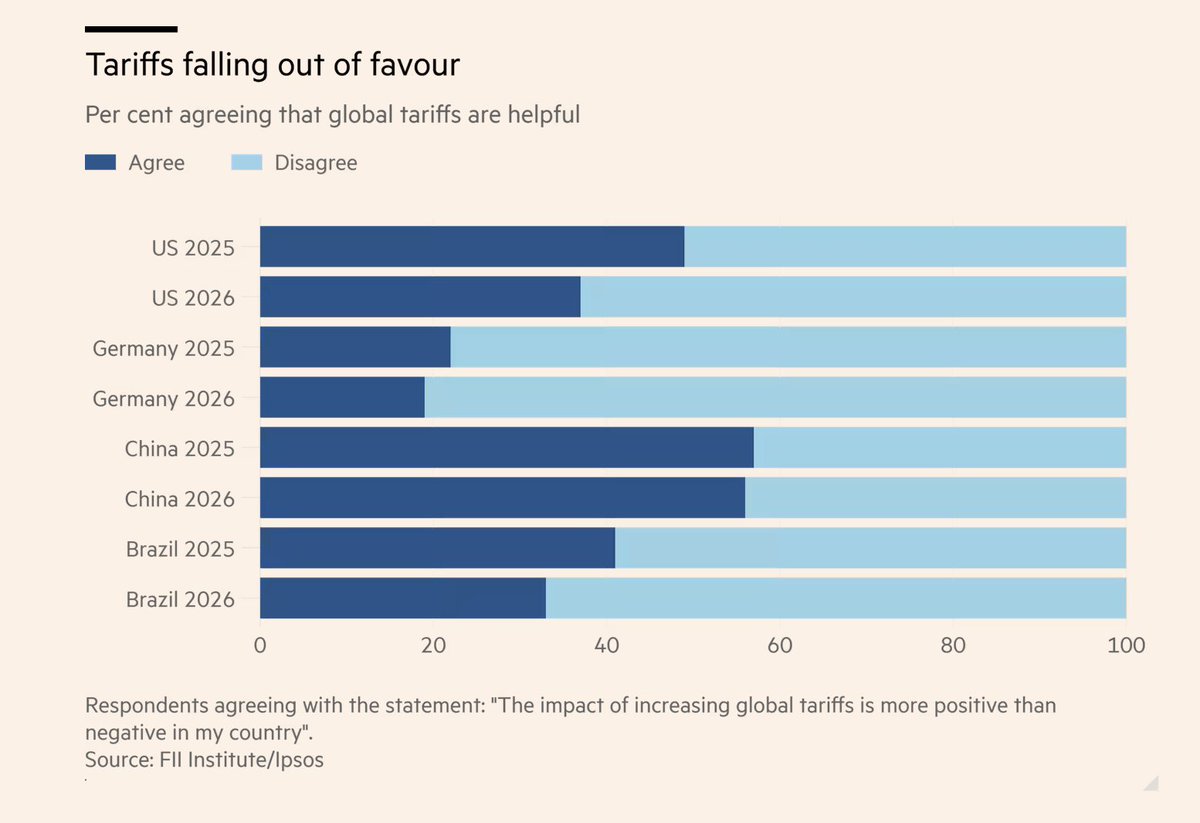
Percent agreeing global tariffs help their country (FII/Ipsos) | US fell from 49% in 2025 to 37% in 2026; China stays highest near 56%
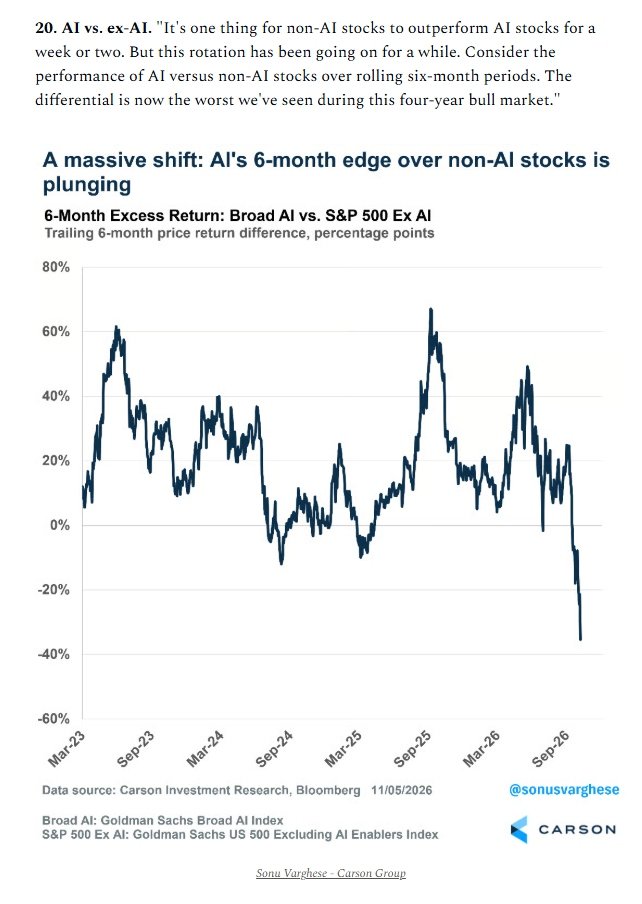
Trailing 6-month excess return, Broad AI vs S&P 500 ex-AI (percentage points) | Now around -35%, the worst of this four-year bull market after peaking near +60% in September
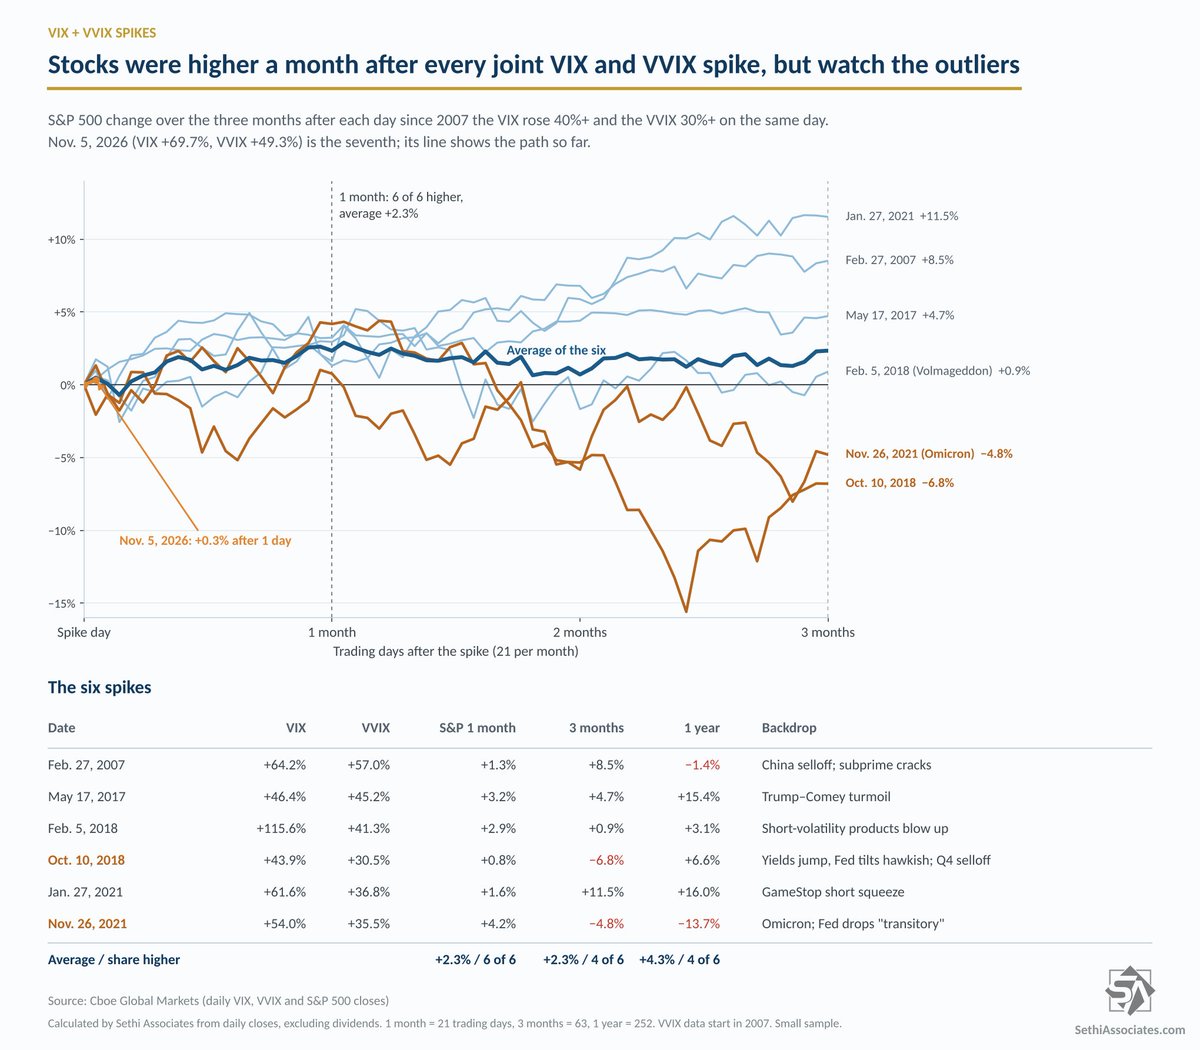
S&P 500 path after same-day VIX and VVIX spikes, 6 cases since 2007 | Up one month later in all six (avg +2.3%), but higher only 4 of 6 at three months, with 2018 and 2021 down 6.8% and 4.8%
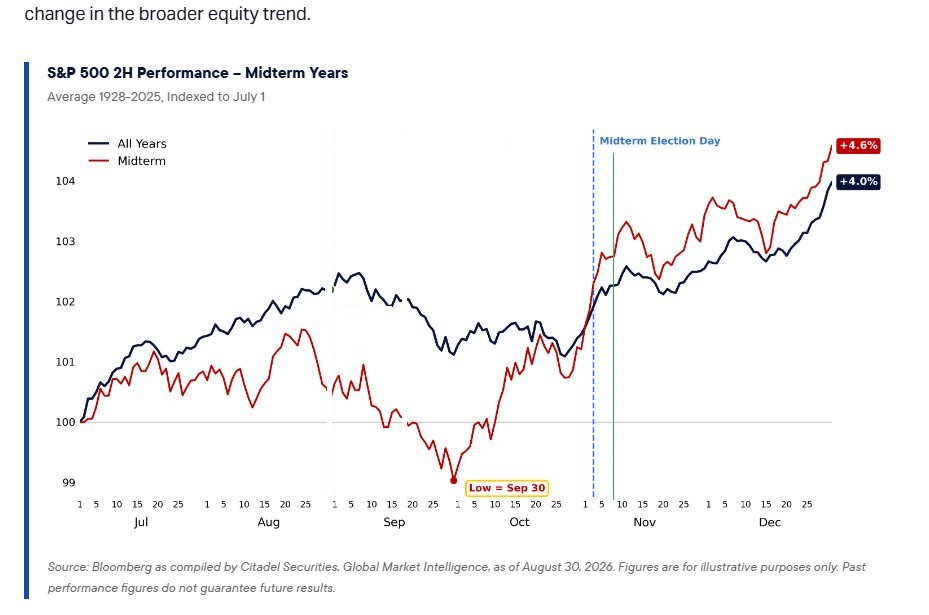
S&P 500 second-half performance, all years vs midterm years, indexed to July 1 | Midterm years end +4.6% vs +4.0% for all years, with the low typically around Sep 30
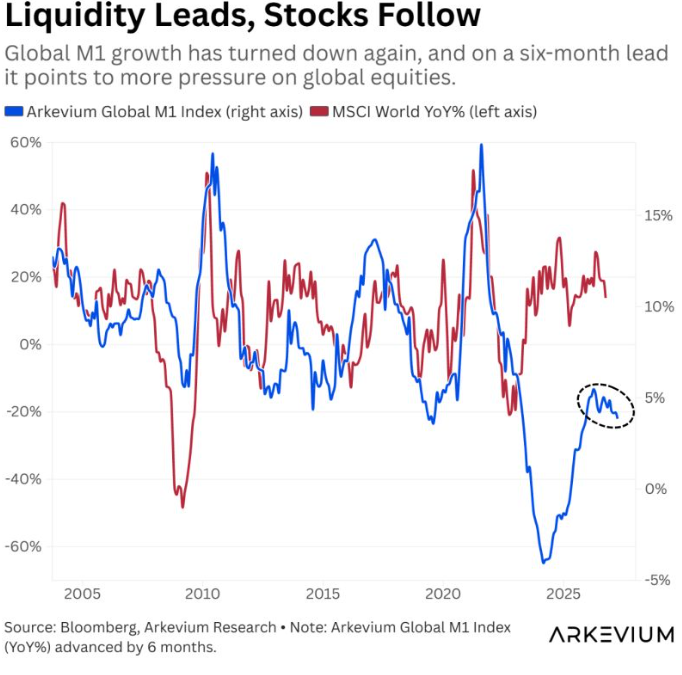
Arkevium Global M1 Index (6-month lead) vs. MSCI World YoY | M1 momentum has rolled over again, pointing to pressure on global equities
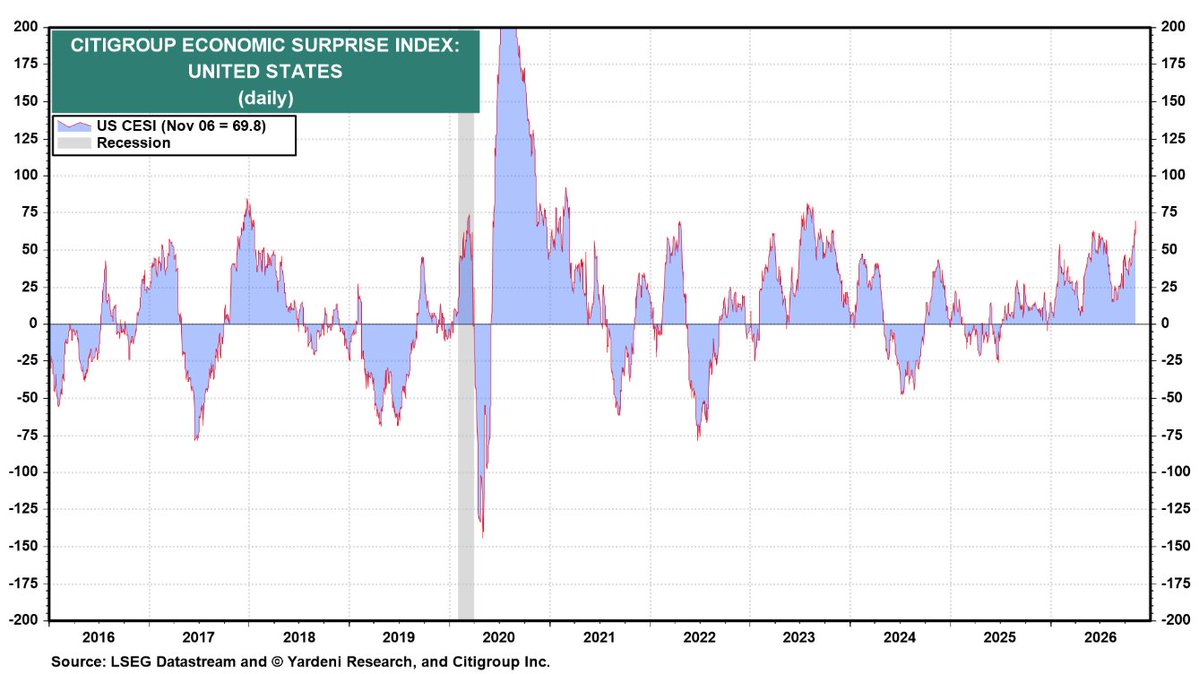
Citigroup Economic Surprise Index for the US, daily | At 69.8 on Nov 6, deep in positive territory as data top forecasts by the widest margin in months
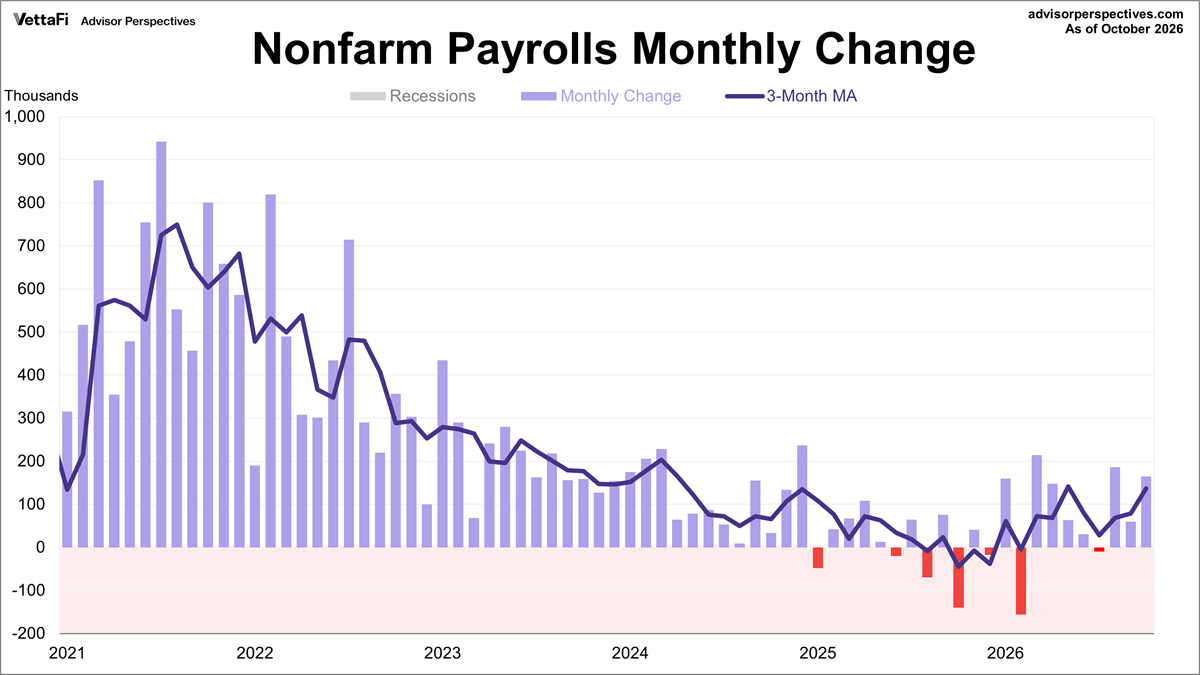
US nonfarm payrolls monthly change and 3-month moving average, thousands | 2026 gains mostly below 200K with several negative months; 3-month average recently back to ~150K
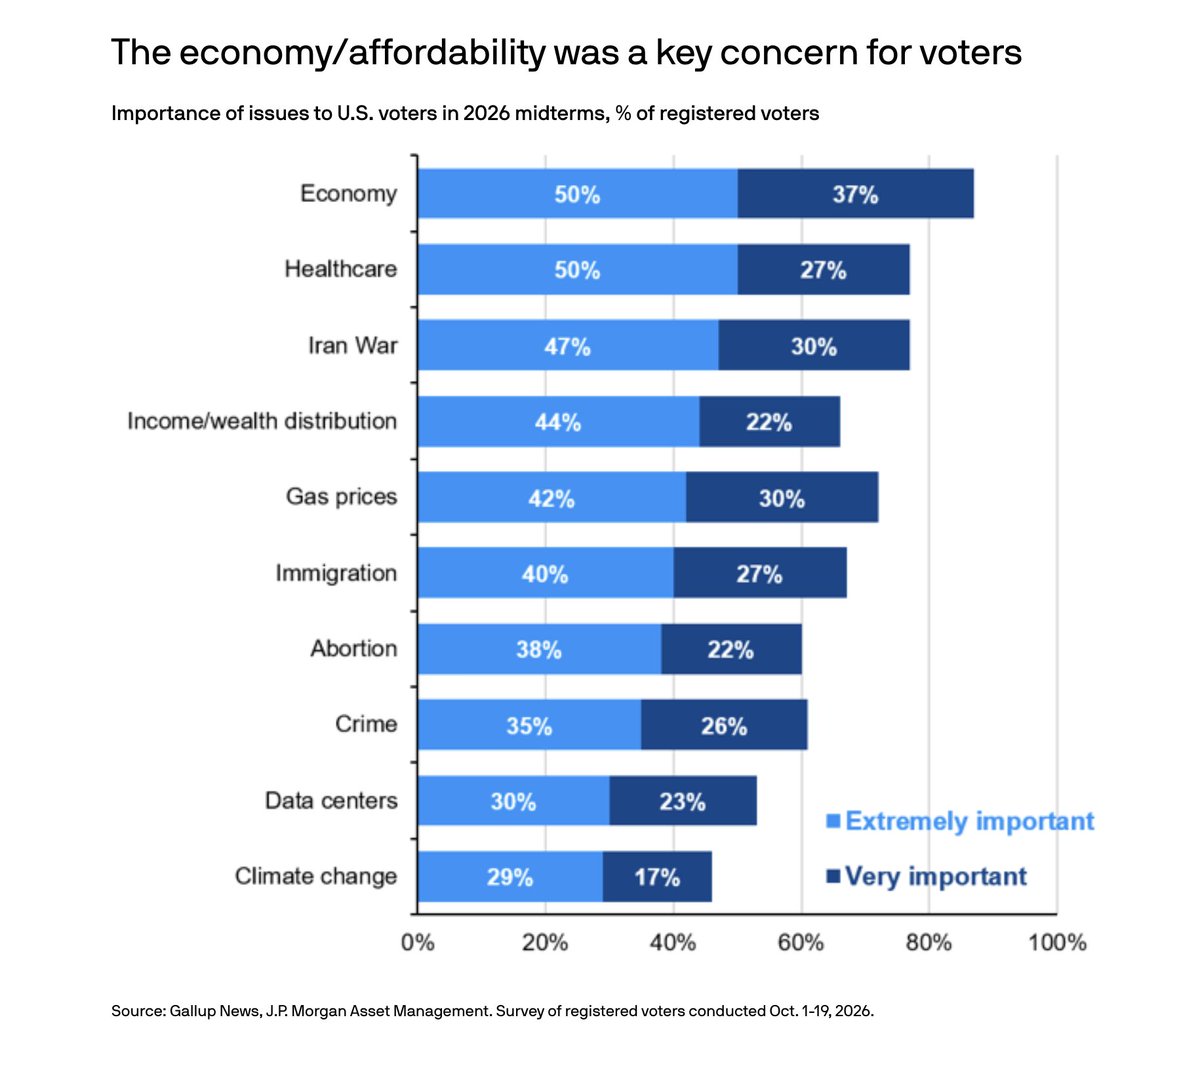
Importance of issues to US voters, 2026 midterms, % of registered voters | Economy leads with 50% 'extremely important' (87% combined), ahead of healthcare and the Iran War
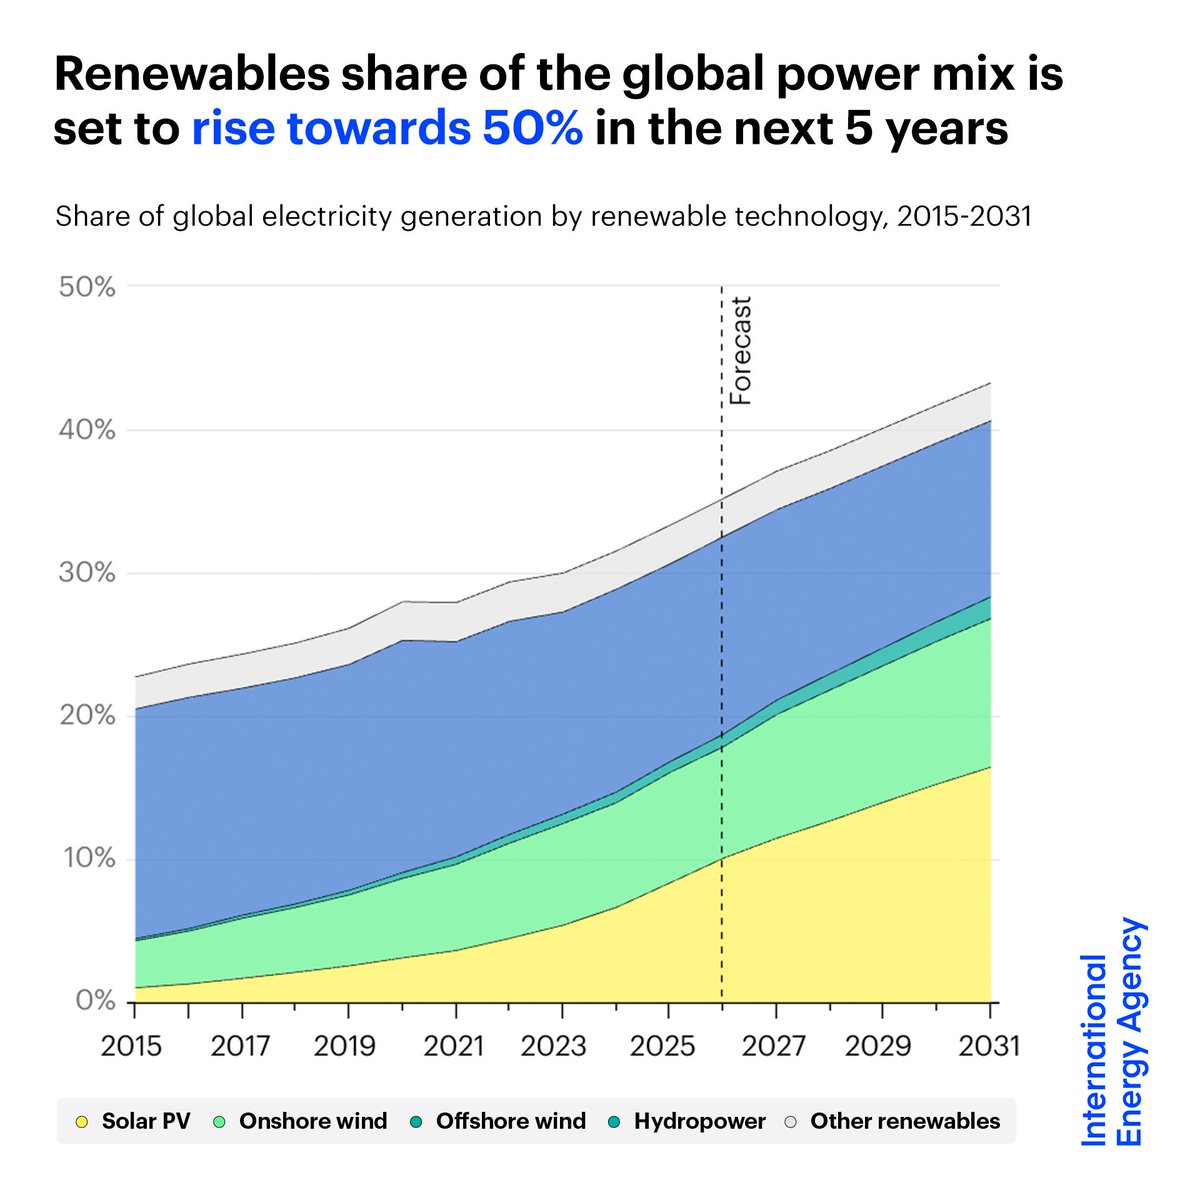
Share of global electricity by renewable technology, 2015-2031 (stacked) | Rising from about a third toward 50%, with solar PV the biggest contributor
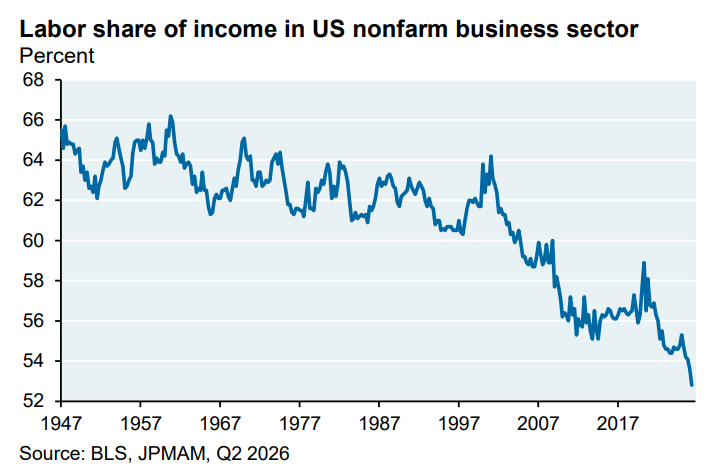
Labor share of income, US nonfarm business sector, %, 1947-2026 | Down from ~64-66% postwar to about 53%, a record low and still falling
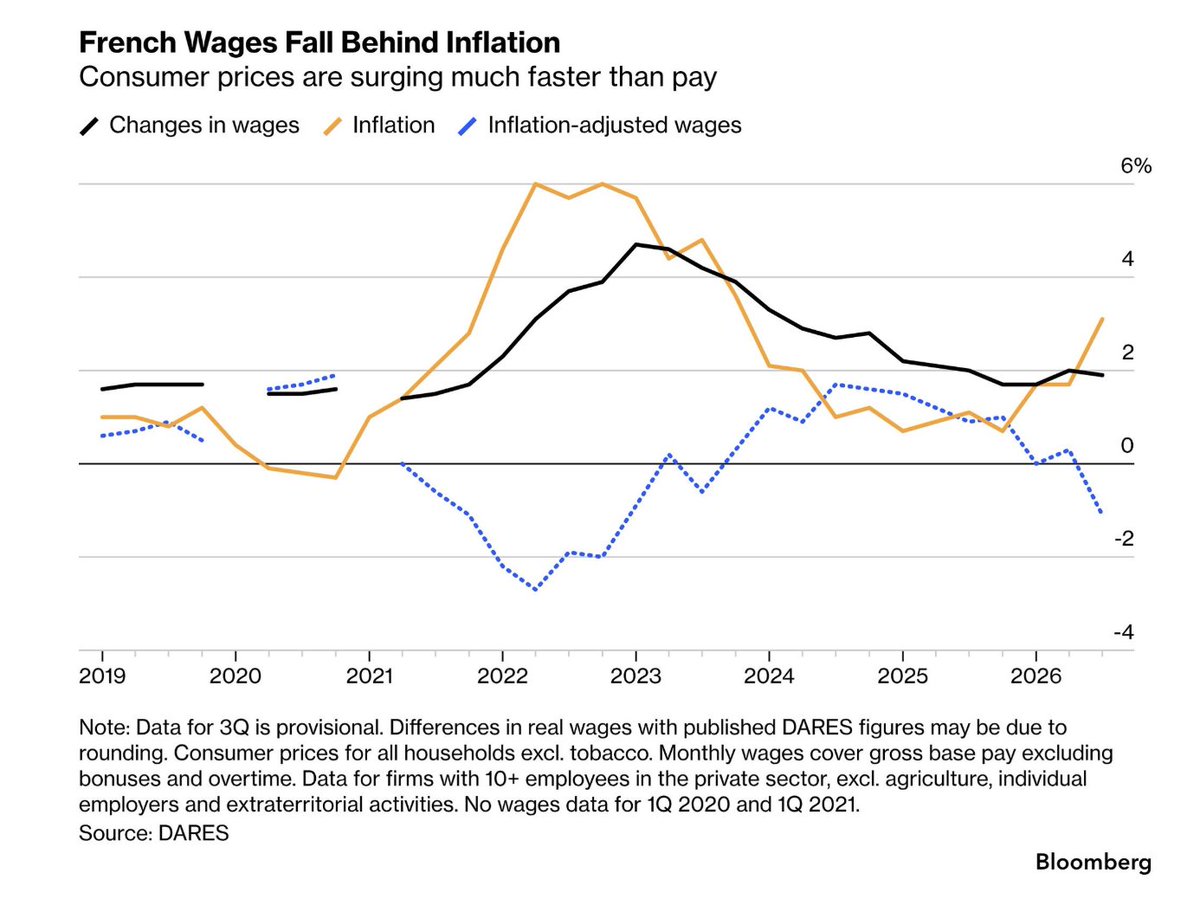
French wage growth, inflation and inflation-adjusted wages, 2019-2026 | Real wages fell about 1.1% YoY in Q3 as inflation near 2.8% ran ahead of pay
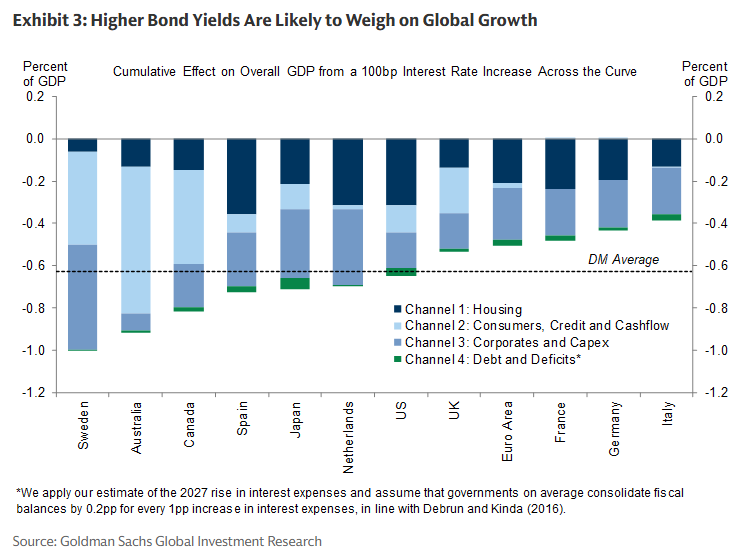
Cumulative GDP effect of a 100bp rate rise across the curve, by country and channel | Sweden ~-1.0 and Australia ~-0.9pp are deepest; DM average ~-0.63pp
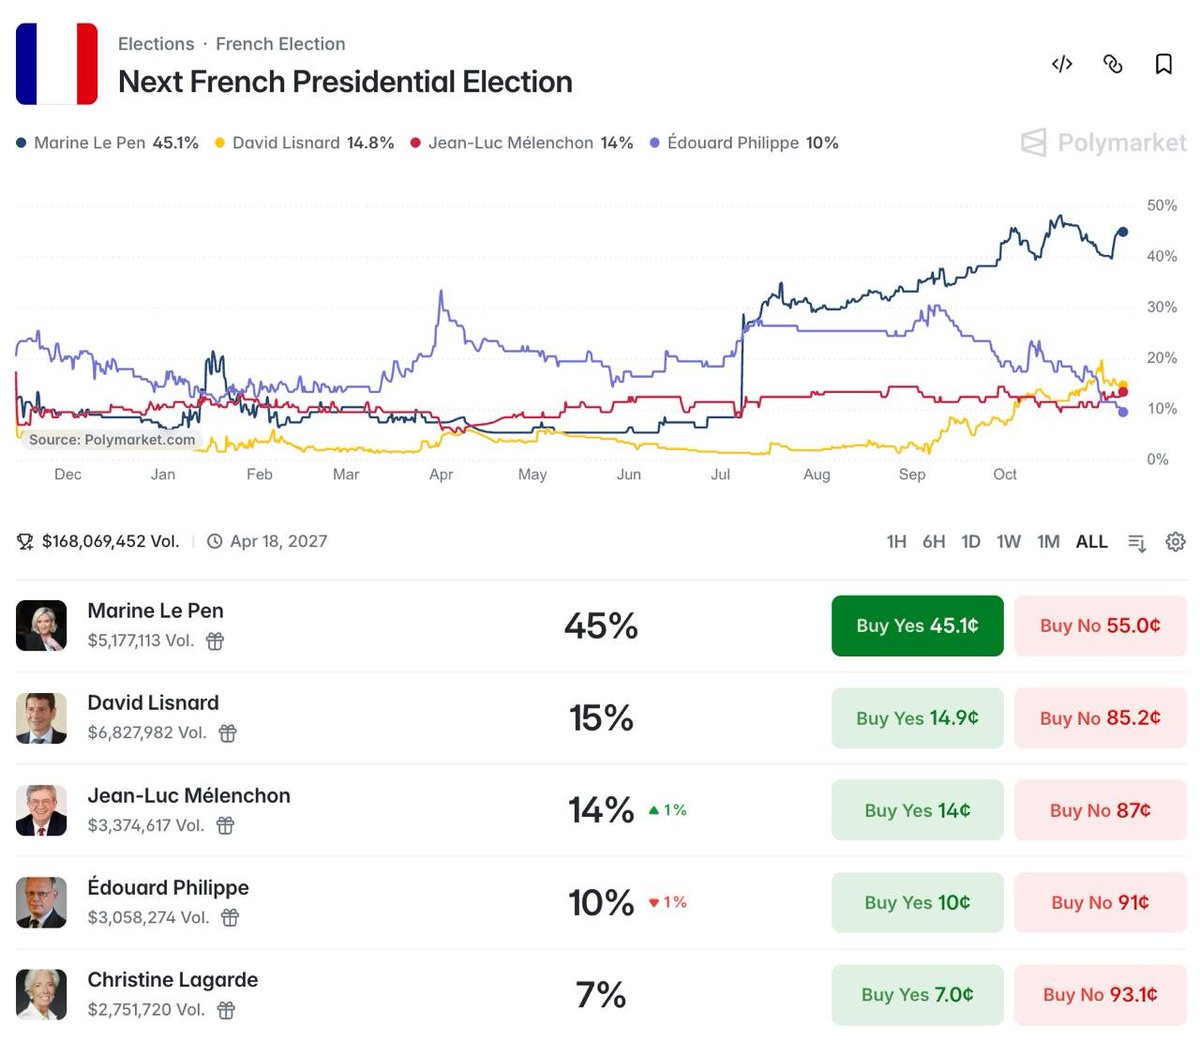
Polymarket implied odds for France's next president | Le Pen 45%, ahead of Lisnard 15%, Melenchon 14% and Philippe 10%
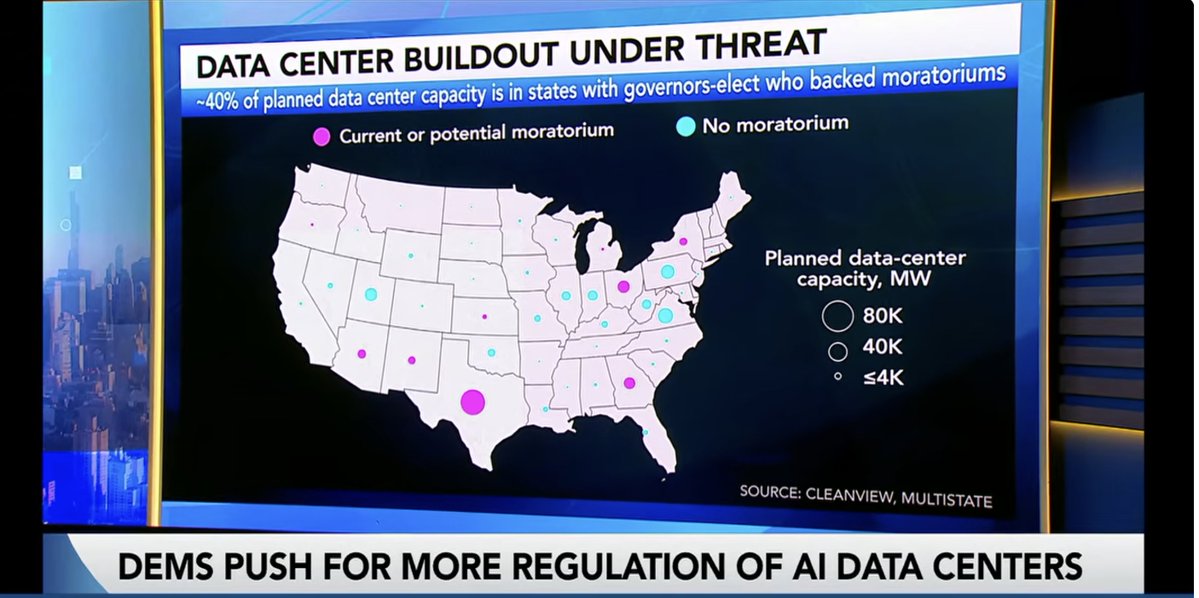
US map of planned data-center capacity by state | About 40% of capacity is in states with governors-elect who backed moratoriums; largest bubbles mark ~80K MW
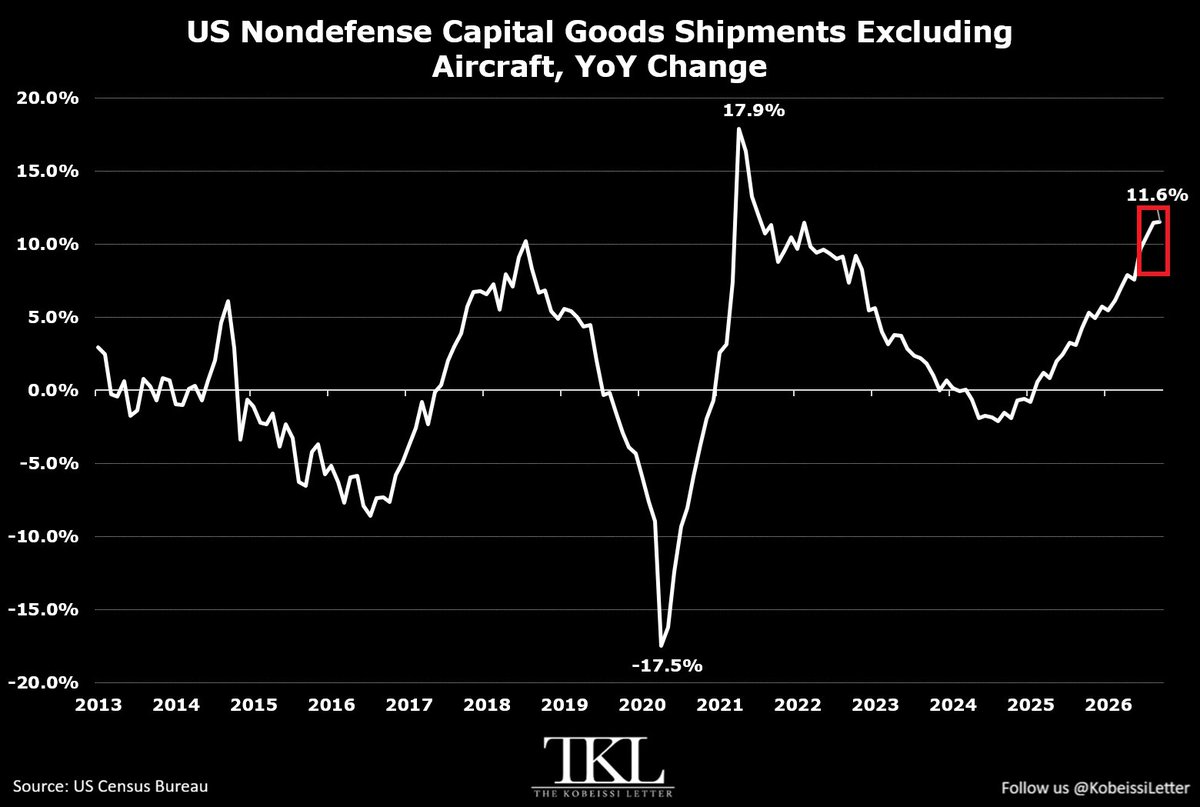
US nondefense capital goods shipments ex-aircraft, YoY change | Latest 11.6%, the fastest pace since the mid-2021 recovery
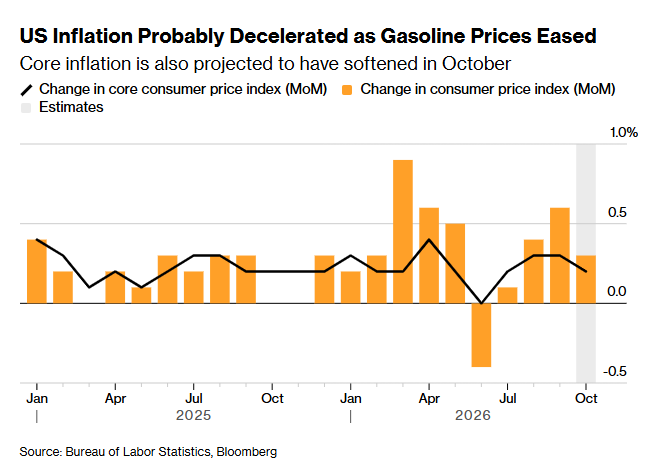
US headline and core CPI month-over-month (October estimated) | Both headline and core seen easing to about 0.2% as gasoline softens
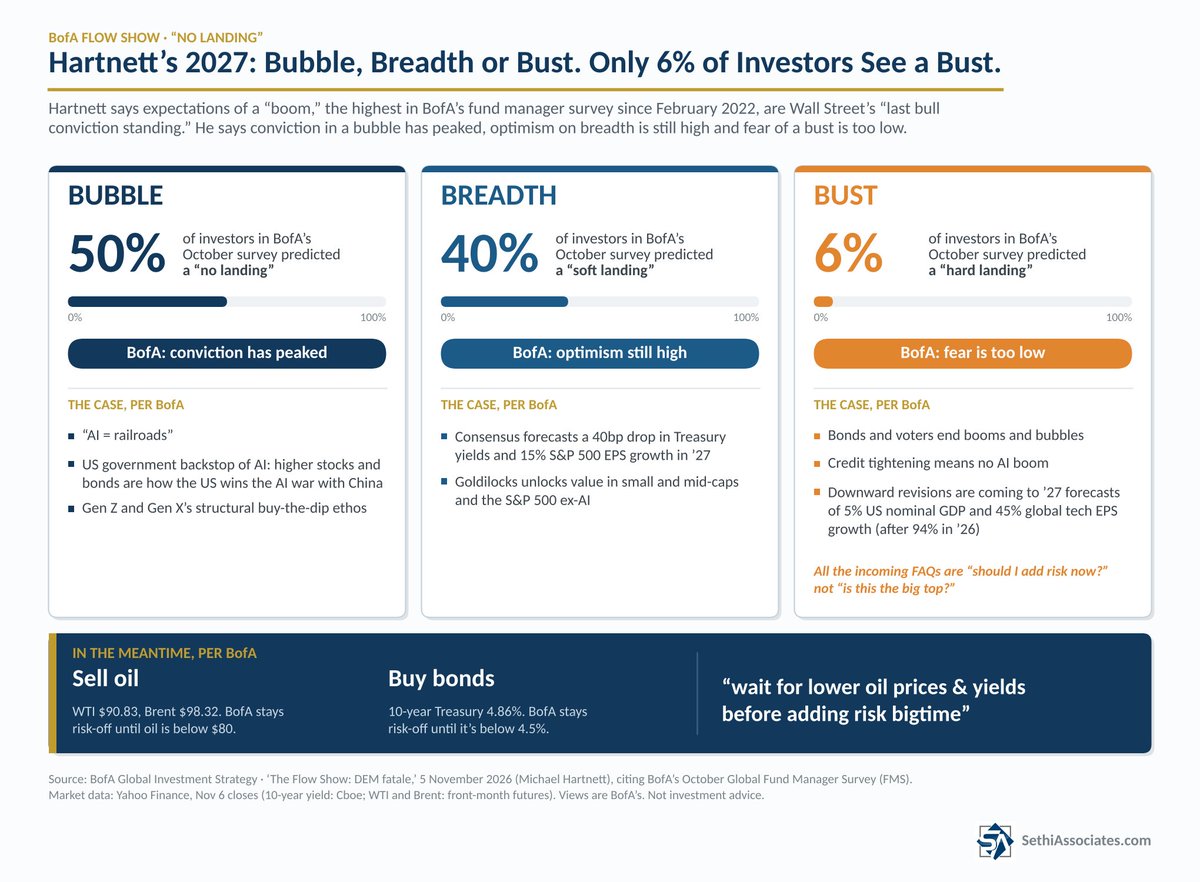
Three scenarios from BofA's October fund manager survey (bubble, breadth, bust) | 50% predict a no-landing, 40% a soft landing and just 6% a hard landing
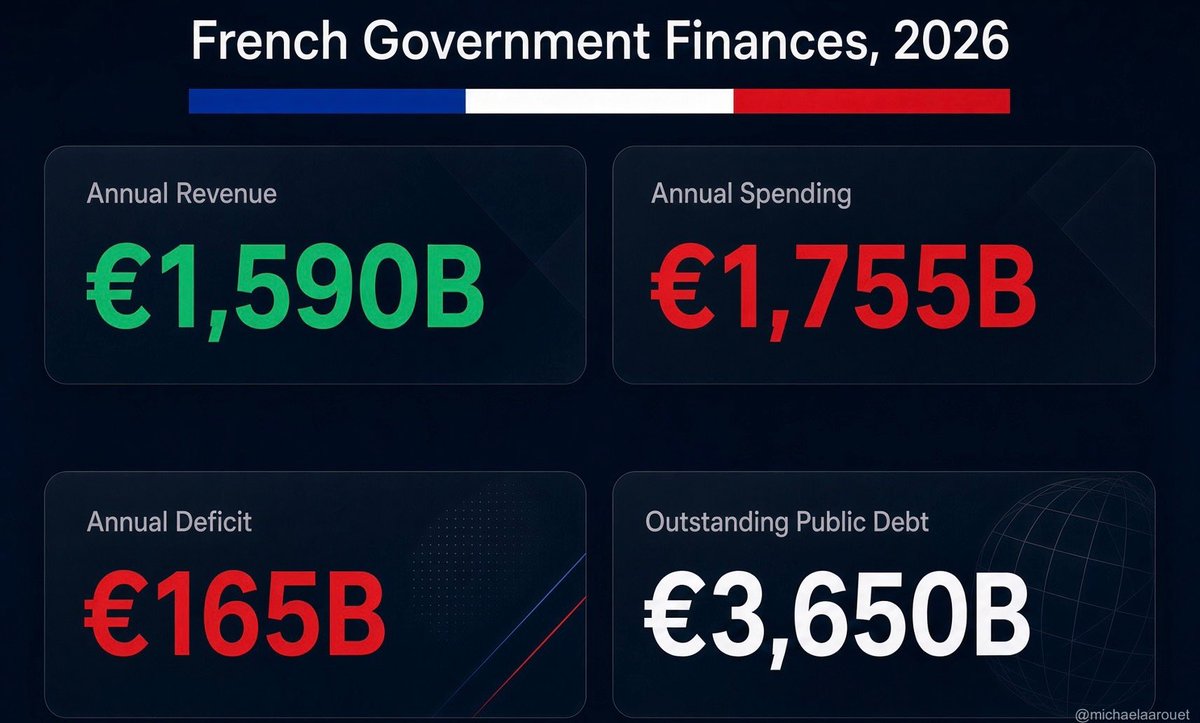
French government finances for 2026 (EUR) | Revenue €1,590B, spending €1,755B, deficit €165B, public debt €3,650B
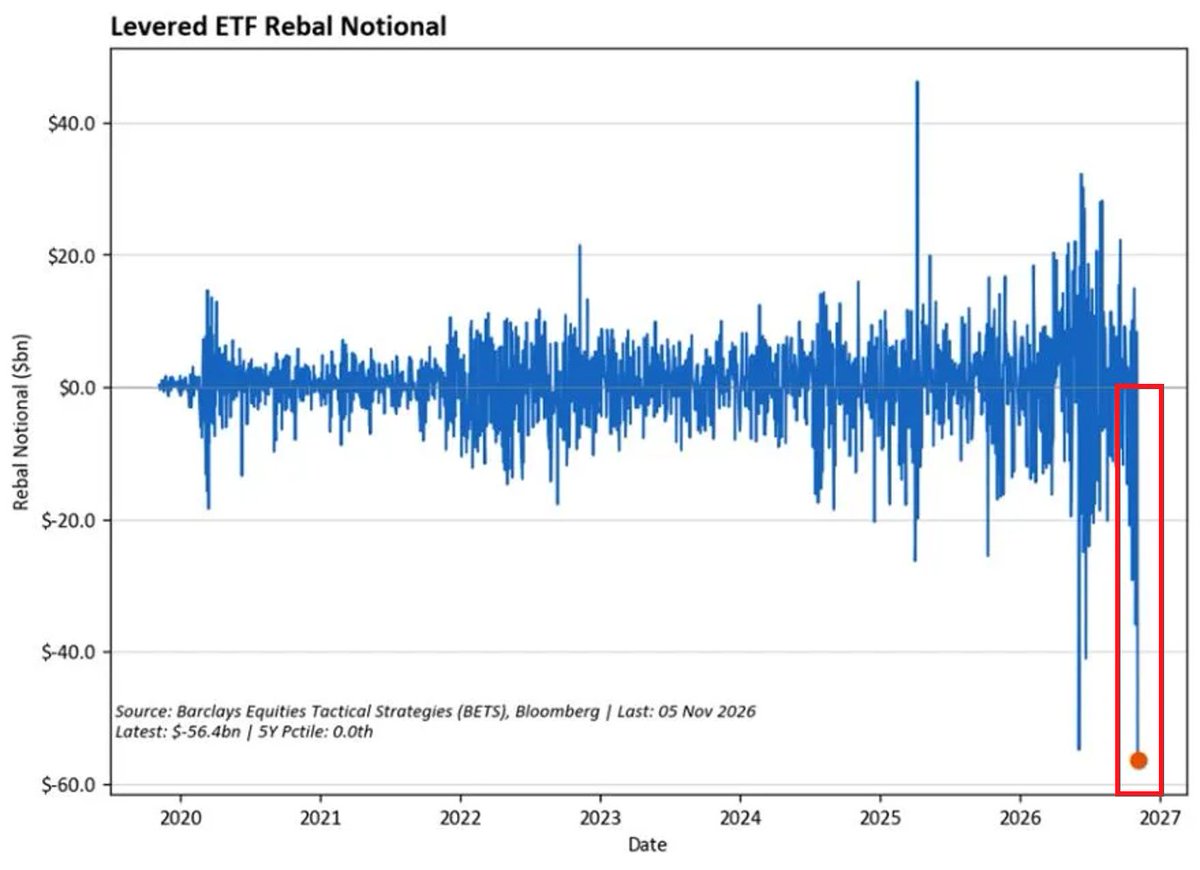
Leveraged ETF rebalancing notional ($bn) | A record -$56.4bn on Nov 5, the most extreme in five years and at the 0th percentile
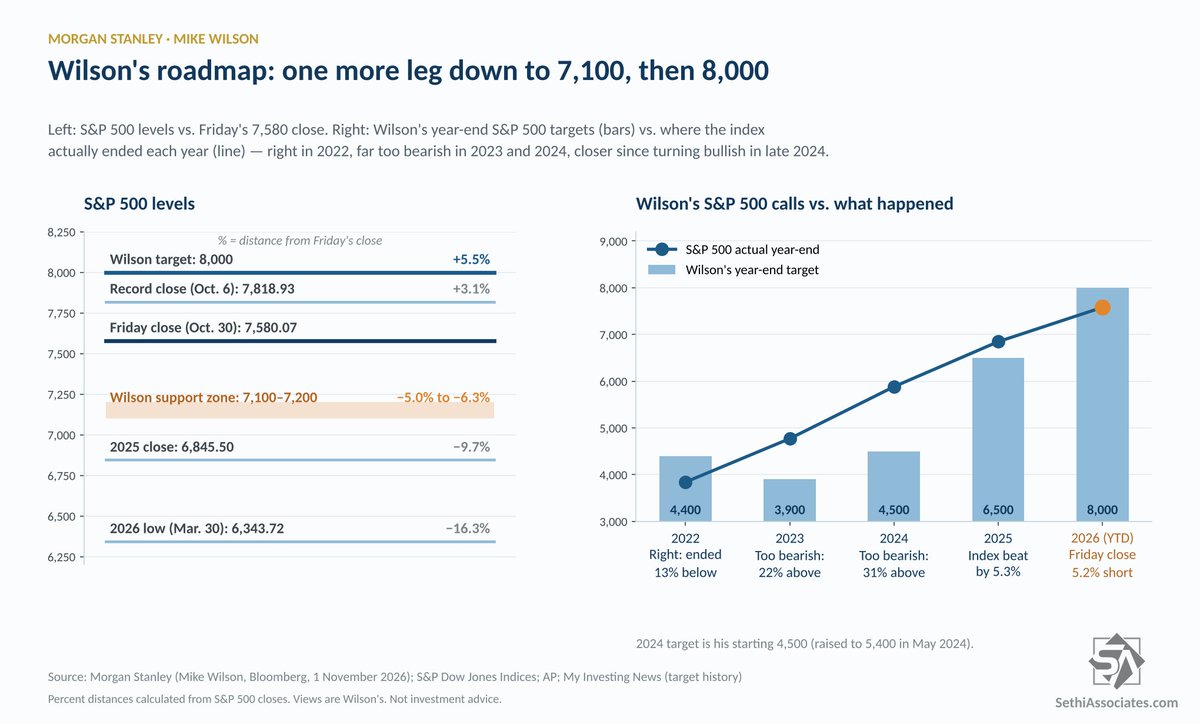
S&P 500 vs Wilson's support zone and year-end target, plus his past calls vs outcomes | Index 7,580; support 7,100-7,200 (-5% to -6.3%), target 8,000
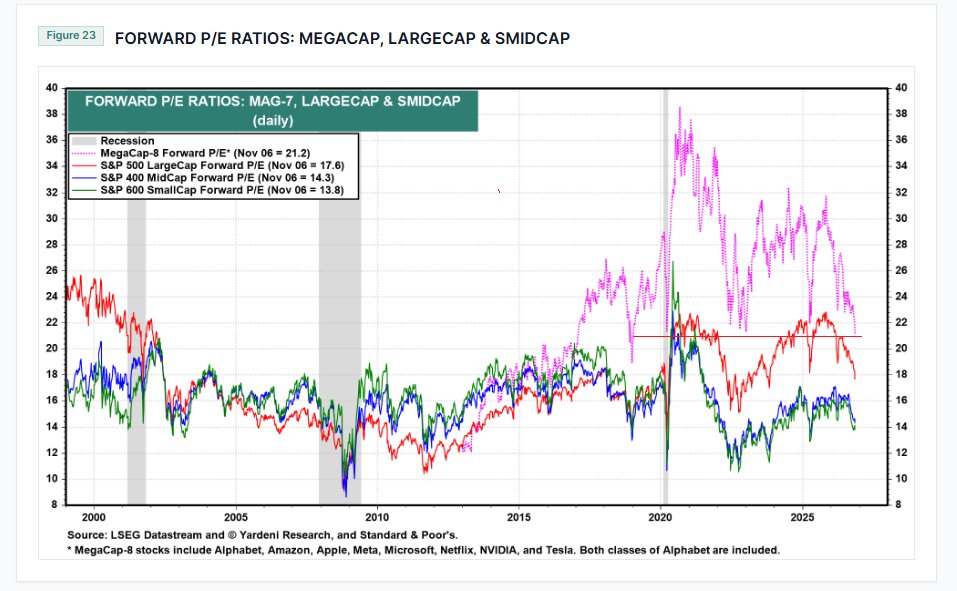
Forward P/E ratios for MegaCap-8, LargeCap, MidCap and SmallCap | MegaCap-8 at 21.2x versus 17.6x, 14.3x and 13.8x, the tightest premium in eight years
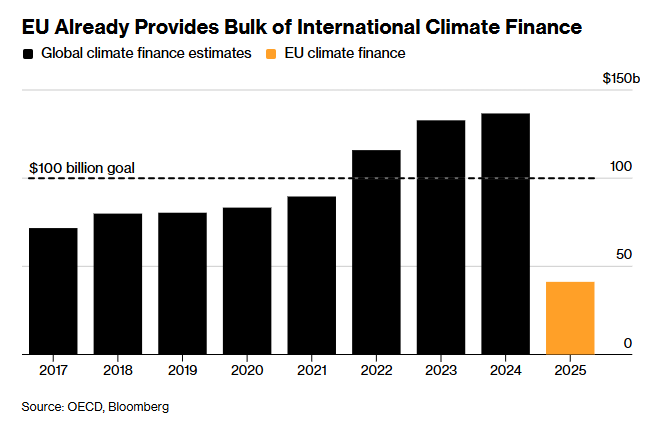
Global international climate finance estimates vs EU climate finance ($bn) | The global total reached ~$130bn in 2024, with the EU providing ~$38bn in 2025
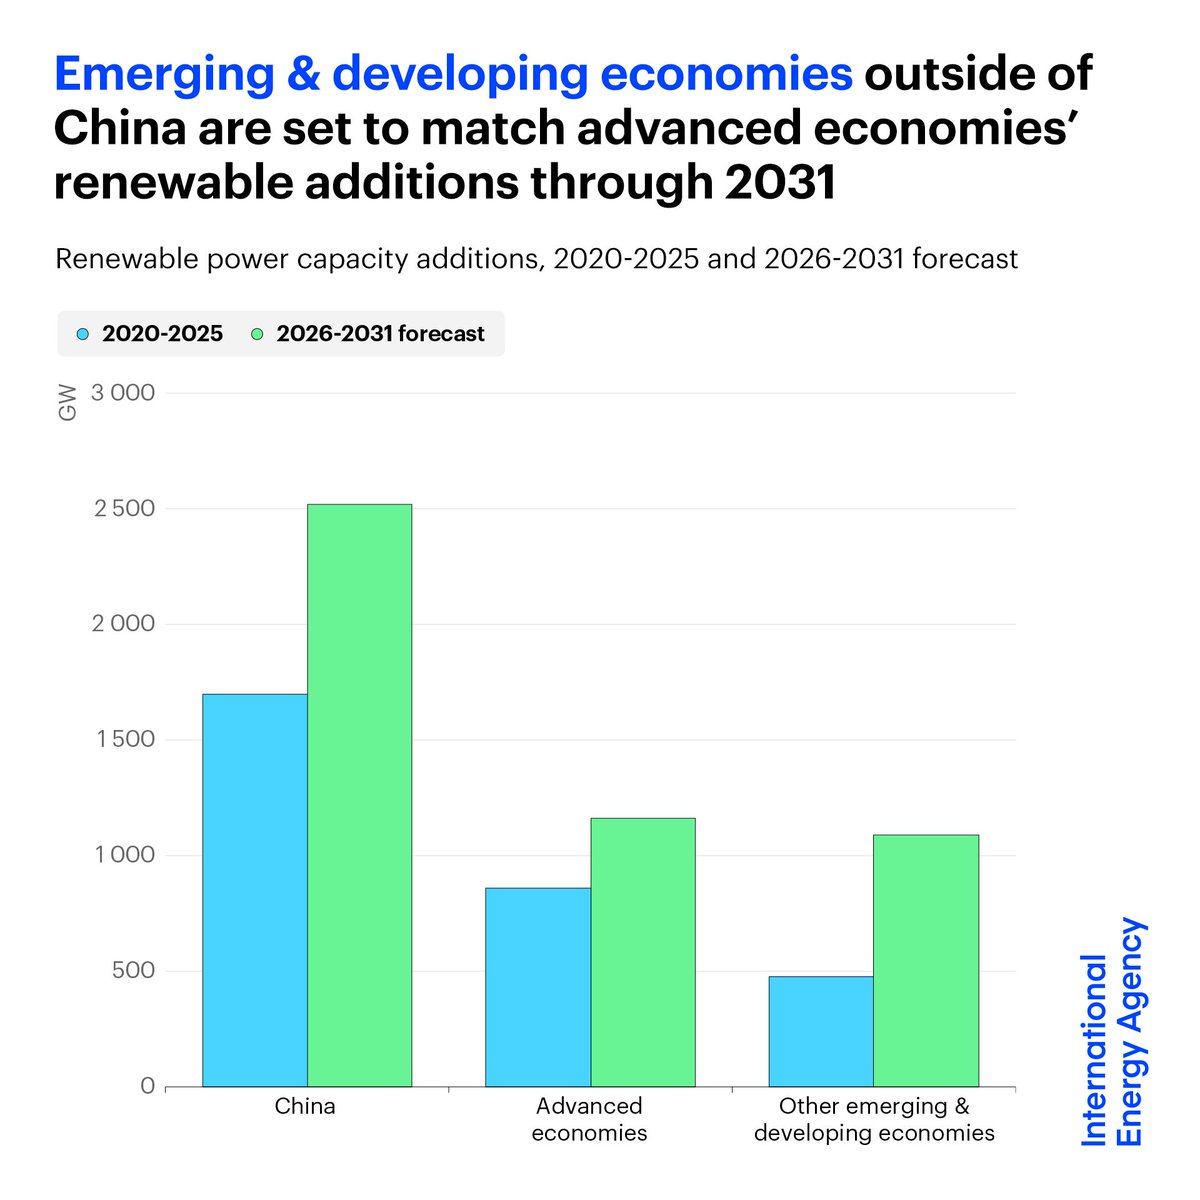
Renewable capacity additions by region, 2020-25 vs 2026-31 forecast (GW) | Other EMDE ~1,090 GW in 2026-31, nearing advanced economies' ~1,160 GW
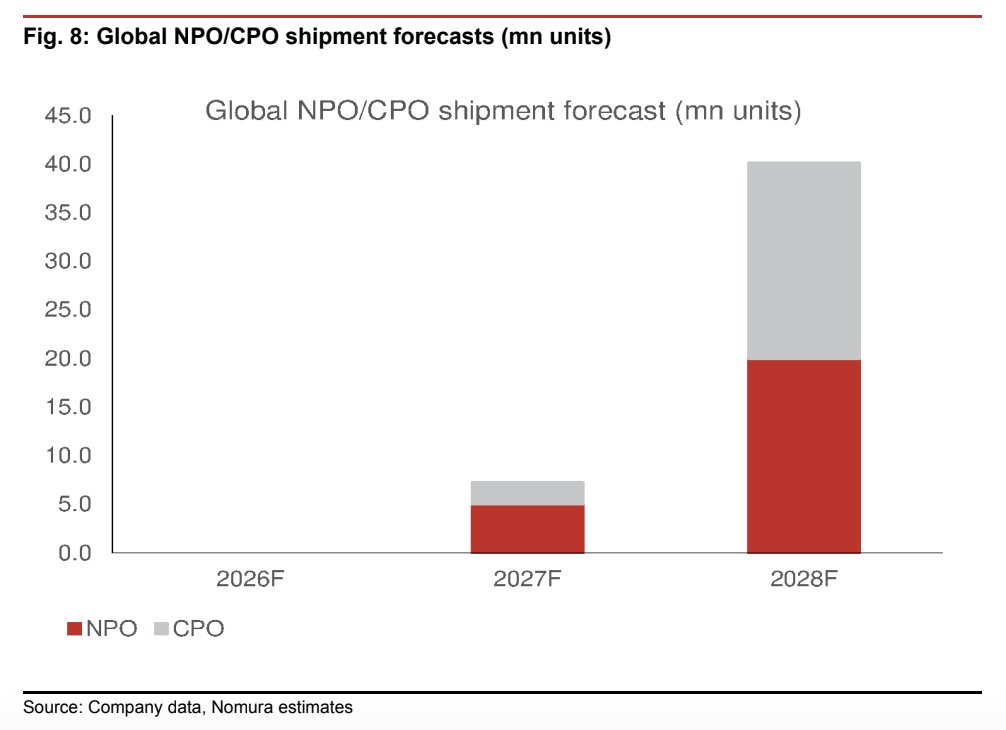
Global NPO/CPO shipment forecast (mn units, NPO+CPO stacked) | ~40mn in 2028F vs ~7.5mn in 2027F, more than 5x growth
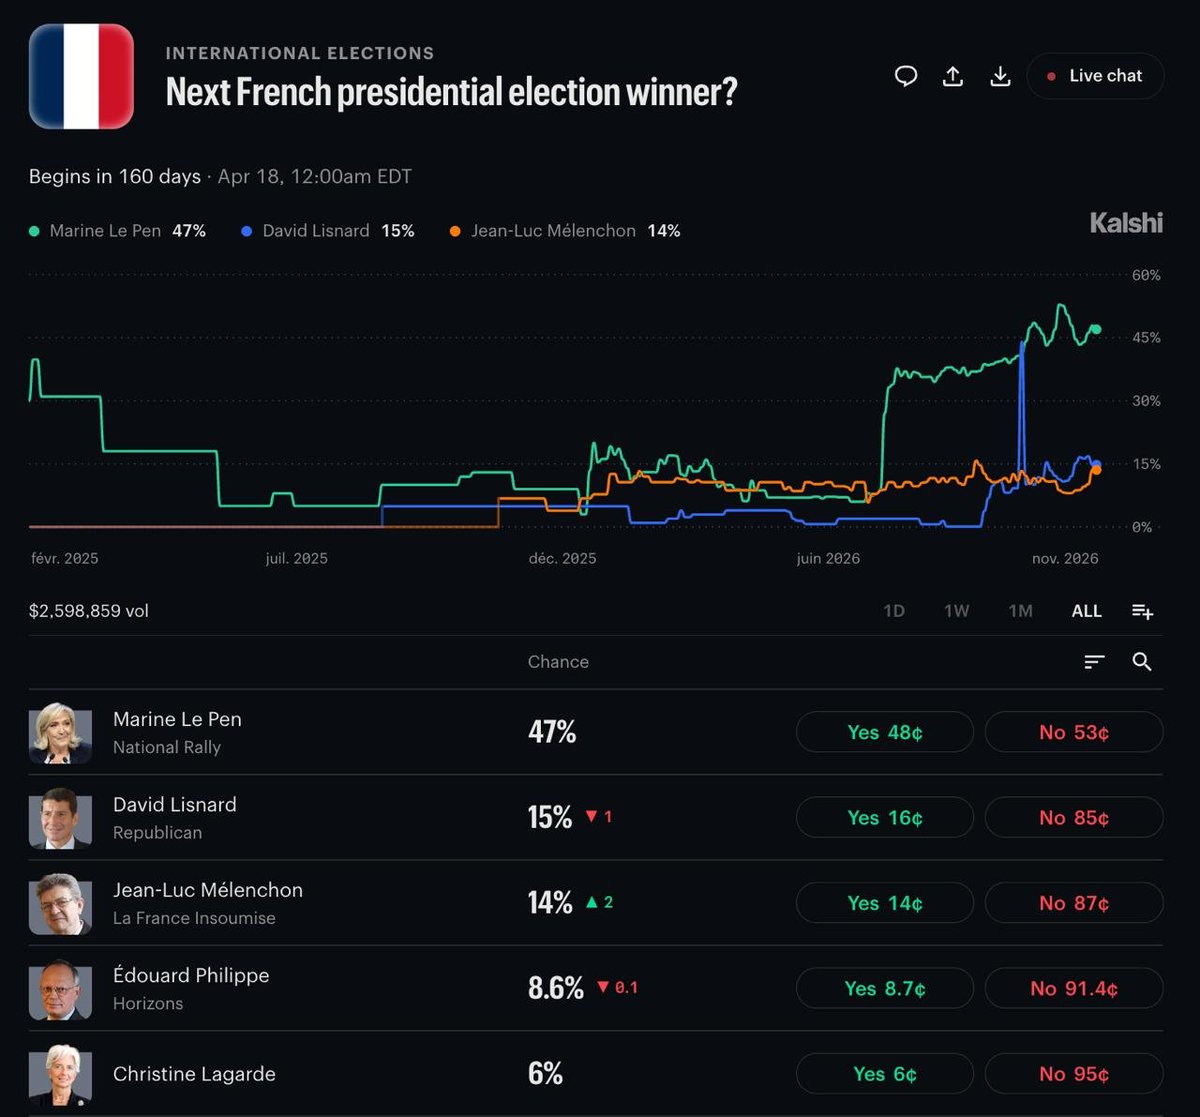
Kalshi implied odds for the 2027 French presidential winner | Le Pen 47%, Lisnard 15%, Mélenchon 14%, Philippe 8.6%, Lagarde 6%
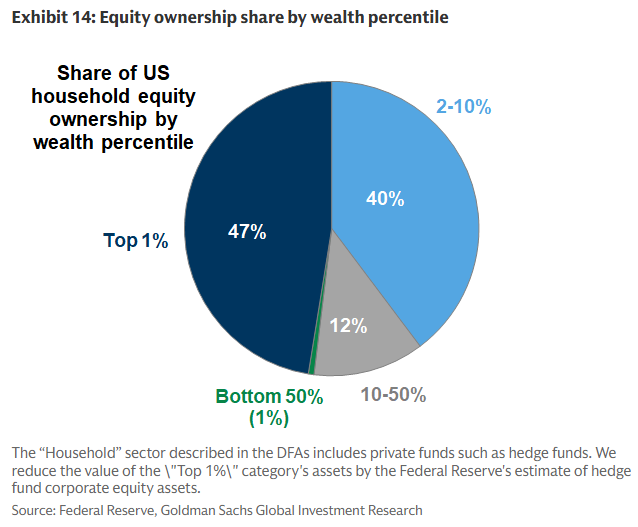
Share of US household equity ownership by wealth percentile | The top 1% hold 47% and the top 10% hold 87%, versus 1% for the bottom half
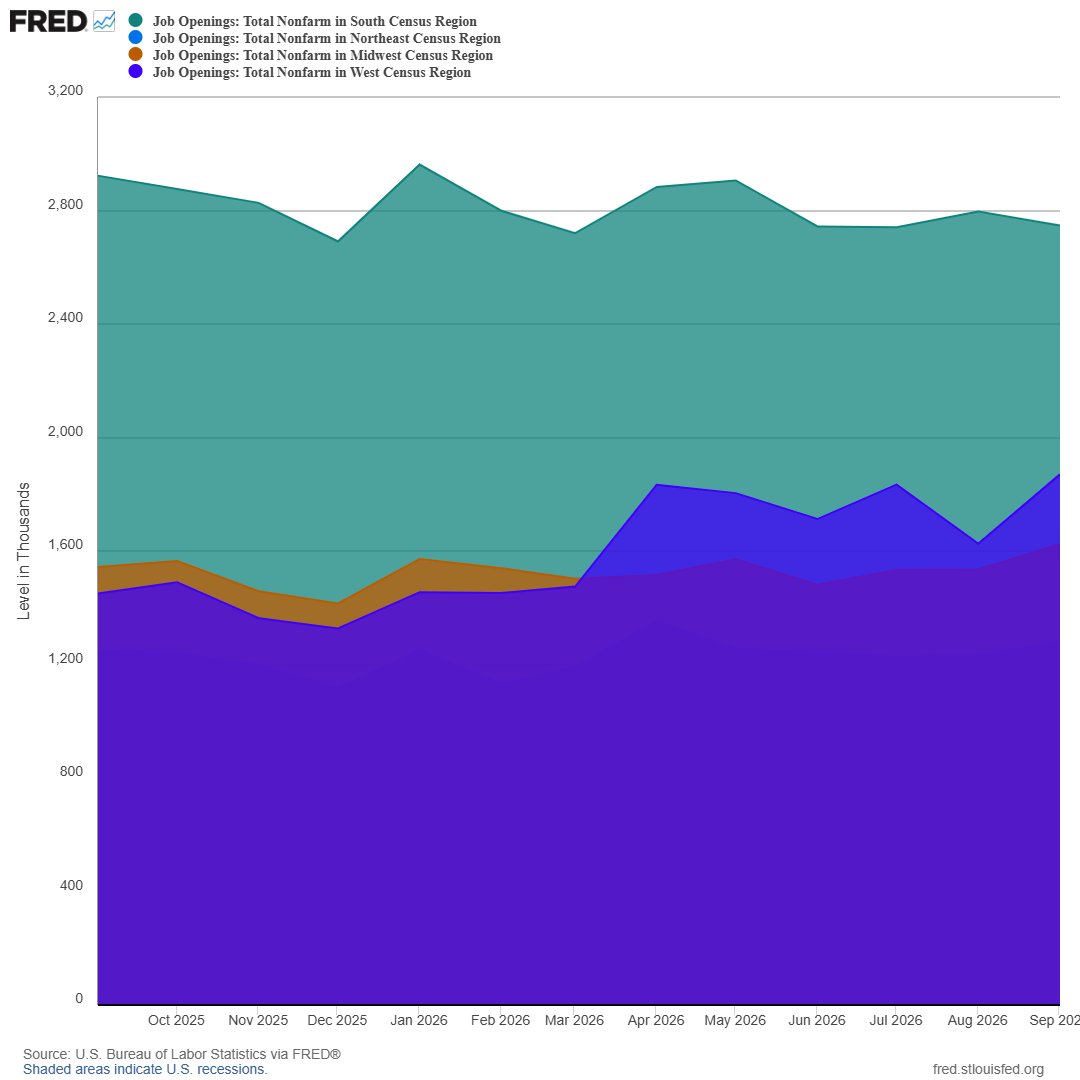
Total nonfarm job openings by US census region (thousands) | The South leads at roughly 2.7 million, ahead of the West near 1.5 million
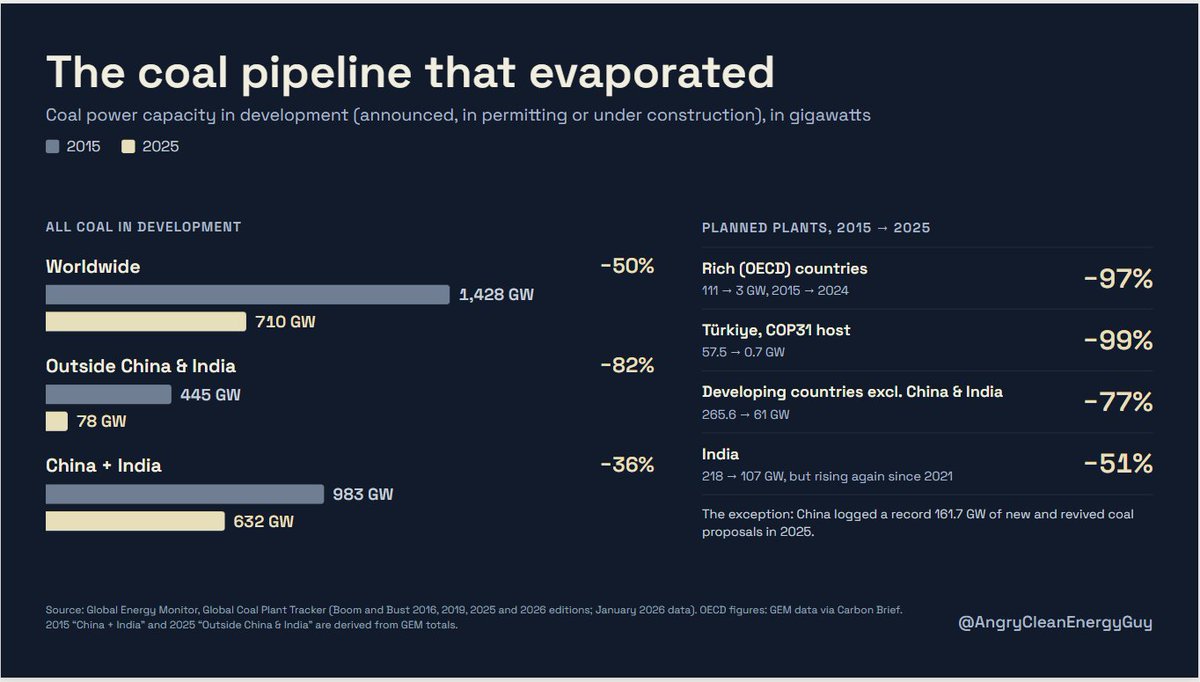
Coal power capacity in development, 2015 vs 2025, GW | Worldwide 1,428 to 710 GW (-50%); outside China & India 445 to 78 GW (-82%)
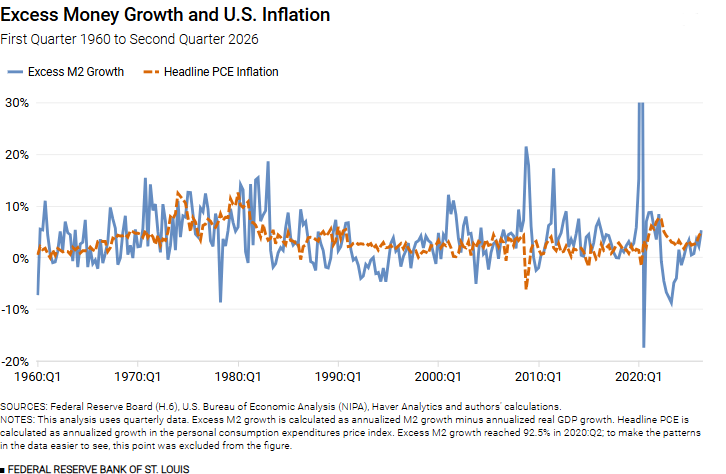
Quarterly excess M2 growth vs headline PCE inflation, 1960-2026 | Excess M2 hit 92.5% in 2020 Q2 (excluded from the chart)
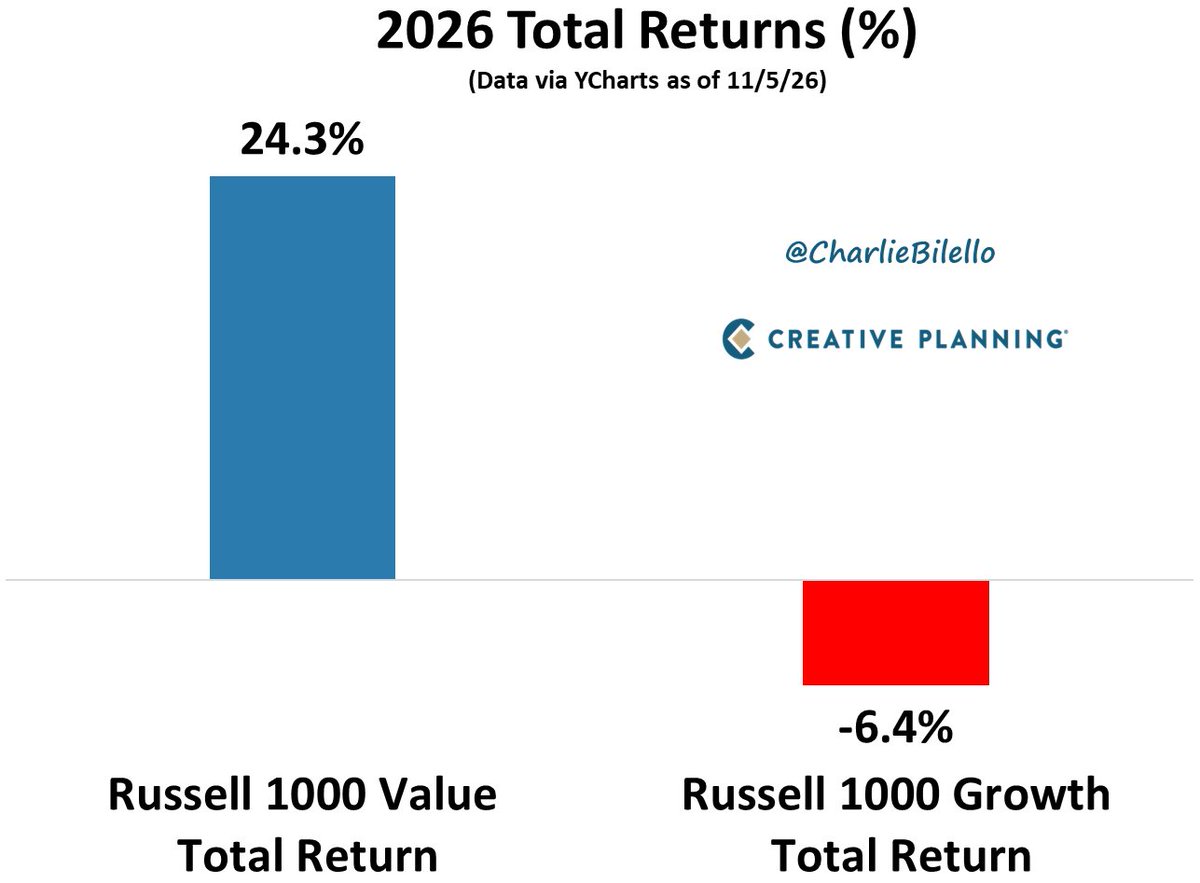
2026 total return, Russell 1000 Value vs Growth | Value +24.3% vs Growth -6.4%, a gap of over 30 points
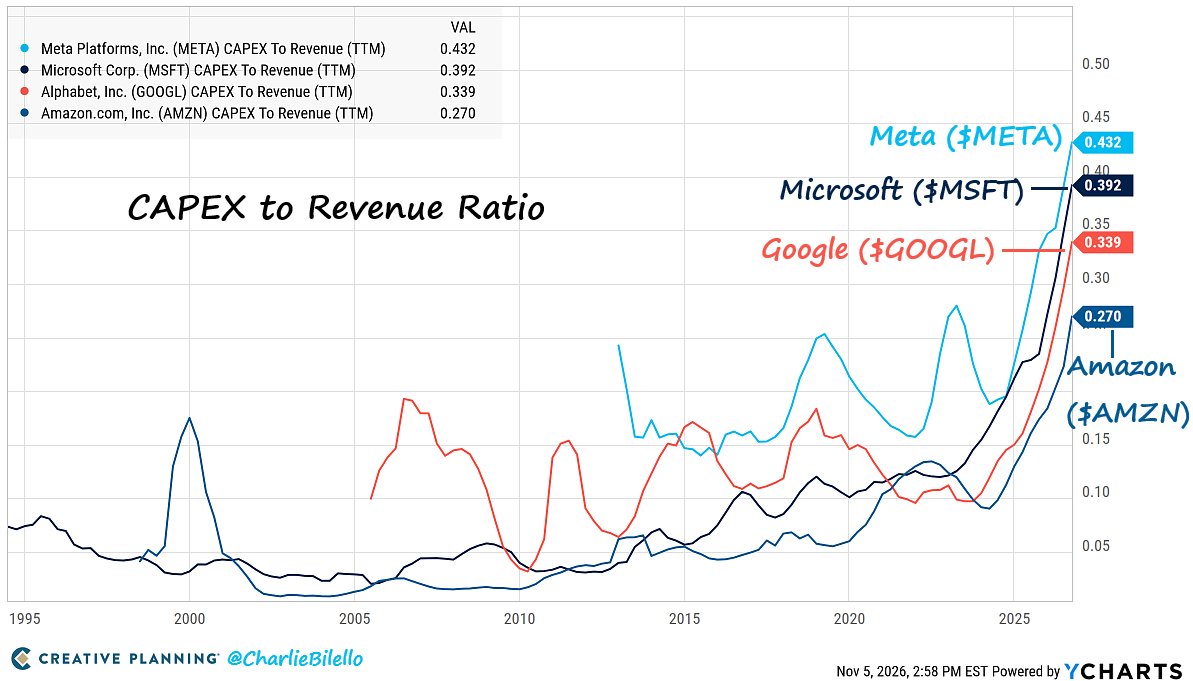
CapEx-to-revenue ratio (TTM) for Meta, Microsoft, Google, Amazon | Meta 0.432, Microsoft 0.392, Google 0.339, Amazon 0.270, all at record highs
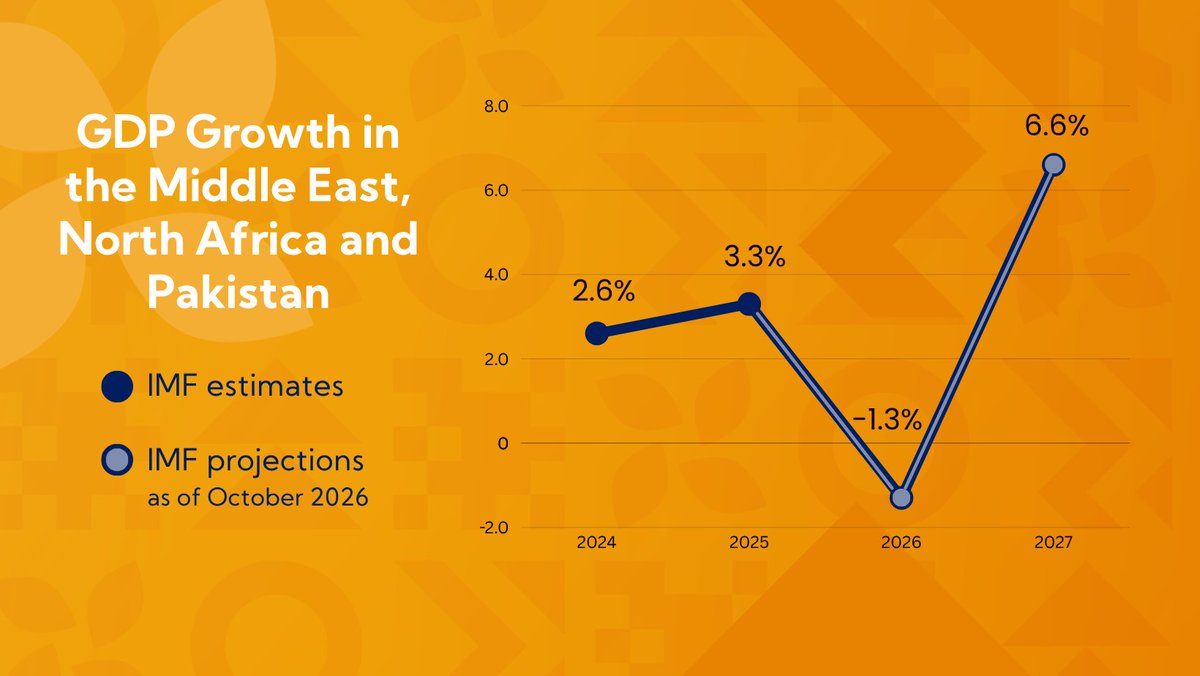
GDP growth for the Middle East, North Africa and Pakistan, IMF estimates and projections | -1.3% in 2026, rebounding to 6.6% in 2027 after 3.3% in 2025
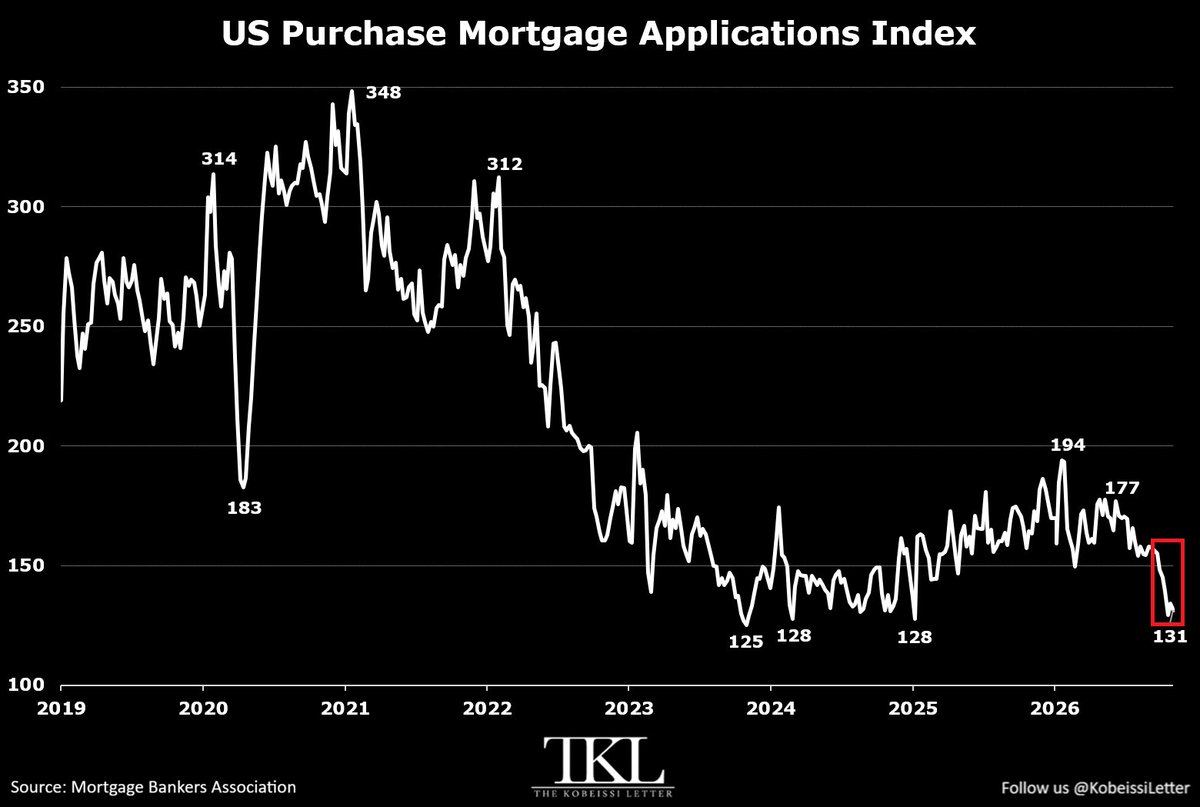
US purchase mortgage applications index (MBA) | Latest 131, near the 125-128 2023-24 trough and far below the 2021 peak of 348
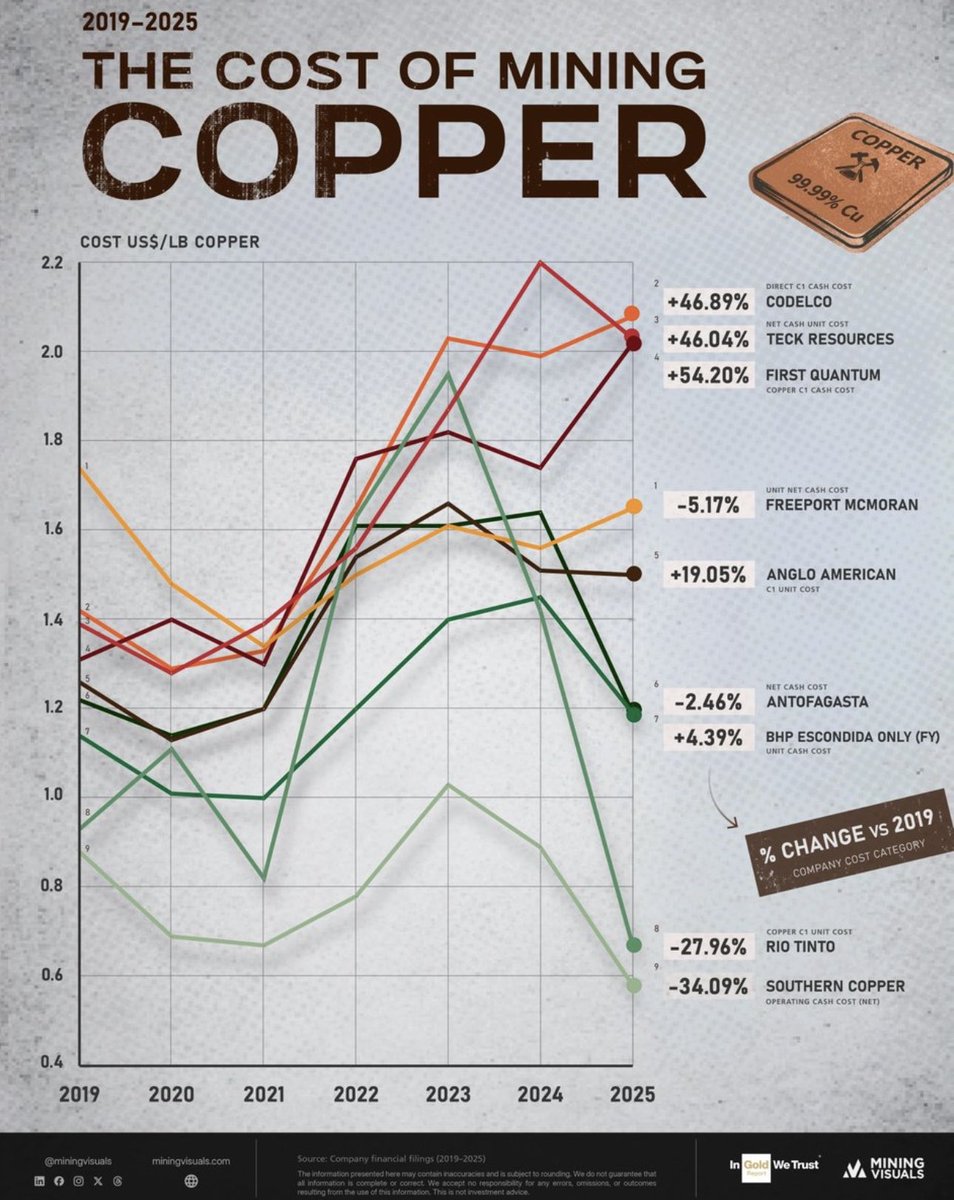
Per-pound copper mining cost by major producer, 2019–2025 (US$/lb) | 2025 vs 2019: First Quantum +54%, Codelco +47%, Southern Copper −34%
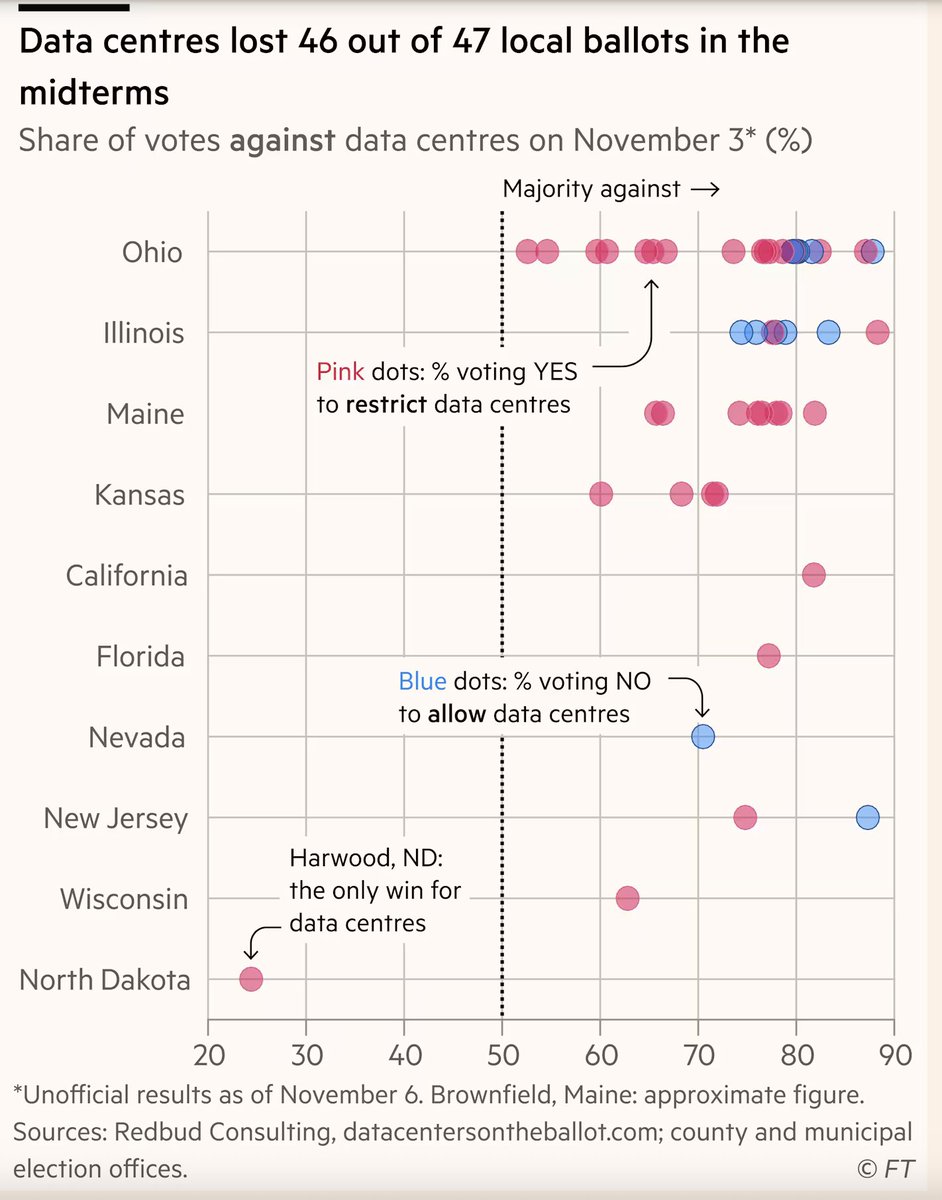
Share of votes against data centres on Nov 3, by state | 46 of 47 local ballots went against them, with Harwood, ND the only win
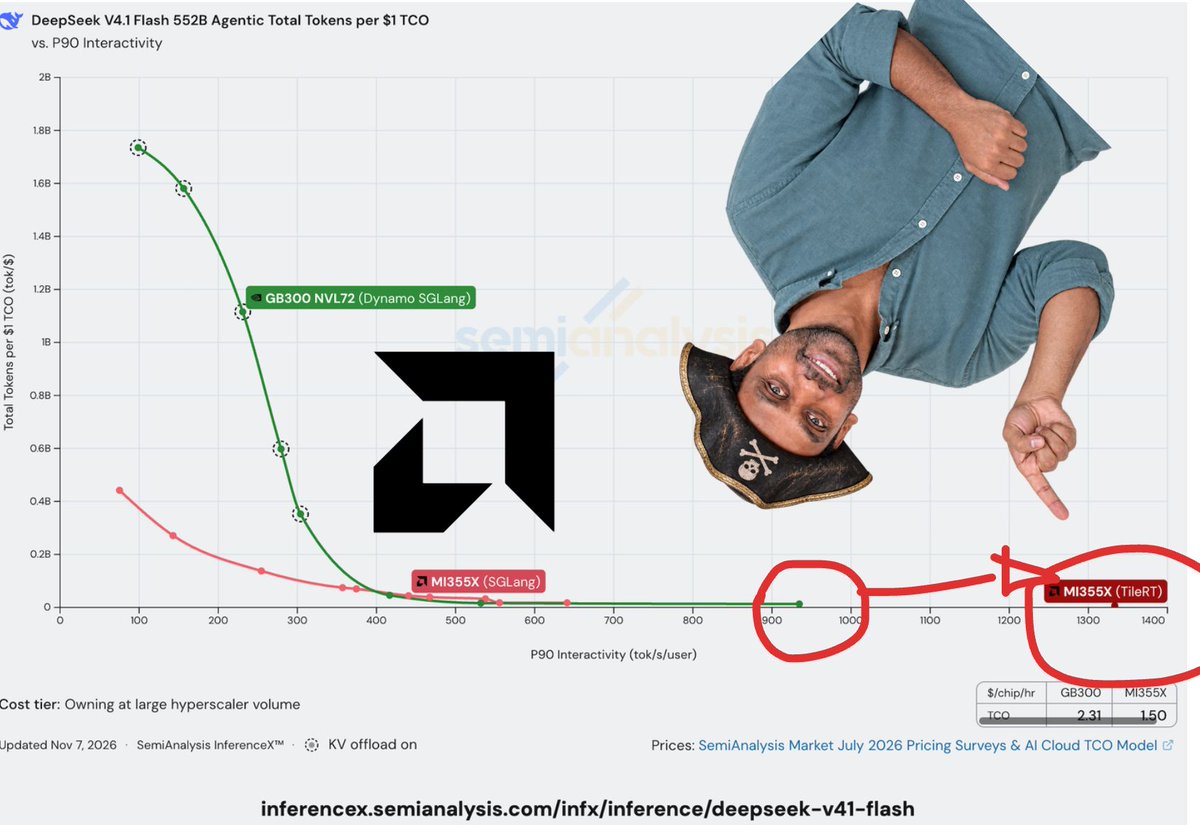
DeepSeek V4.1 total tokens per $1 TCO vs P90 interactivity | MI355X with TileRT extends to ~1,400 tok/s/user, beyond the GB300 curve
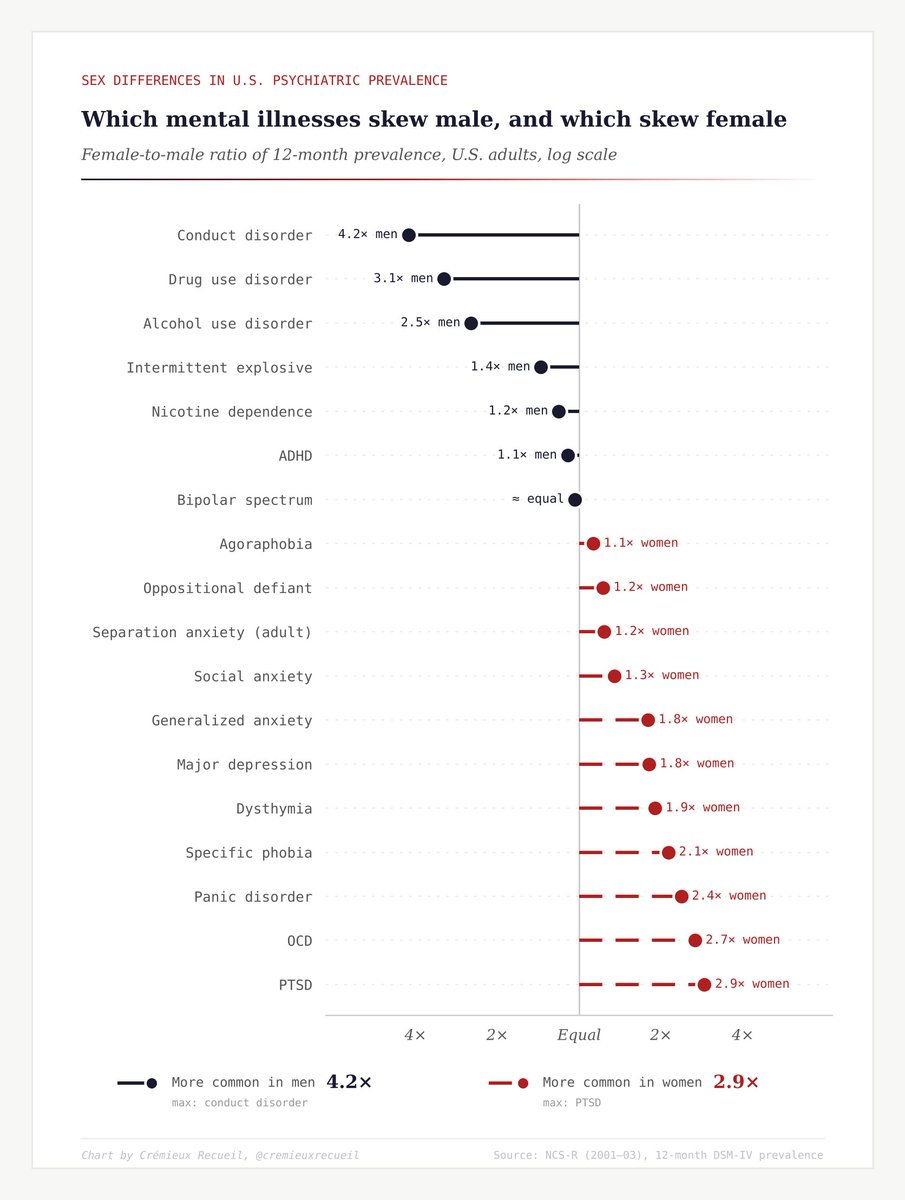
Female-to-male ratio of 12-month prevalence, U.S. adults, log scale | Conduct disorder most male-skewed at 4.2x; PTSD most female-skewed at 2.9x
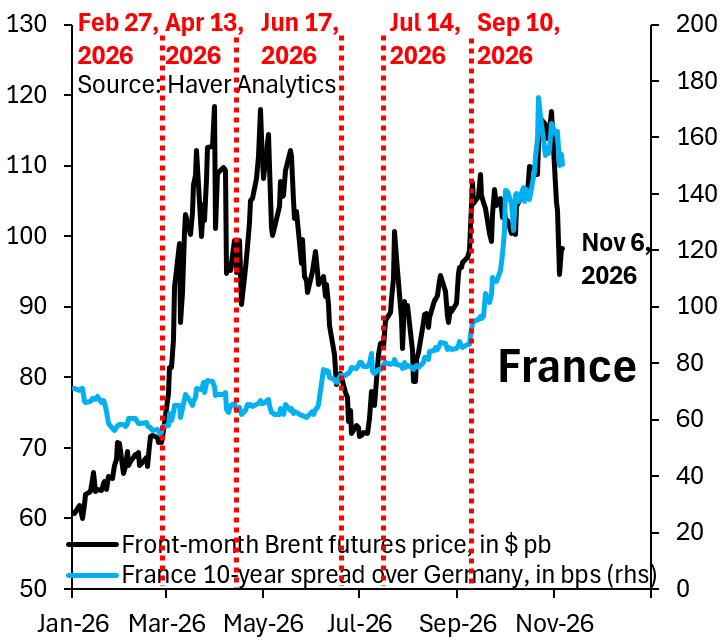
Front-month Brent vs France's 10-year spread over Germany, 2026 | After the Sep 10 pipeline attack, oil jumped and the spread widened from ~60bps to ~170bps
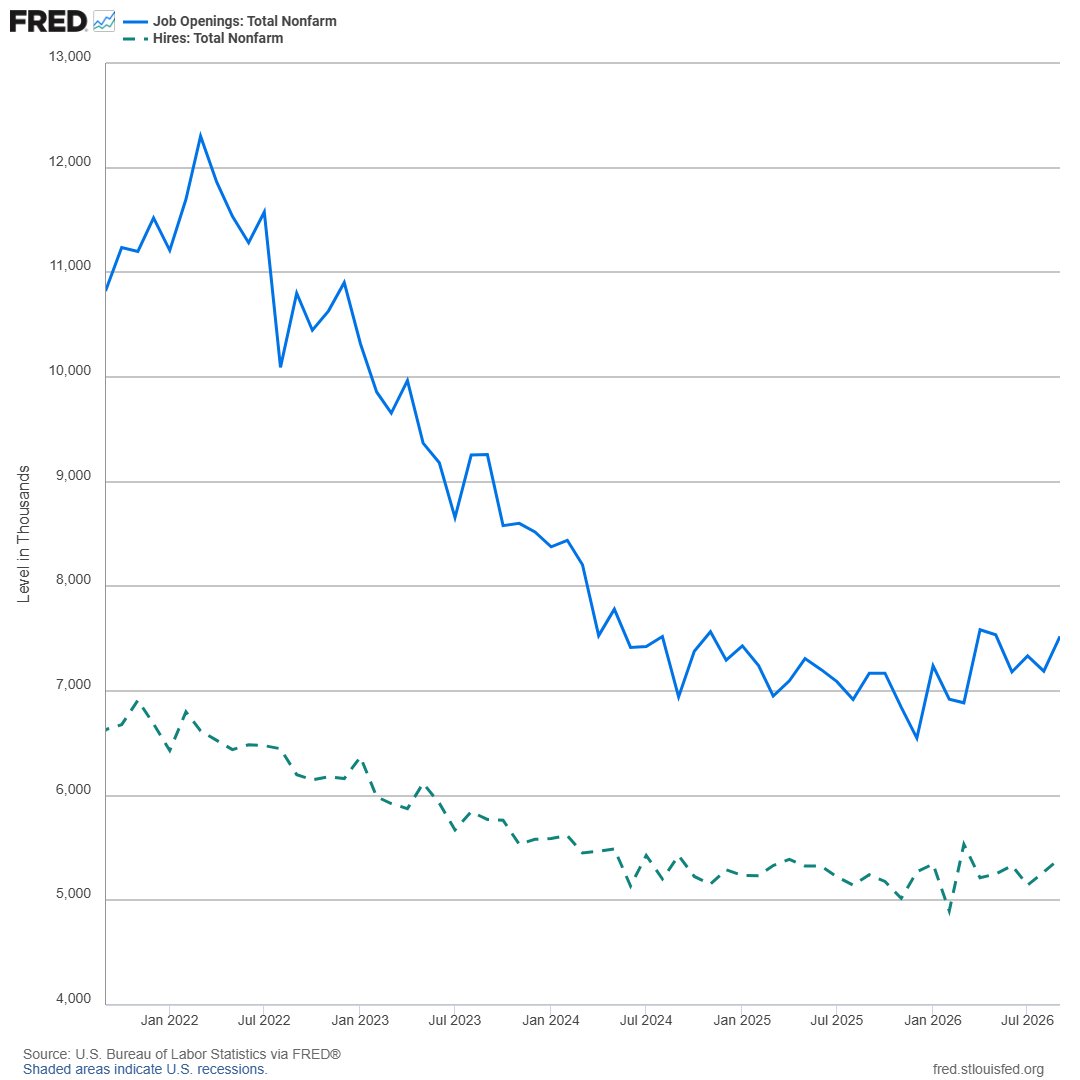
US nonfarm job openings vs. hires (thousands, JOLTS) | Openings down from the 2022 peak of 12.3mn to ~7.5mn, with hires lingering near 5.4mn
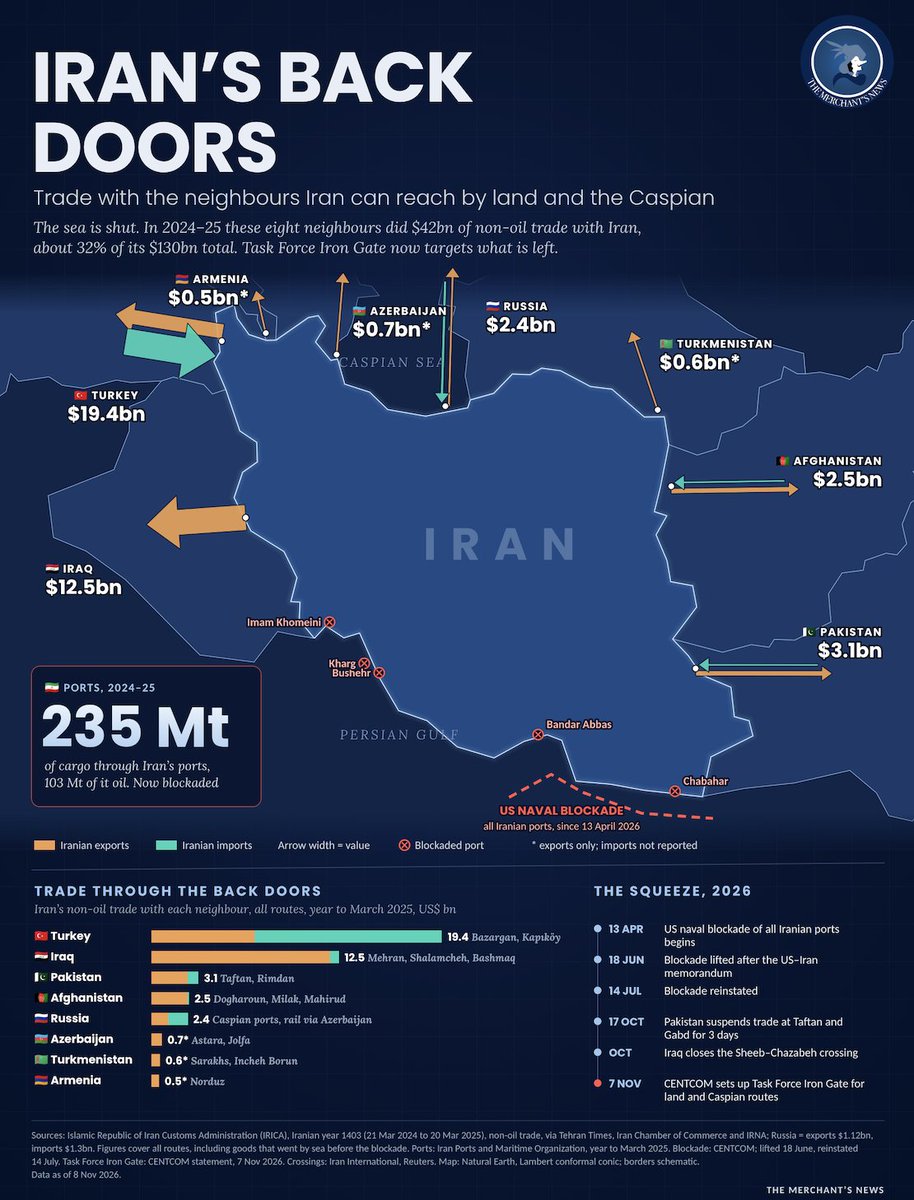
Iran's non-oil trade with its reachable neighbours, 2024-25 | About $42bn total, with Turkey ($19.4bn) and Iraq ($12.5bn) three of every four dollars
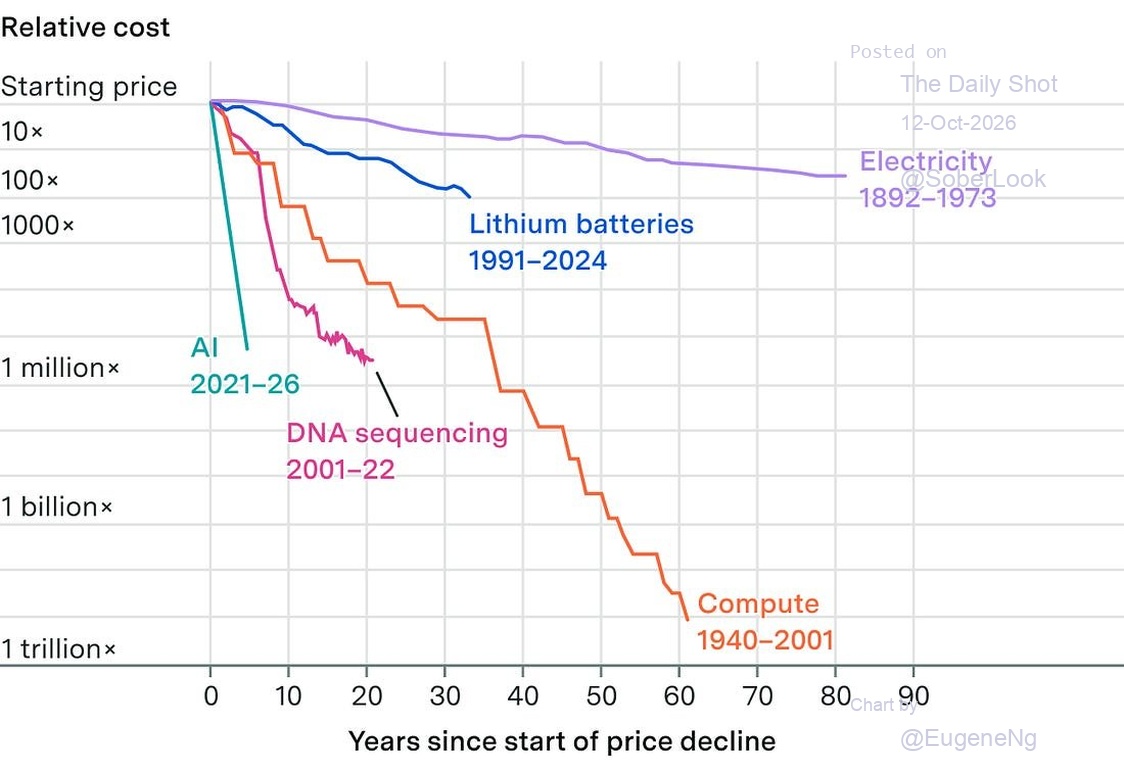
Relative cost decline vs years since onset, log scale | AI (2021-26) shows the steepest drop, about 1,000,000x in roughly five years
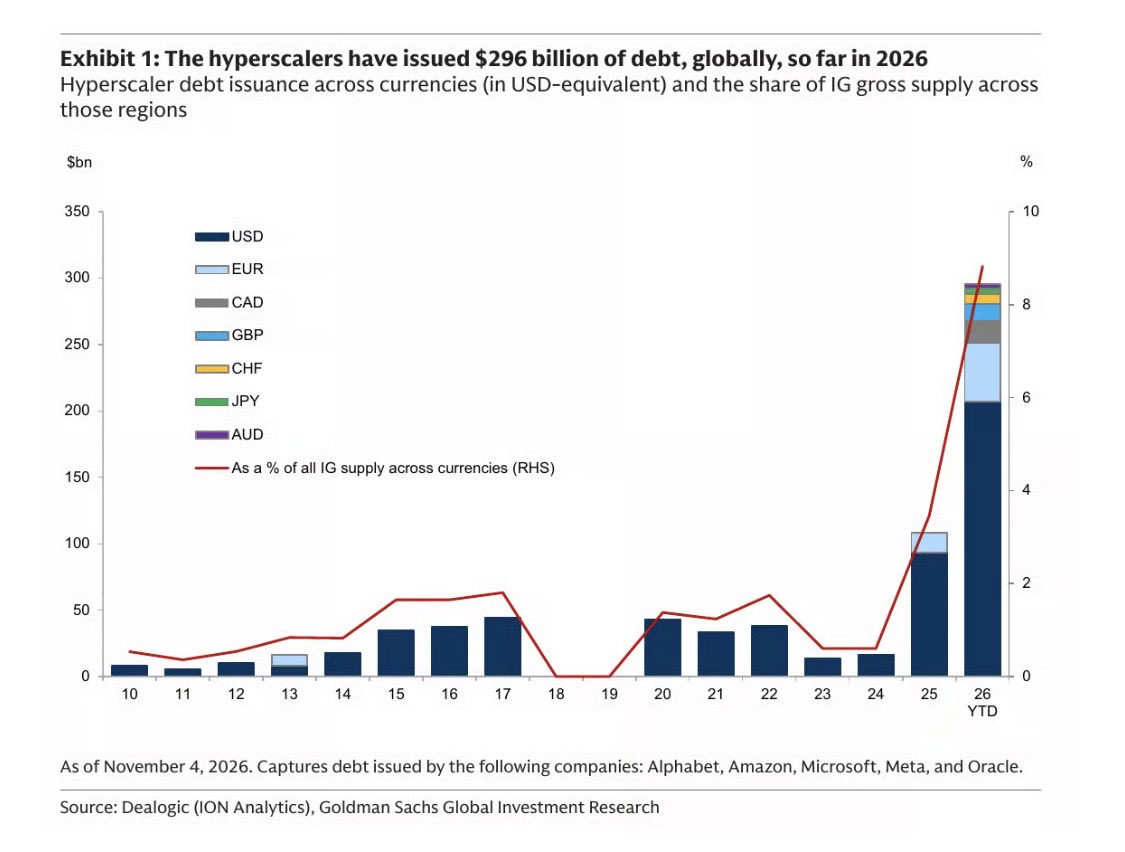
Hyperscaler debt issuance by currency ($bn) and share of IG gross supply | 2026 YTD at $296bn, a record, rising to ~9% of all IG supply
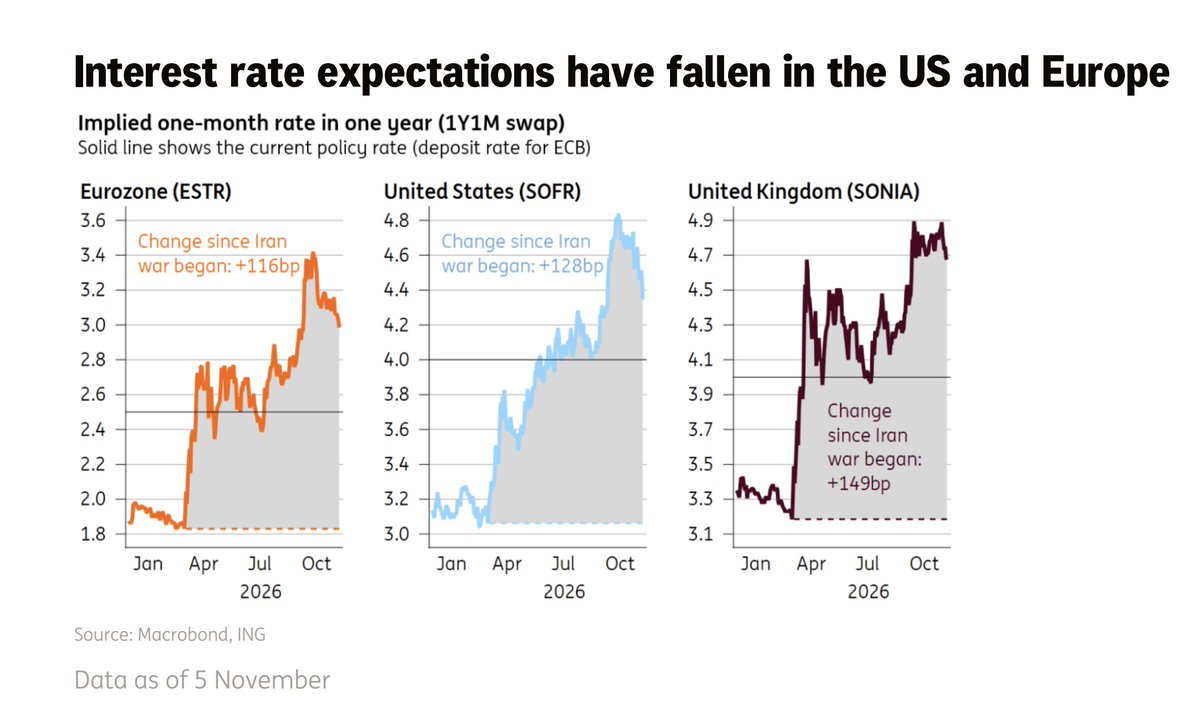
Implied one-month rate in one year (1Y1M swap) for the eurozone, US and UK | Still +116bp, +128bp and +149bp above pre-Iran-war levels, though easing from October highs
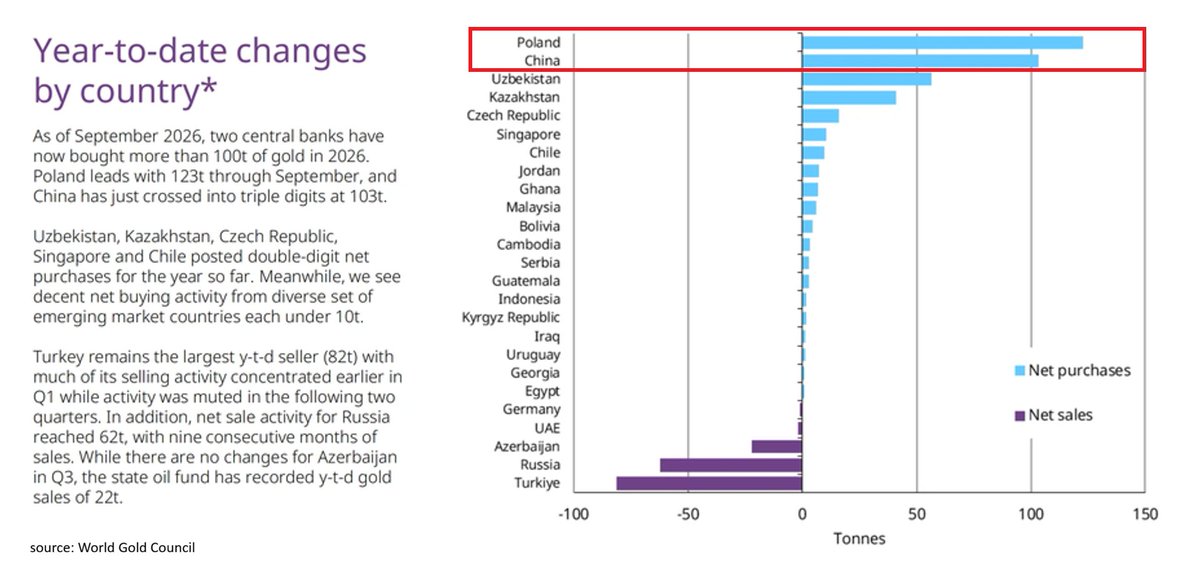
Central-bank gold net purchases/sales YTD 2026, tonnes | Poland +123t and China +103t lead buying; Turkey the largest net seller at -82t through September
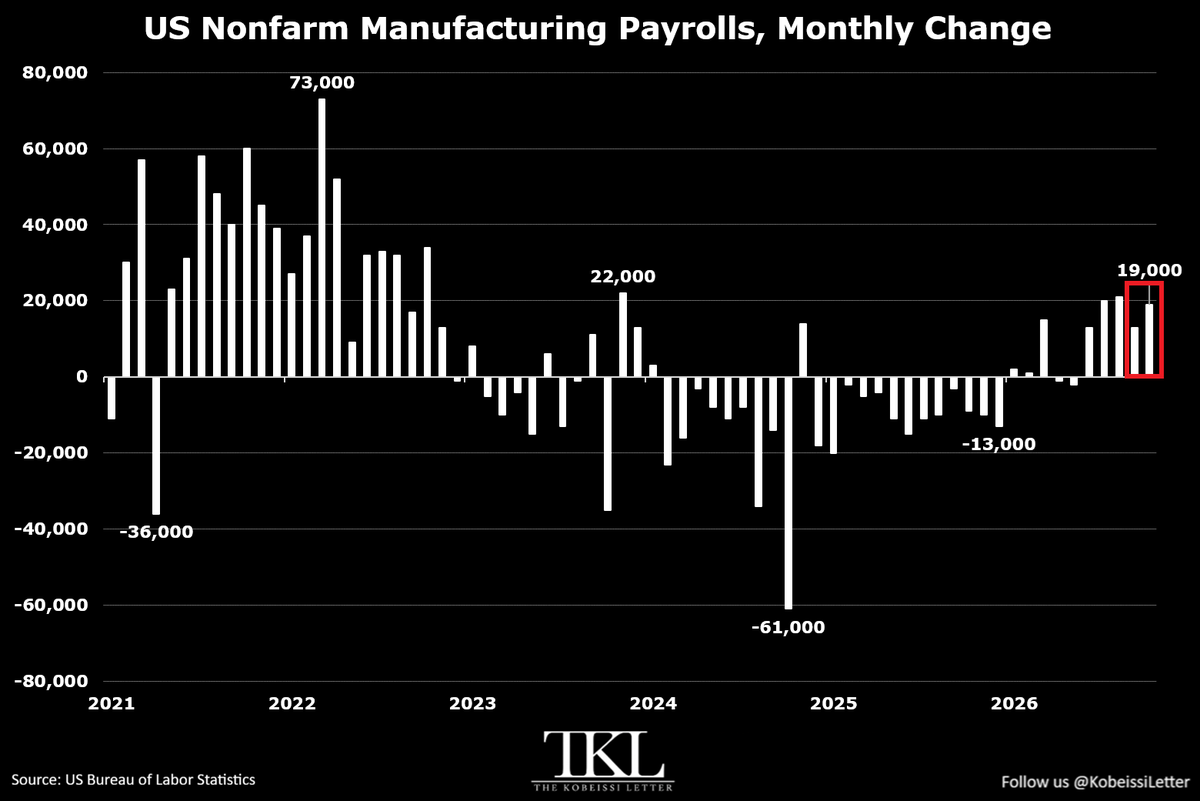
US nonfarm manufacturing payrolls, monthly change, 2021-2026 | +19,000 in October, a 5th consecutive gain and the longest streak since 2022, versus a -61,000 monthly drop in 2024
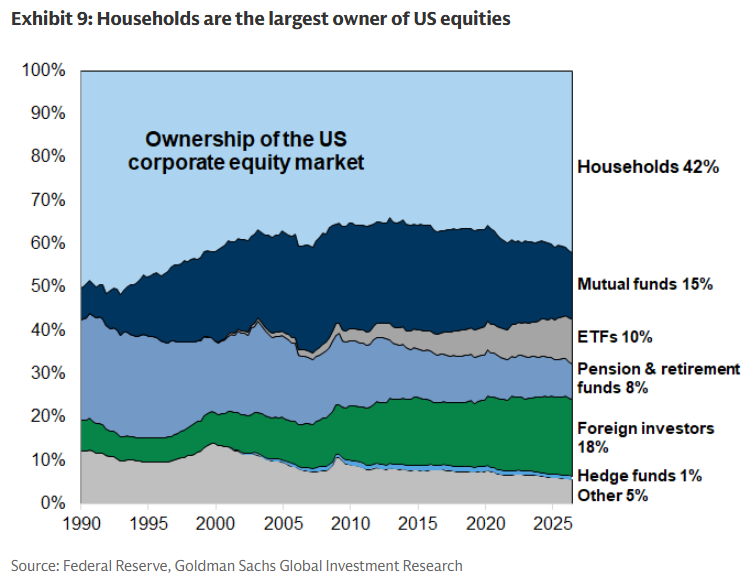
Ownership of the US corporate equity market, 1990-2026 | Households 42%, foreign investors 18%, mutual funds 15%, ETFs 10%
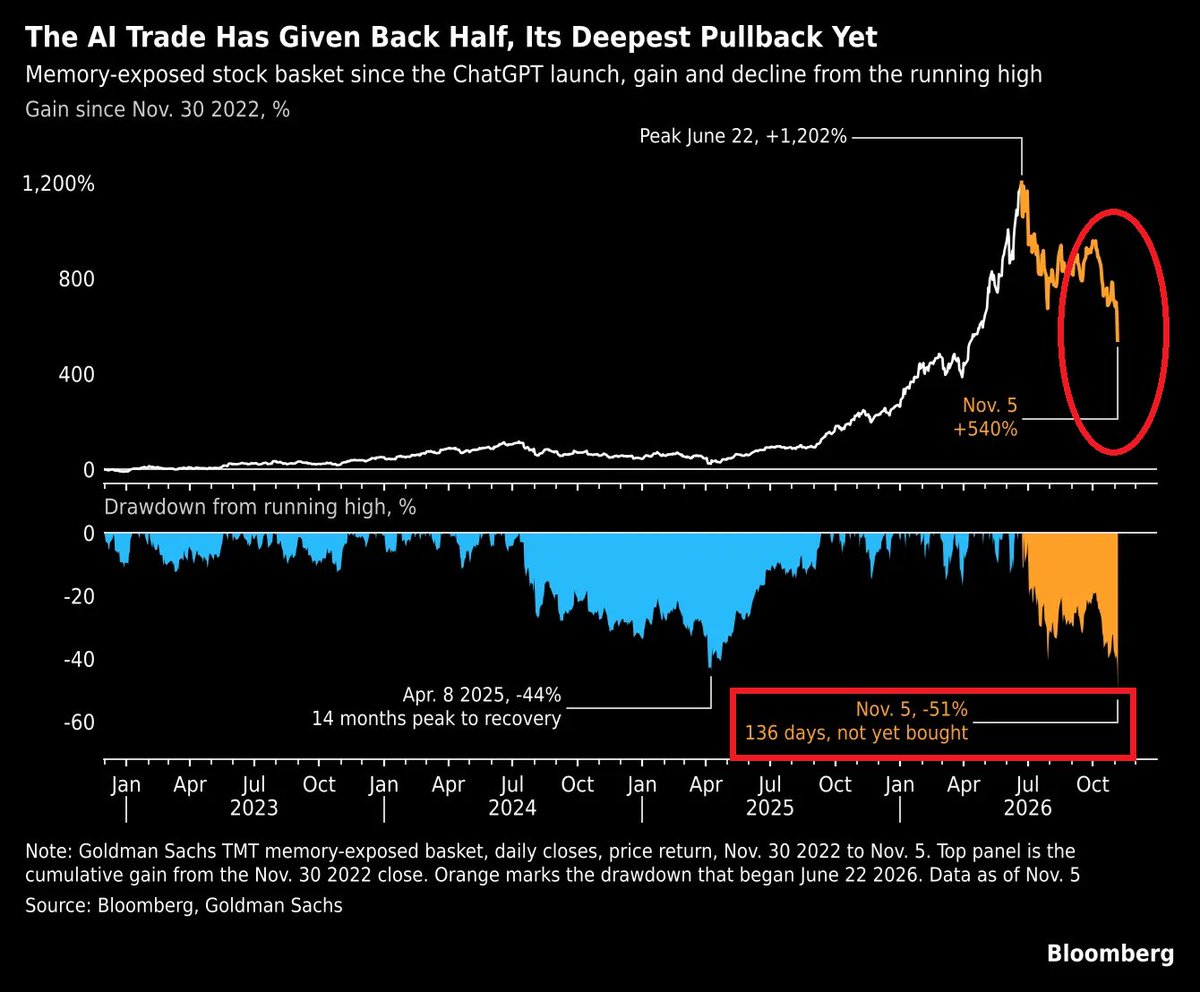
Goldman memory-exposed basket, cumulative gain and drawdown since Nov 30, 2022 | Peaked +1,202% on Jun 22; now +540%, down 51% from the high
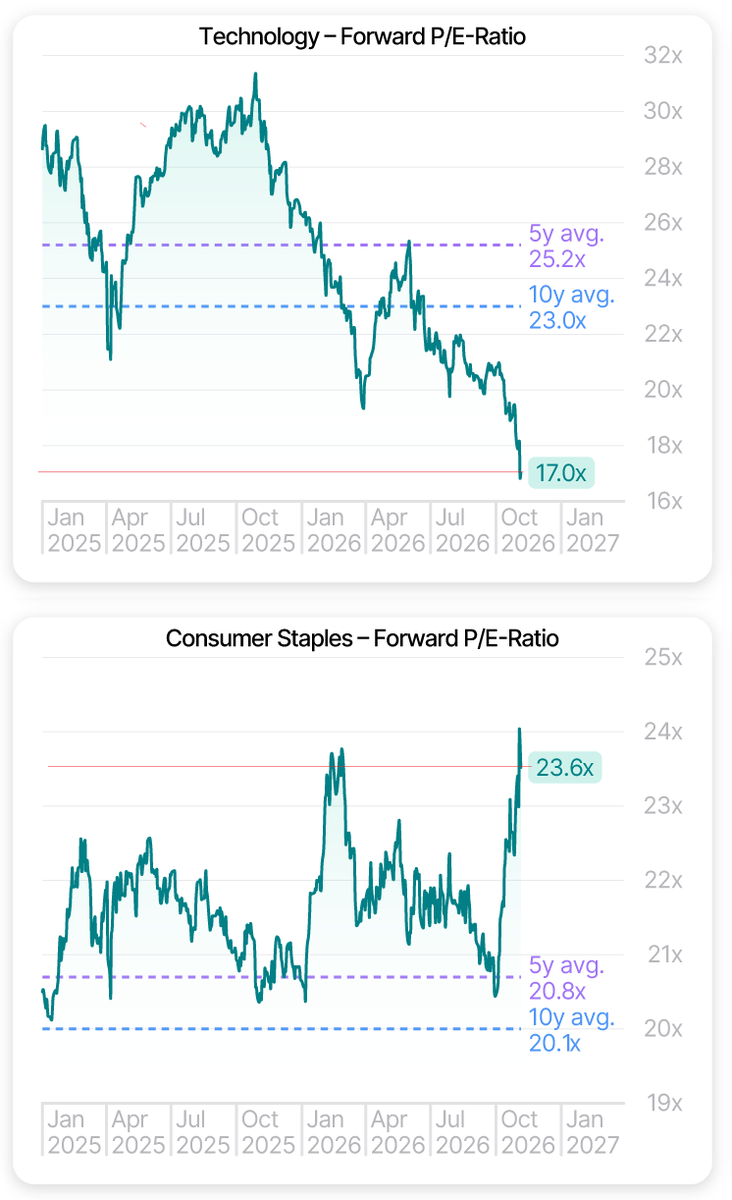
Forward P/E for Technology vs Consumer Staples | Tech at 17.0x sits below its 23.0x 10-year average while Staples at 23.6x runs above its own
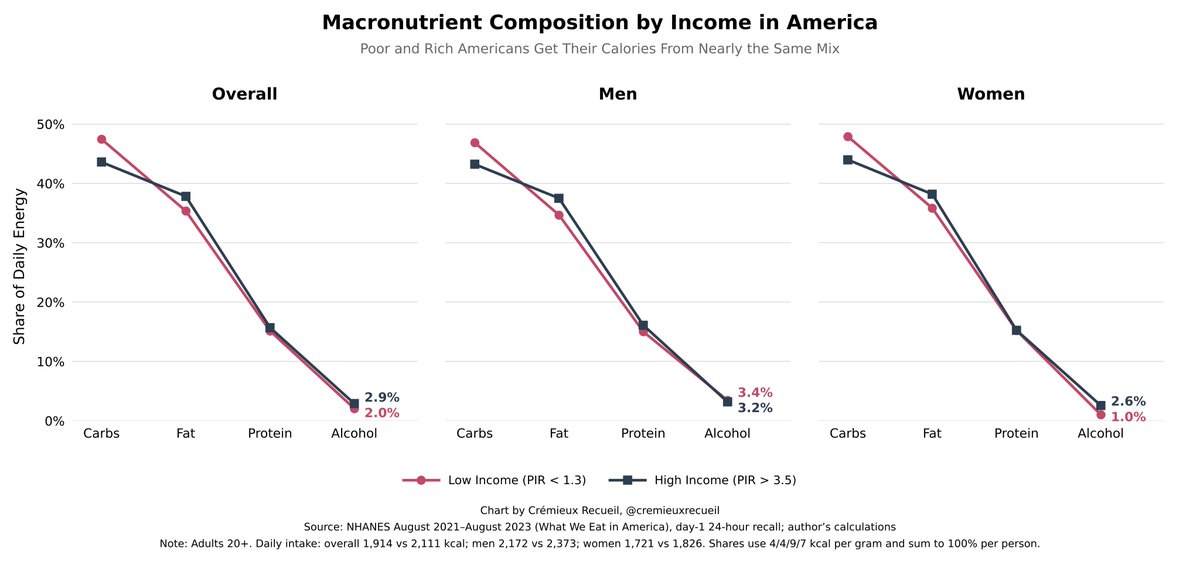
Share of daily energy from carbs, fat, protein and alcohol, US low- vs high-income adults | The macronutrient split is nearly identical across income, differing only slightly on alcohol
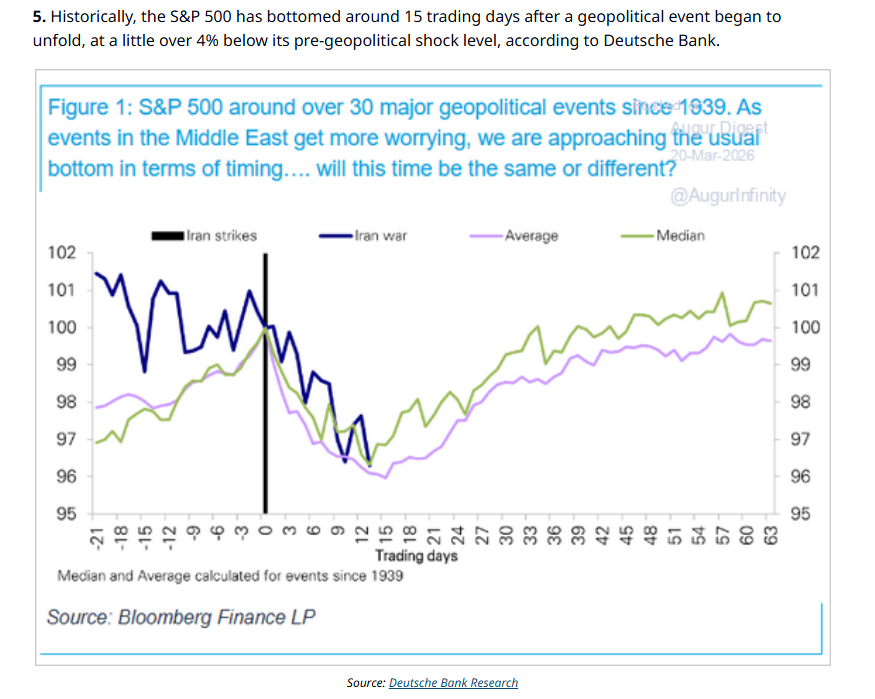
S&P 500 indexed around 30+ geopolitical events since 1939 | Median troughs near day 15, about 4% below the pre-shock level
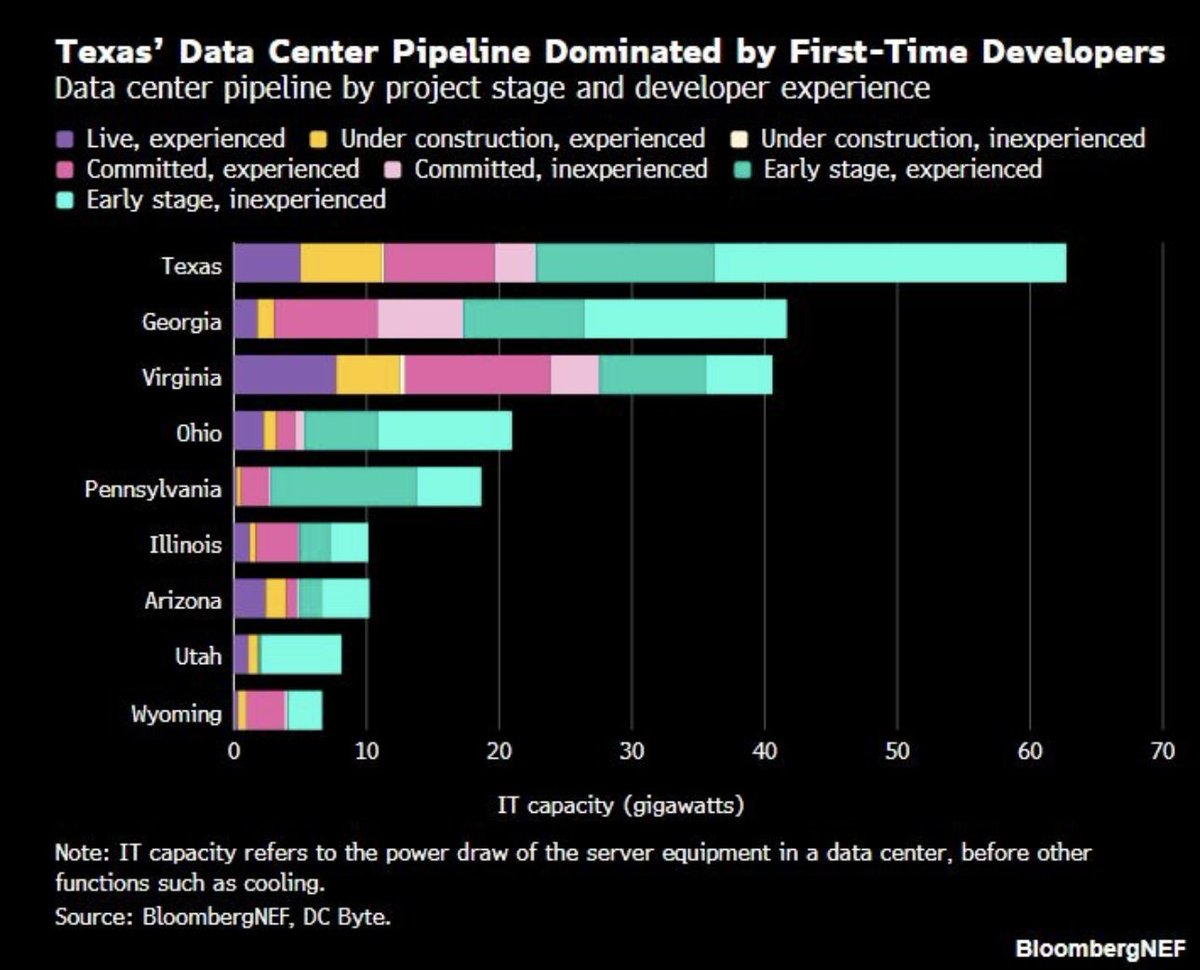
Data center pipeline IT capacity by state (GW), by project stage and developer experience | Texas tops the list near 63 GW, ahead of Georgia and Virginia around 41-42 GW
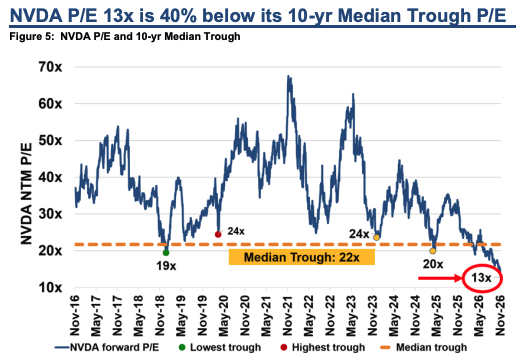
Nvidia NTM P/E vs its 10-year median trough (22x) | Now 13x, about 40% below the median trough; the 2020 trough was 20x
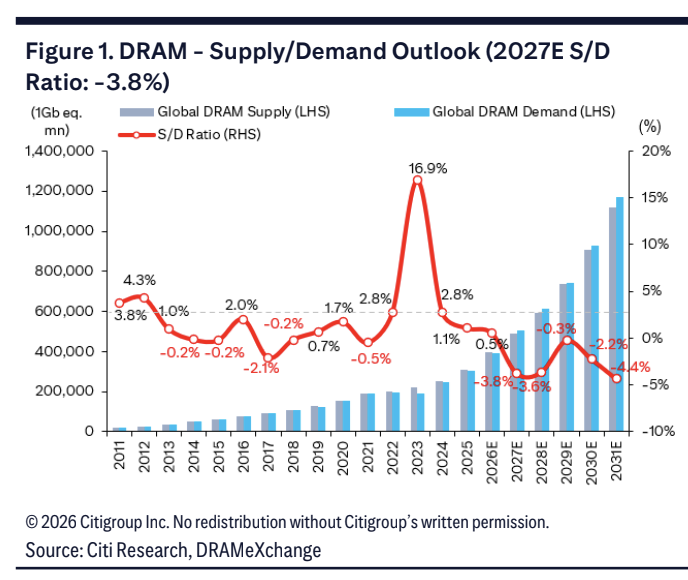
Global DRAM supply, demand and S/D ratio, 2011-2031E | S/D ratio -3.8% in 2027E and -3.6% in 2028E, swinging from +0.5% in 2026E
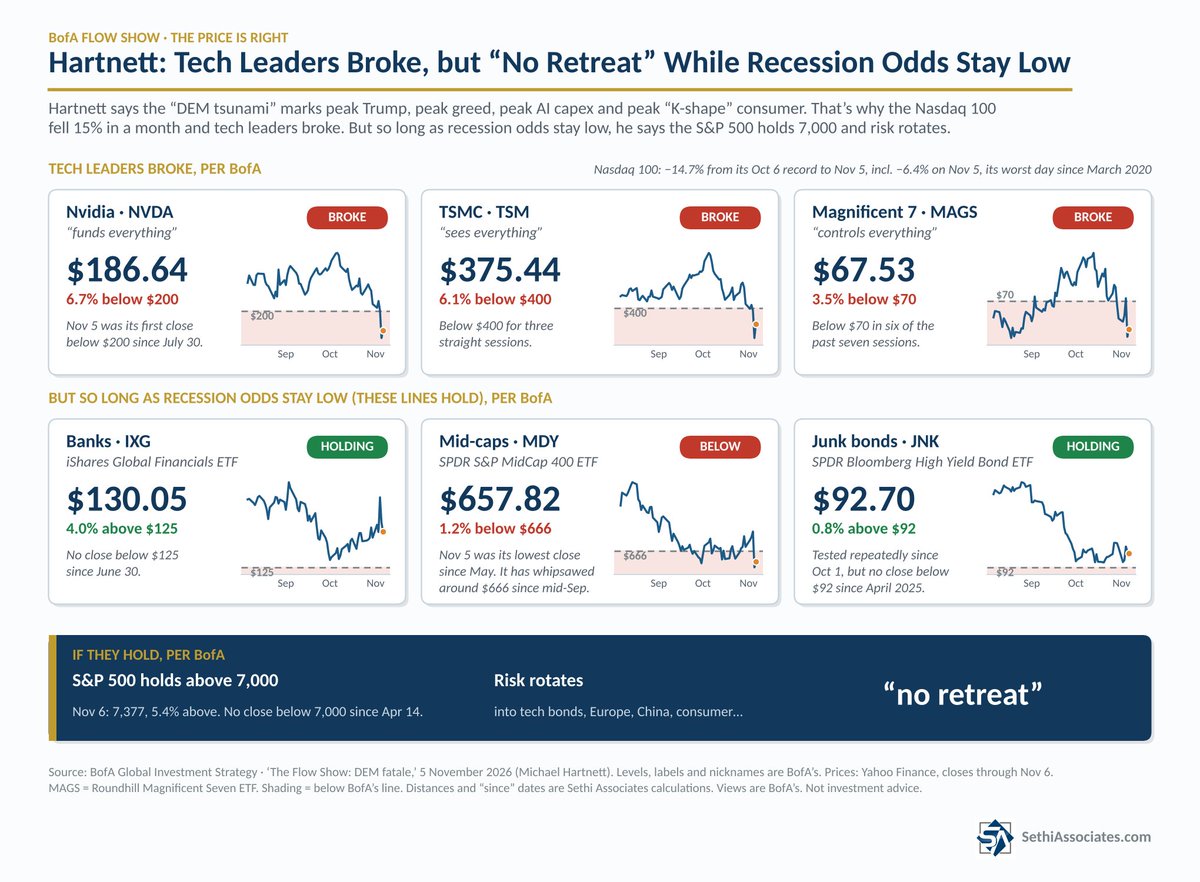
BofA six-panel scorecard of leaders and risk assets | NVDA under $200, TSM under $400, MAGS under $70; S&P 500 at 7,377 on Nov 6, still above 7,000
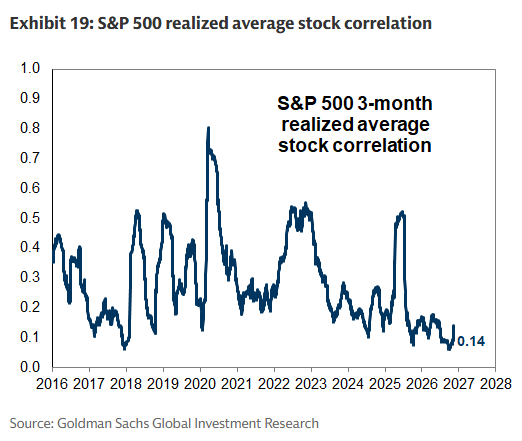
S&P 500 3-month realized average stock correlation, since 2016 | Now down to 0.14, far below the ~0.8 spike of 2020, pointing to high single-stock dispersion
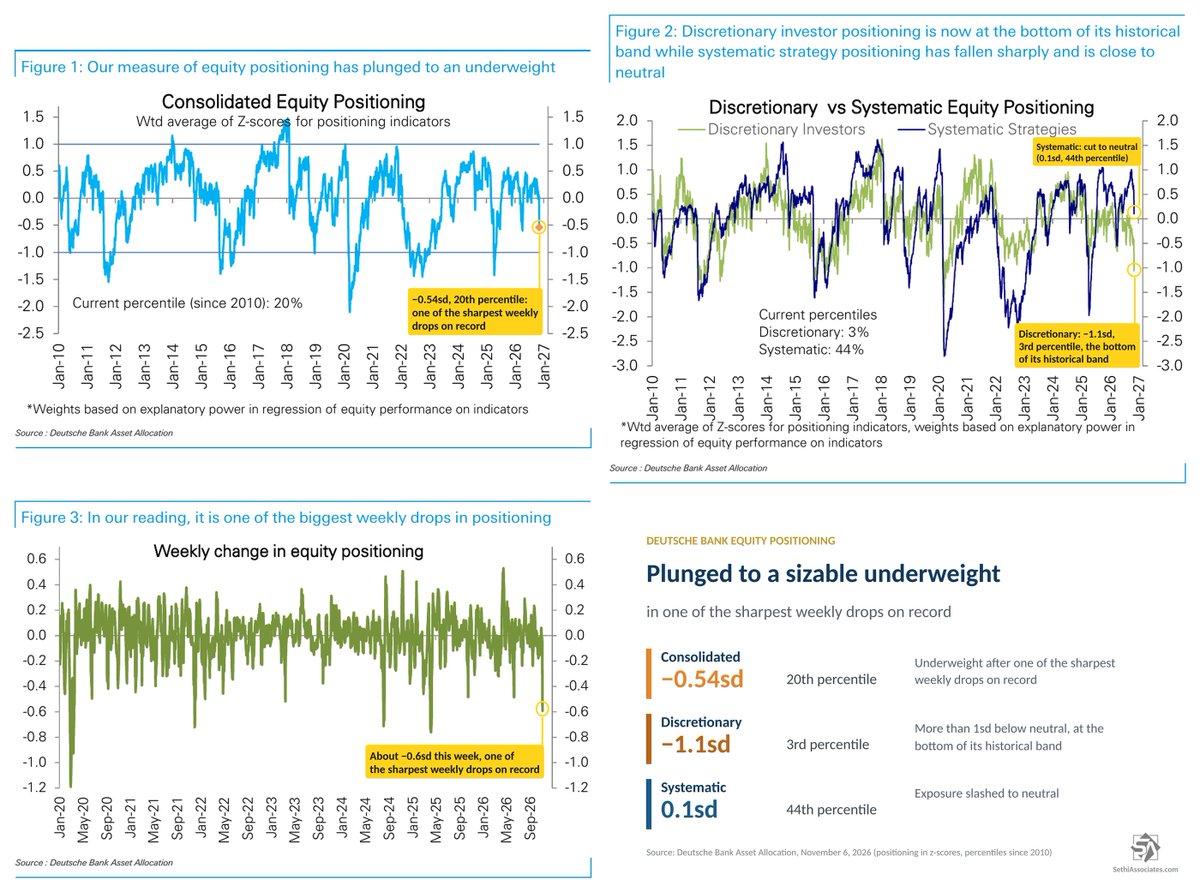
Deutsche Bank equity positioning: consolidated/discretionary/systematic (z-scores, percentiles) | Consolidated -0.54sd (20th pct), discretionary -1.1sd (3rd pct), at the bottom of its band
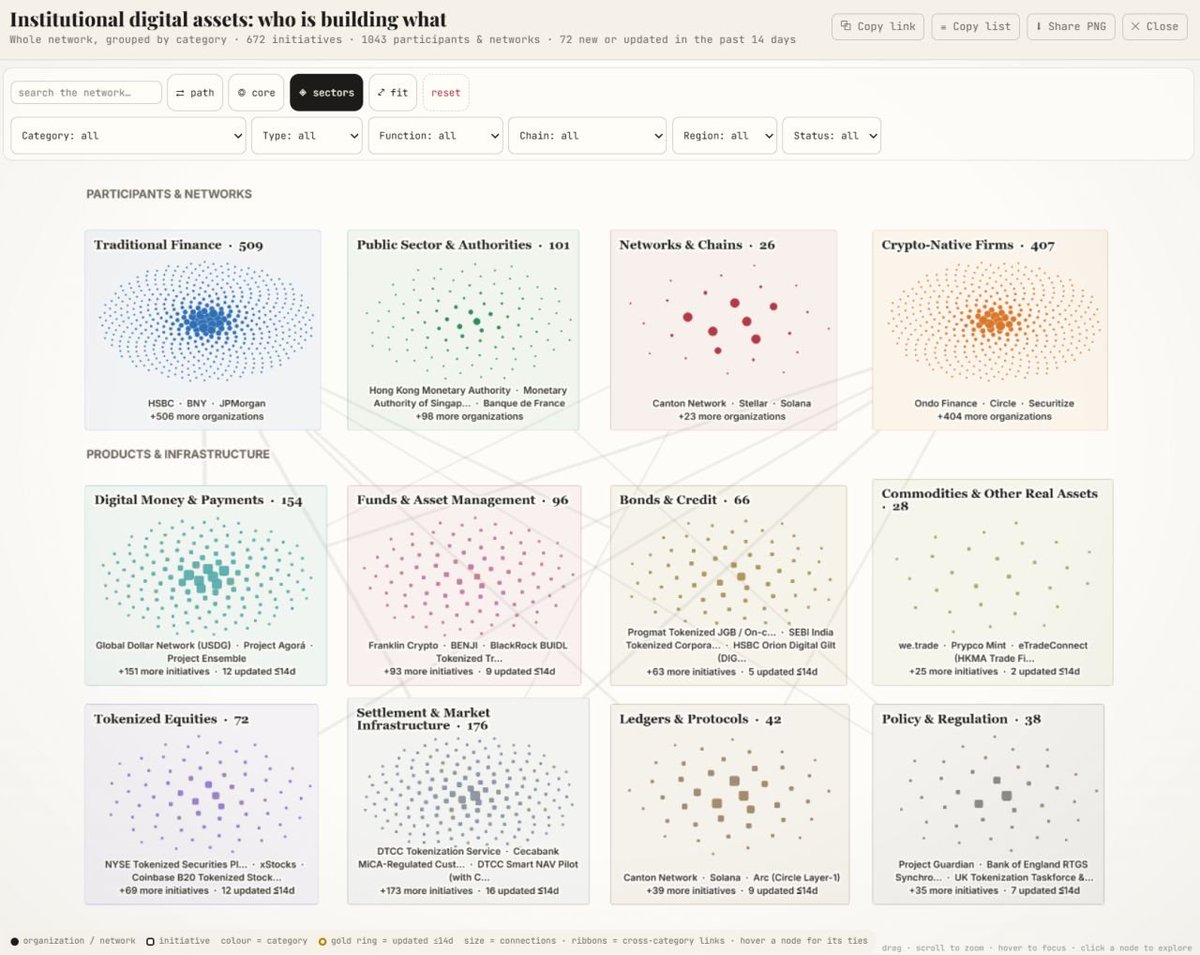
Institutional digital-asset network of 672 initiatives grouped by category | Traditional Finance 509 and crypto-native 407 lead; settlement 176, digital money 154
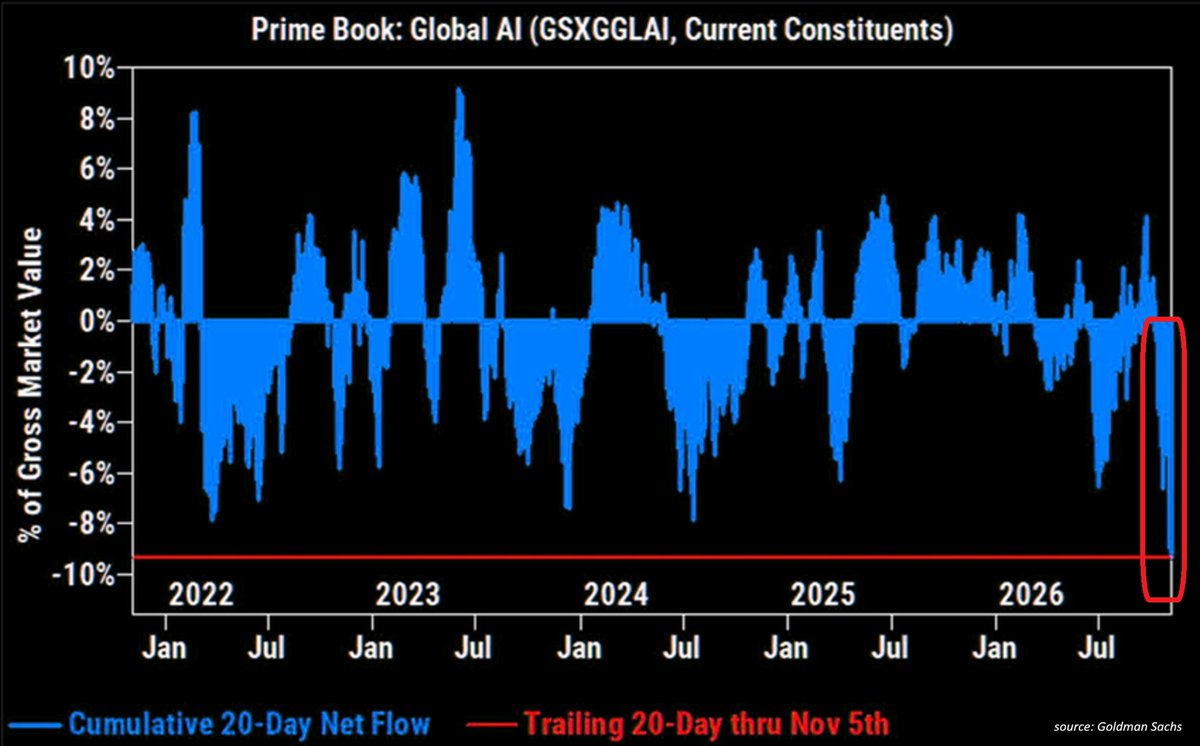
Goldman Prime Book global AI cumulative 20-day net flow (% of gross market value) | Trailing 20 days thru Nov 5 near -9.4%, the lowest on the chart
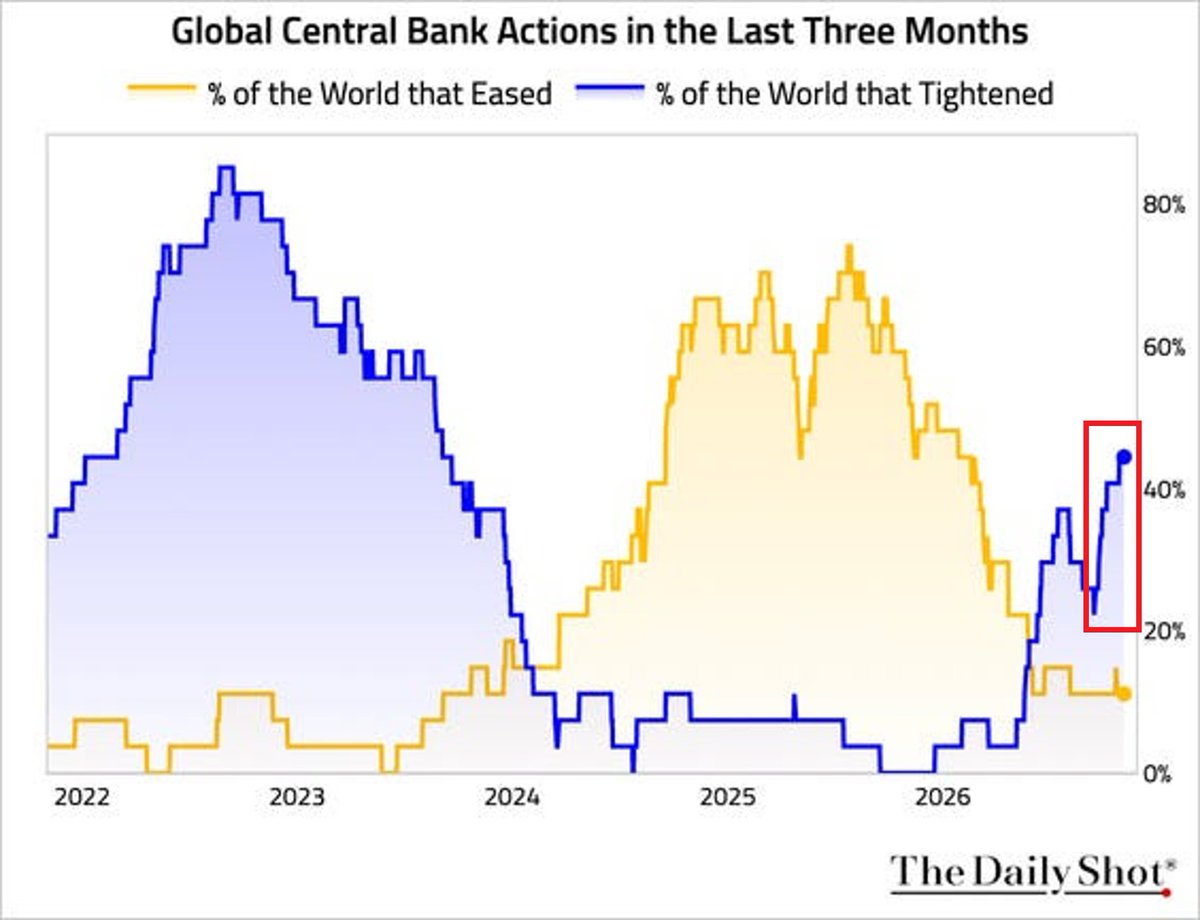
Share of global central banks tightening vs easing over the trailing three months | The tightening share has climbed to about 45%, the highest in three years