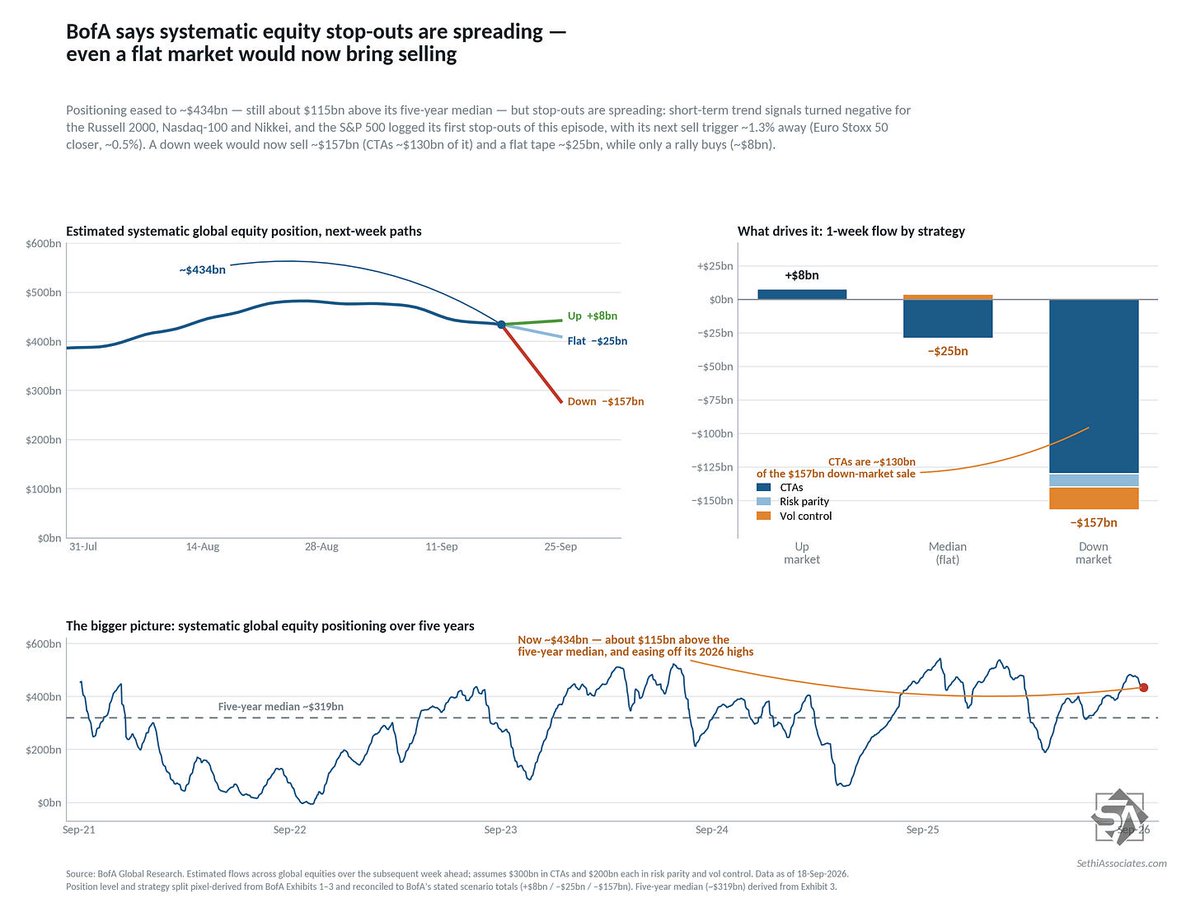
BofA Sees Systematic Equity Positioning at $434bn; a Down Week Sells $157bn
BofA systematic global equity positioning and scenario flows | ~$434bn now, a down week sells ~$157bn (CTAs ~$130bn)
English financial charts and market context published in 2026-09, page 33.
BofA systematic global equity positioning and scenario flows | ~$434bn now, a down week sells ~$157bn (CTAs ~$130bn)
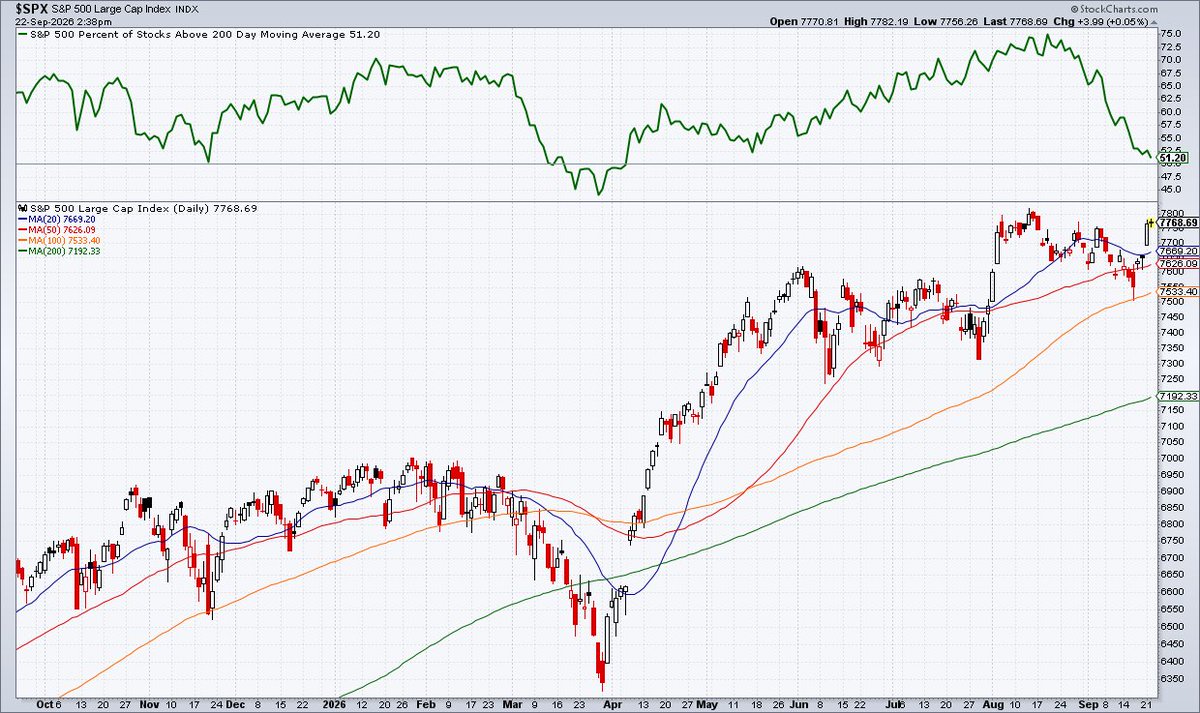
S&P 500 index and share of stocks above their 200-day moving average | Index at 7,768 but breadth at just 51%, the fewest since early April
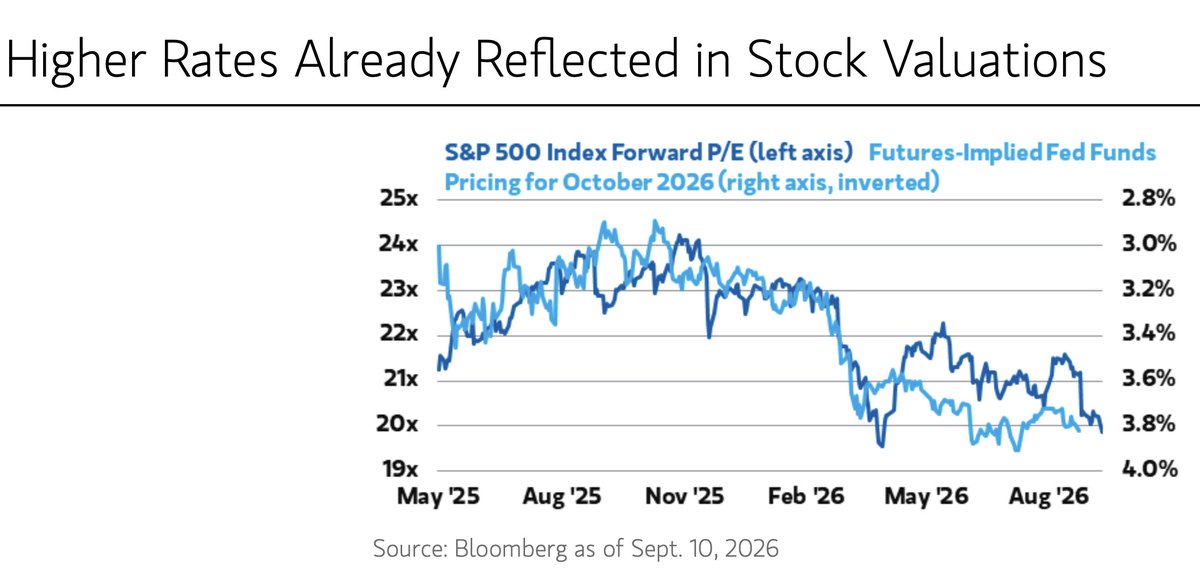
S&P 500 forward P/E versus futures-implied October 2026 Fed funds (inverted) | Forward P/E down from 24x to about 20x as implied rates rise toward 3.8%
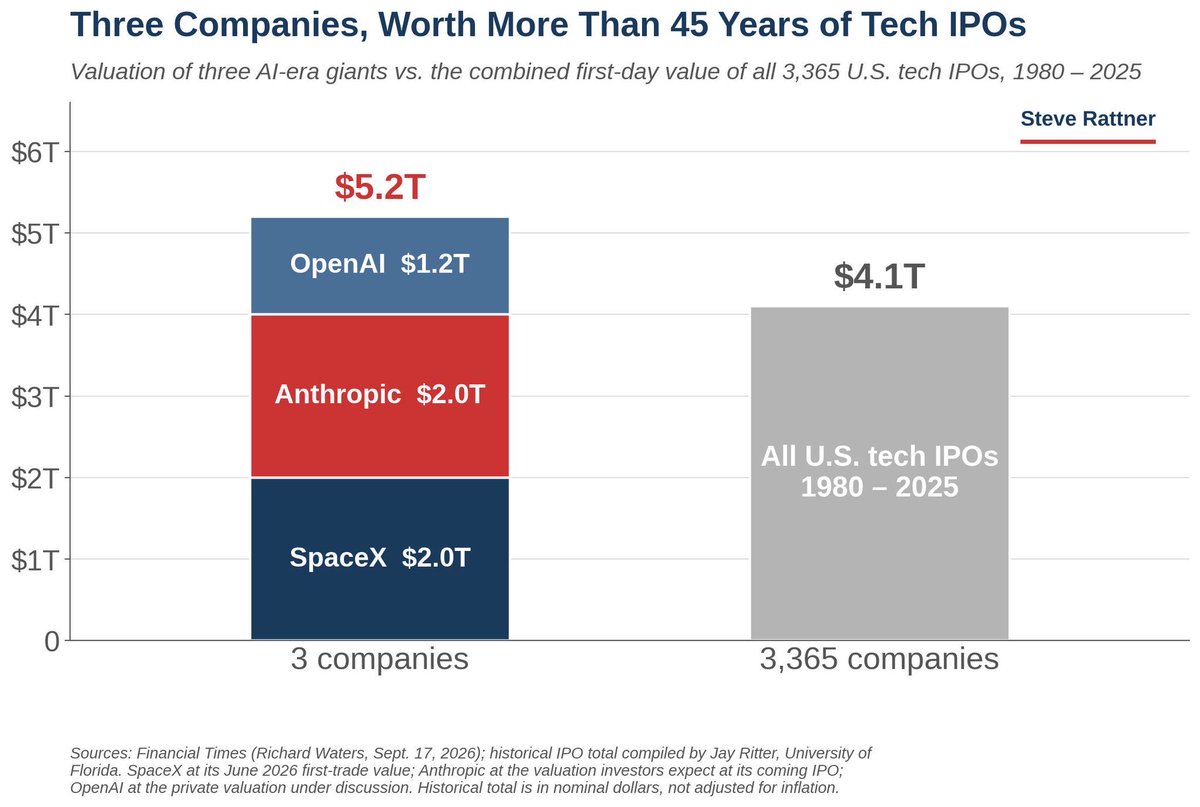
Valuation of three AI-era giants versus the combined first-day value of all US tech IPOs, 1980-2025 | The three total $5.2T against $4.1T for 3,365 IPOs
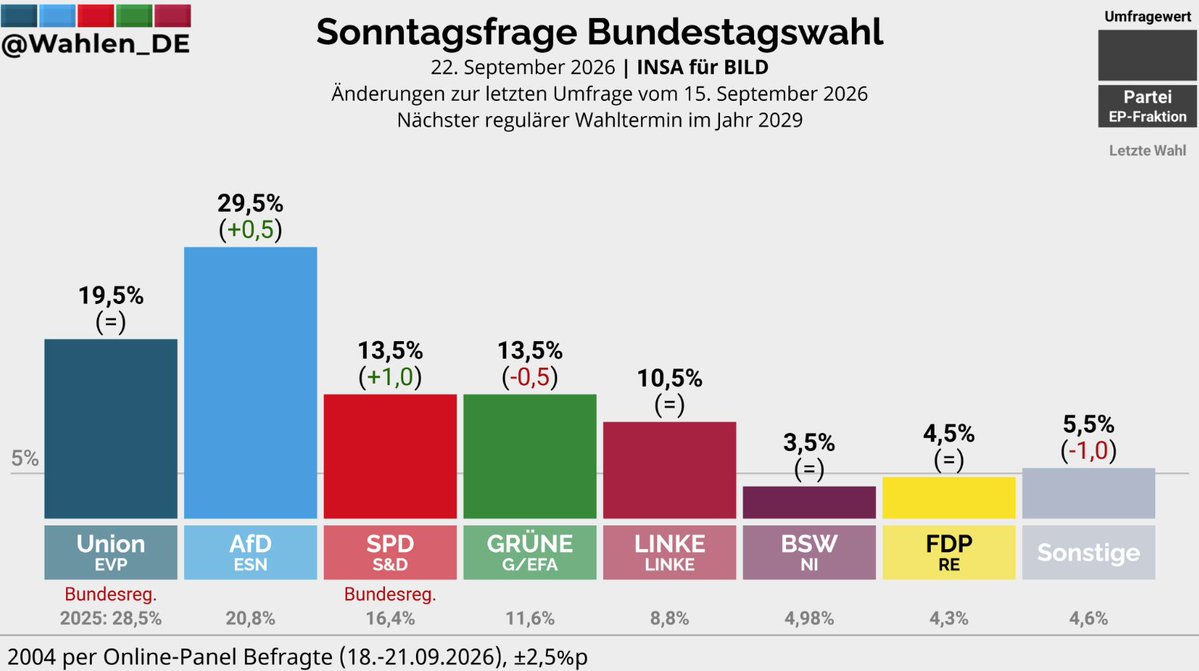
INSA Bundestag voting-intention poll, Sept 22 | AfD at 29.5% ahead of the Union at 19.5%, with SPD tied with the Greens at 13.5%
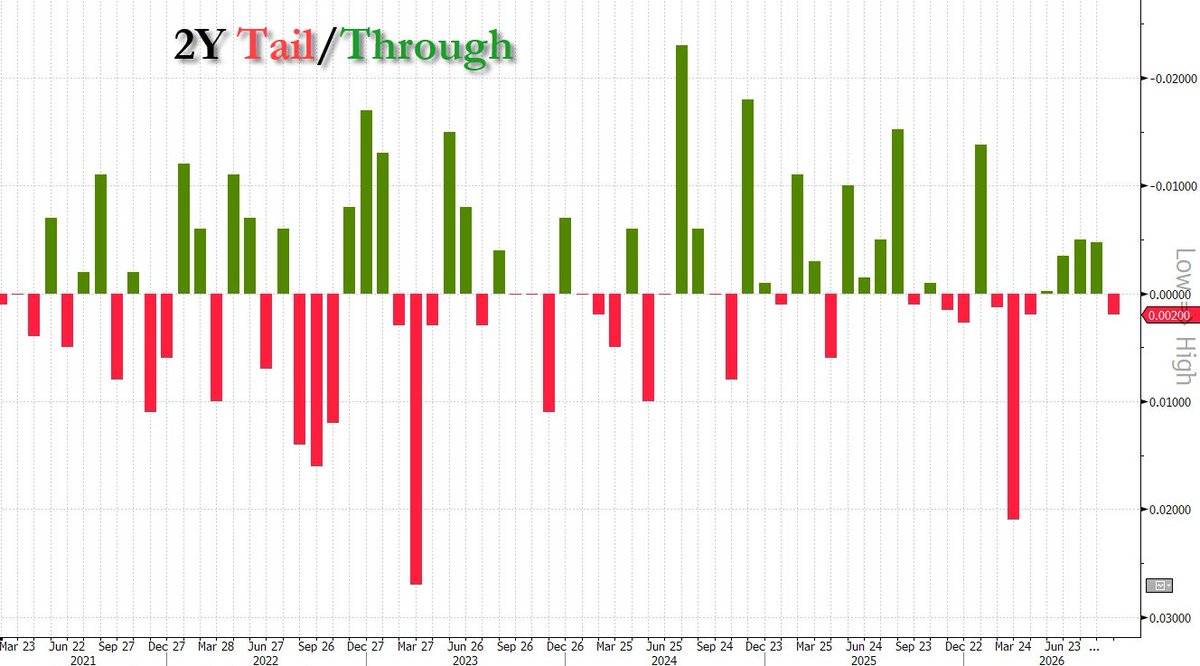
2-year Treasury auction tail/through by auction | Latest a 0.2bp tail at a 4.787% high yield, a mild result
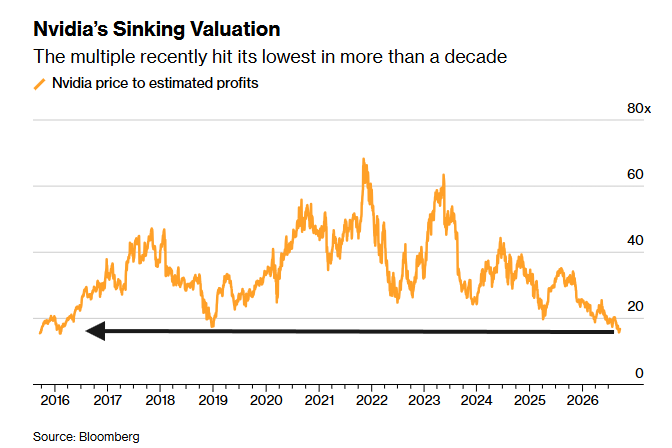
Nvidia price to estimated profits | Now about 16x, the least since 2016 and far below the ~65x peak of November 2021
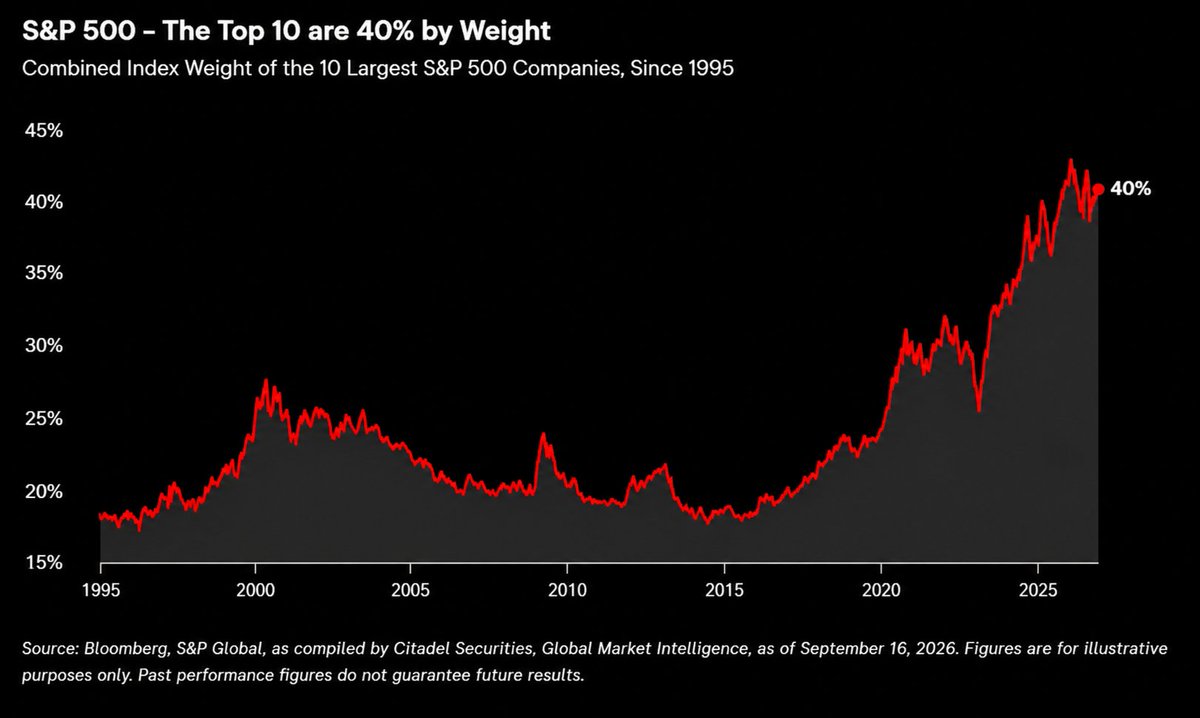
Combined weight of the 10 largest S&P 500 companies | Now 40%, above the ~27% dot-com peak
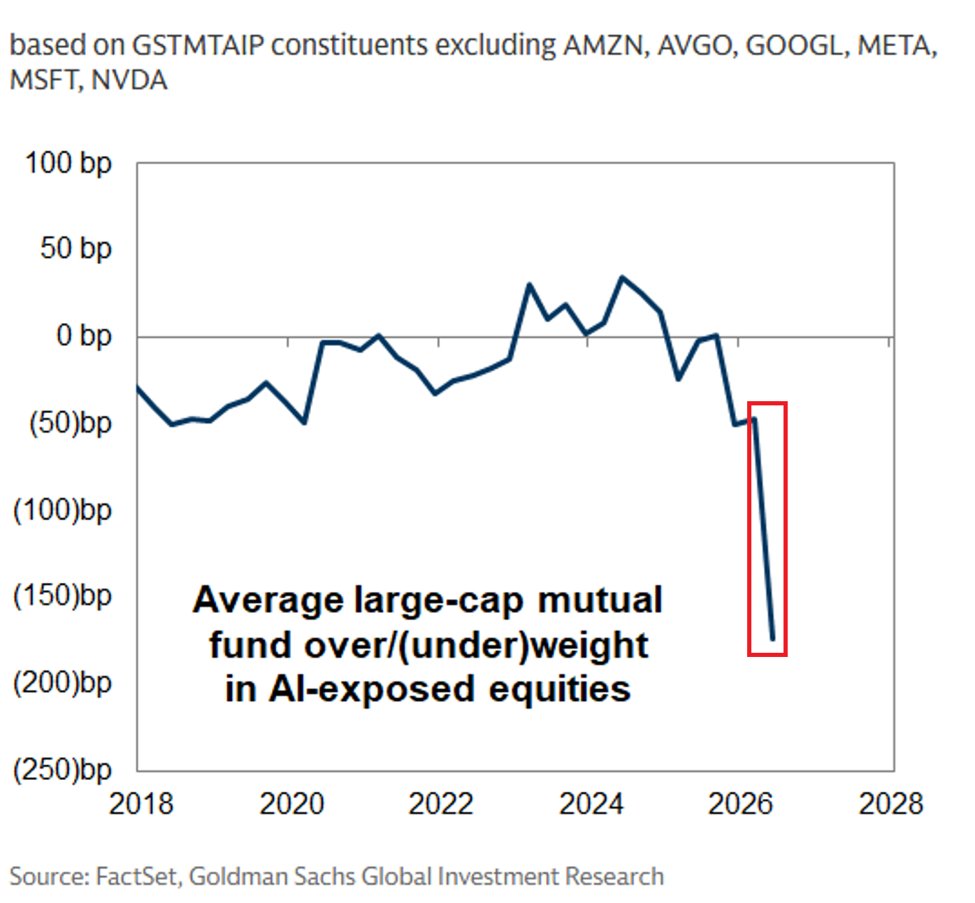
Average large-cap mutual fund over/underweight in AI-exposed equities | Now about 175bp underweight, the largest on record, versus a 40bp overweight in mid-2024
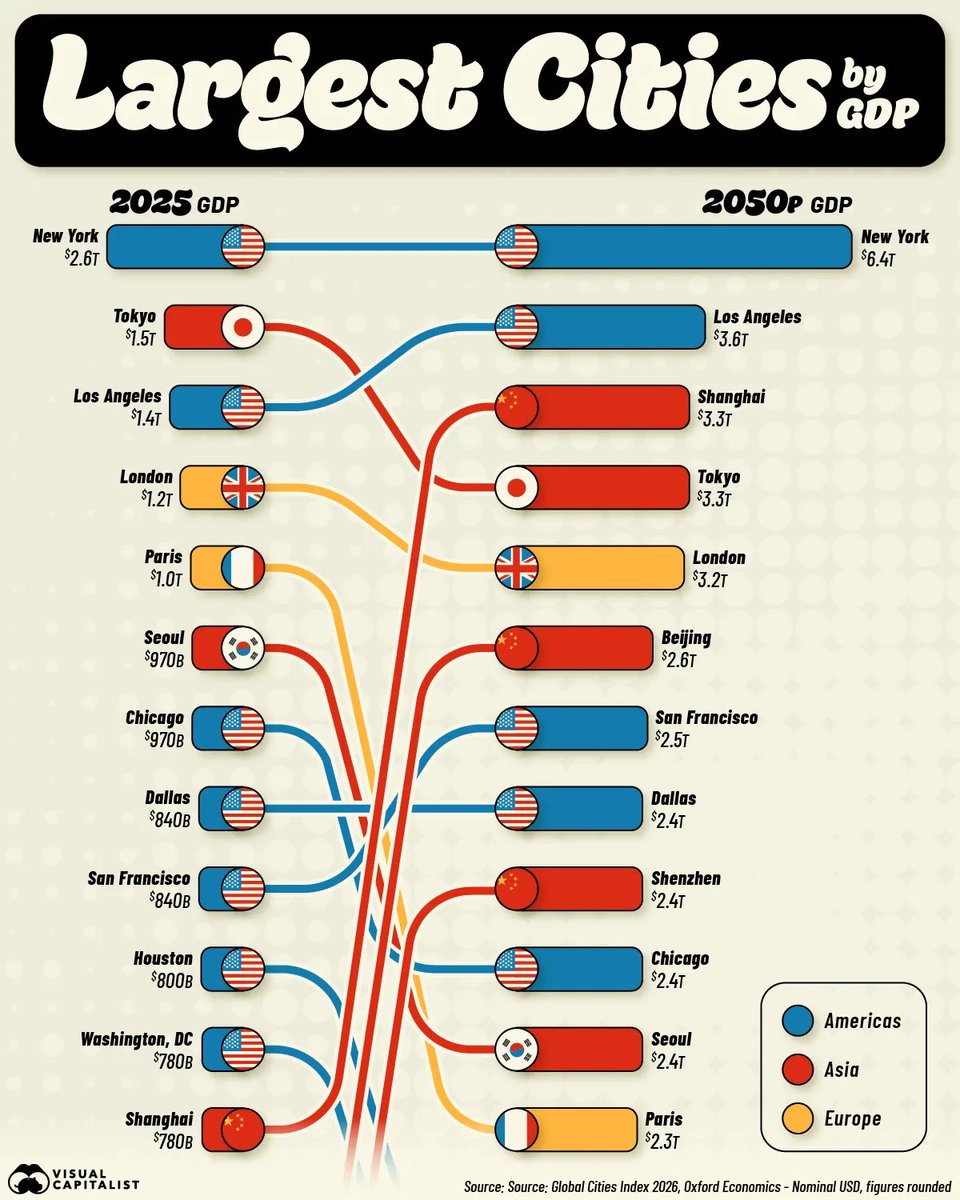
Largest city economies by GDP, 2025 versus 2050 projection | New York leads at $6.4T in 2050, Shanghai rises from 12th to 3rd, and three Chinese cities make the top ten
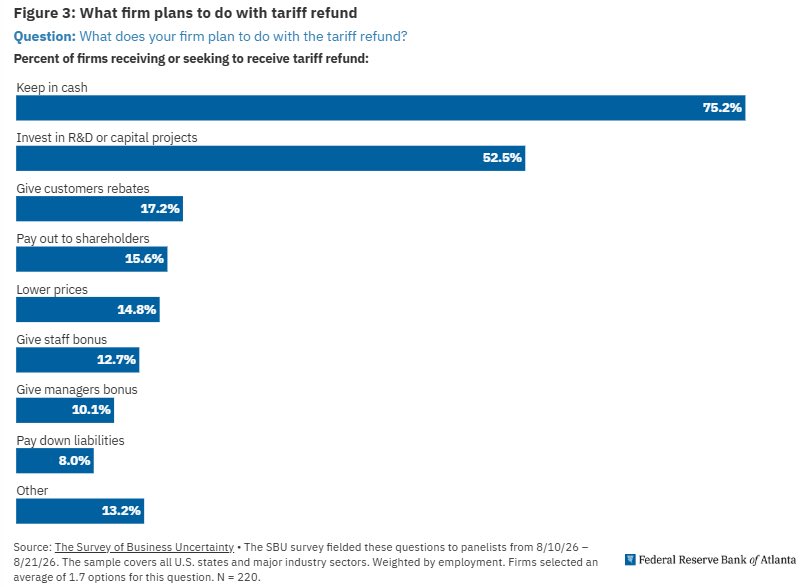
How firms plan to use tariff refunds (Atlanta Fed) | 75.2% keep as cash, 52.5% invest in R&D or capex
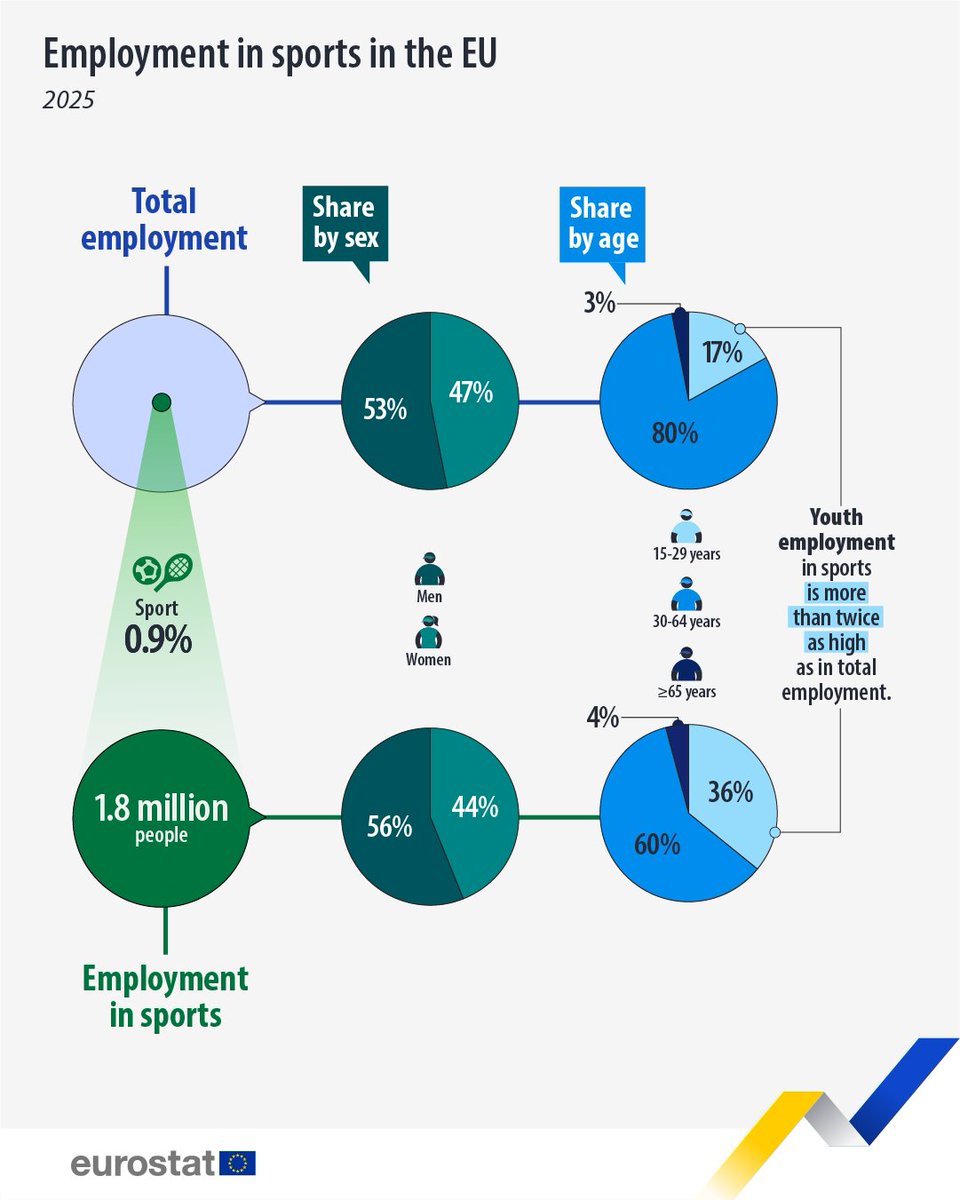
EU employment in sports by sex and age, 2025 | 1.8m people, 0.9% of total, 15-29 group at 36%
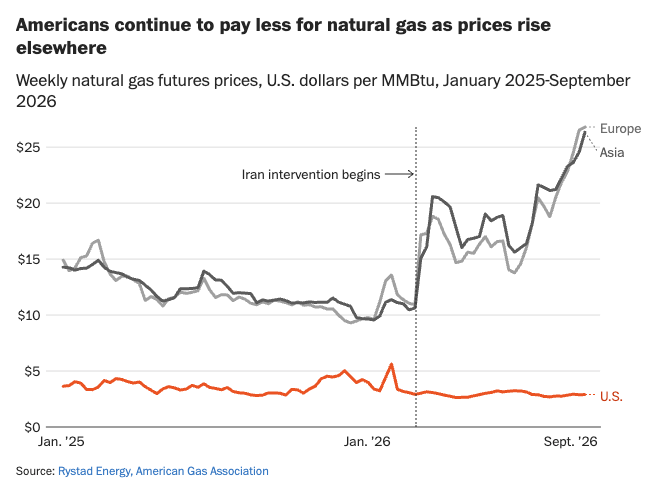
Weekly natural gas futures, US vs Europe vs Asia (USD/MMBtu) | Europe and Asia above $25 after the Iran conflict, US still near $3
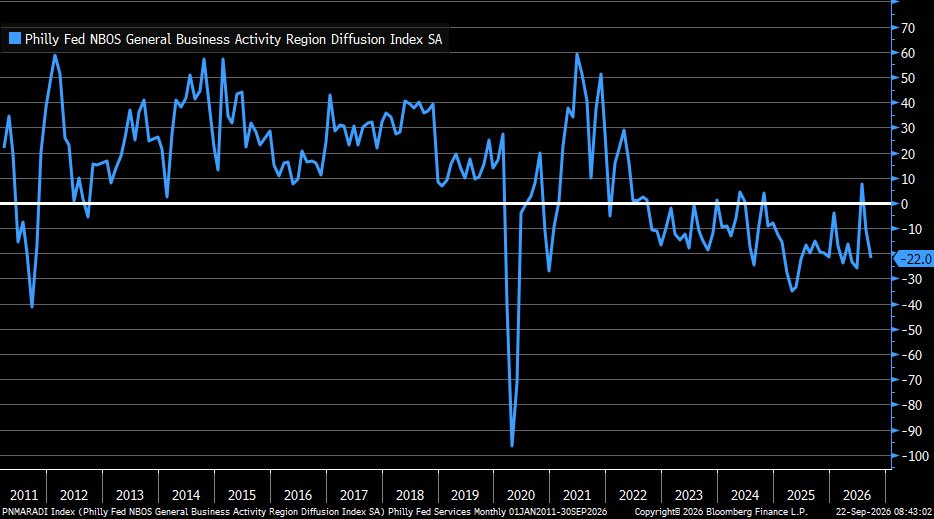
Philadelphia Fed non-manufacturing activity index | September at -22.0, down from -10.6
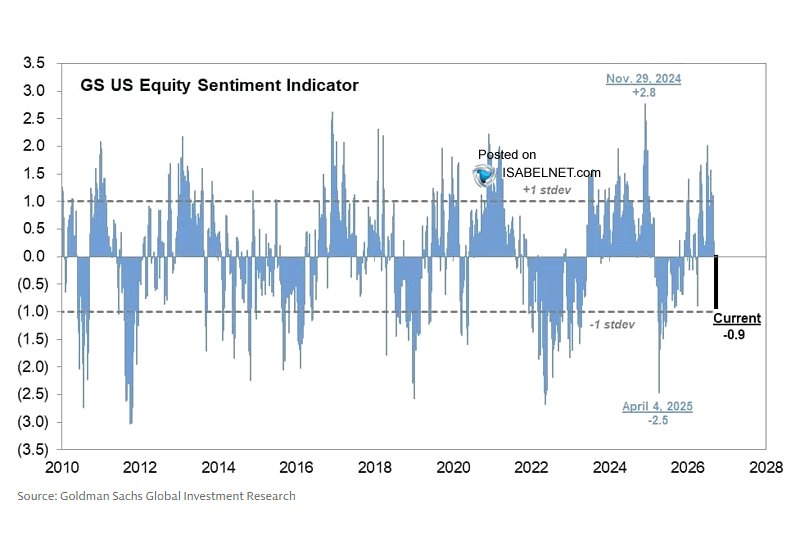
GS US equity sentiment indicator since 2010 | Now -0.9, near -1 standard deviation and well below the +2.8 peak of November 2024
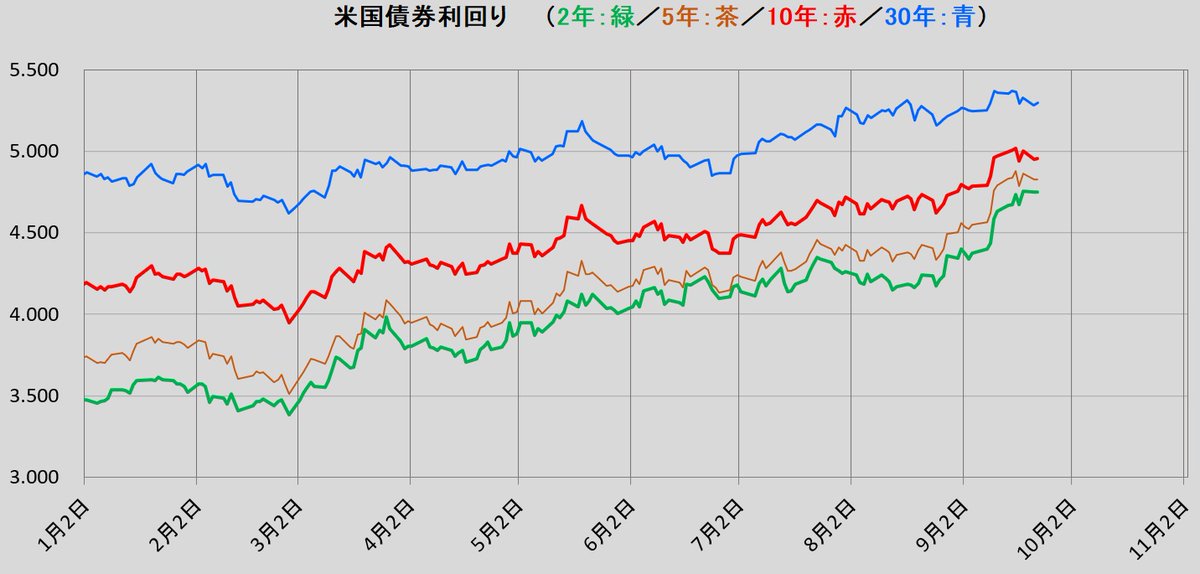
US 2/5/10/30-year Treasury yields, year to date | 30-year near 5.3% and 10-year near 4.95% as the whole curve moves higher
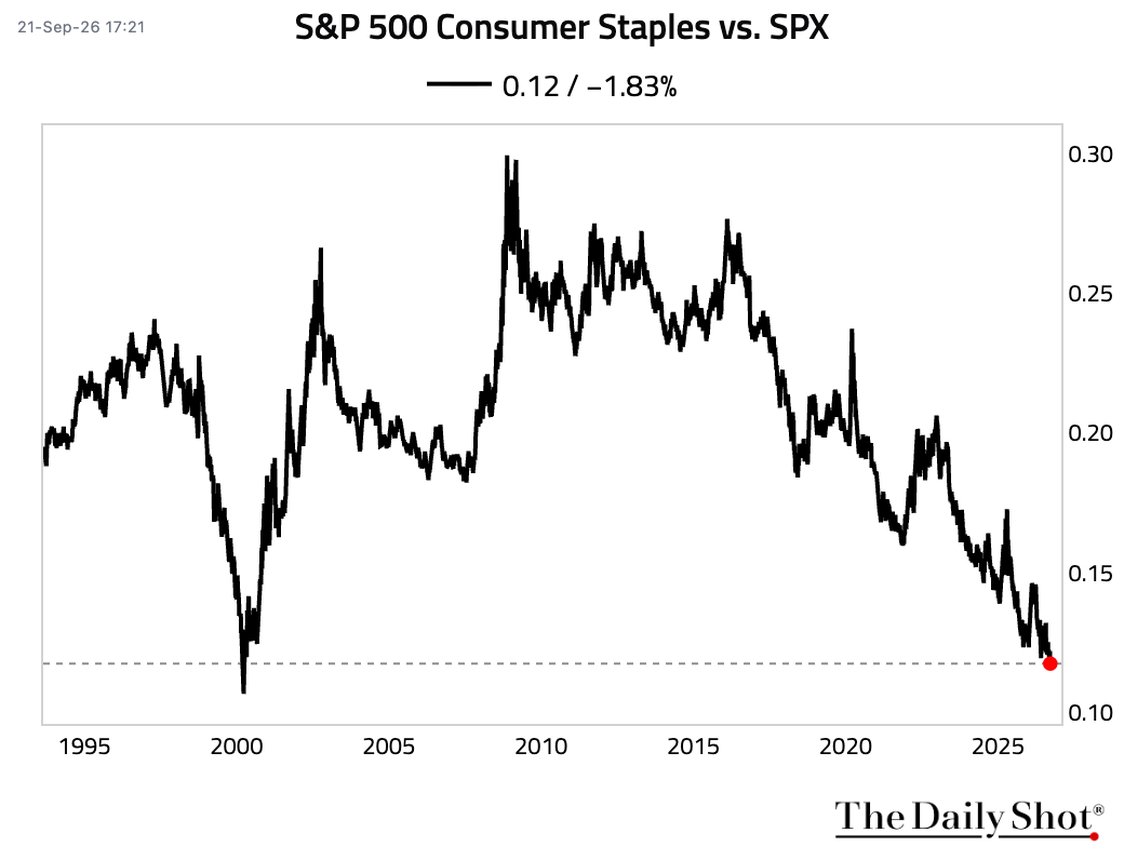
Consumer staples relative to the S&P 500 | Now 0.12, the lowest since April 2000

Trailing 5-day rolling sum of daily retail net flows in NVDA and all single stocks | NVDA retail inflows have rebounded to nearly the entire single-stock net
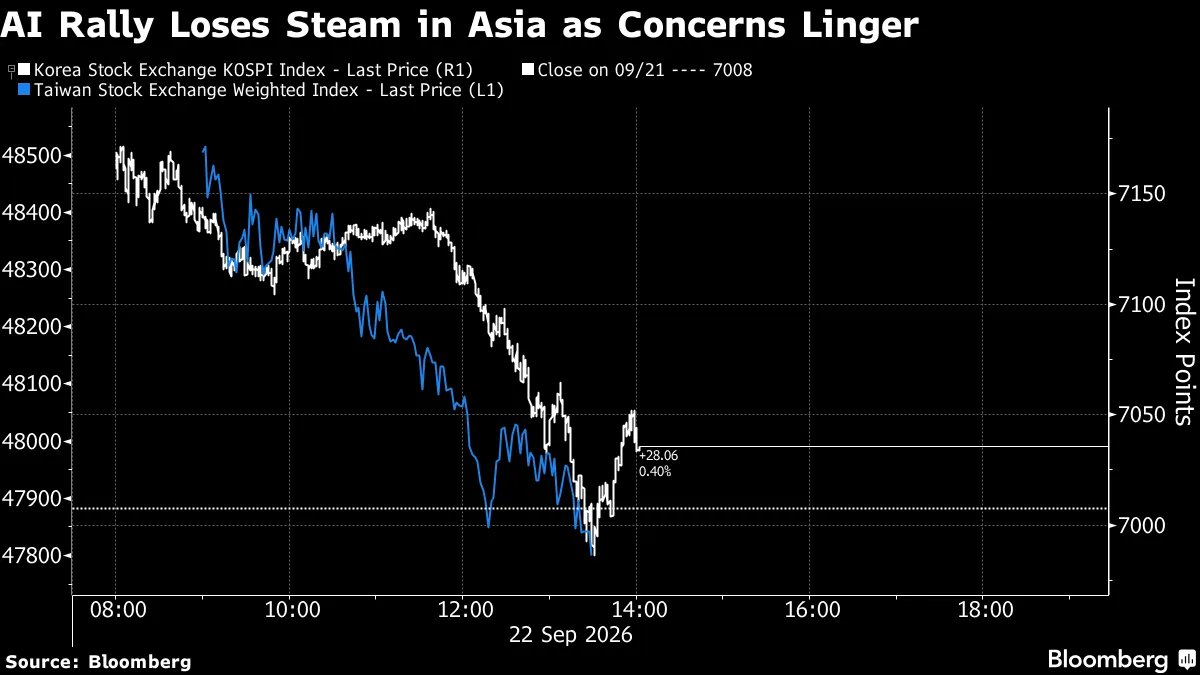
Korea's KOSPI and Taiwan's Taiex intraday, Sept 22 | Both slid from morning highs, KOSPI closed just +0.4%
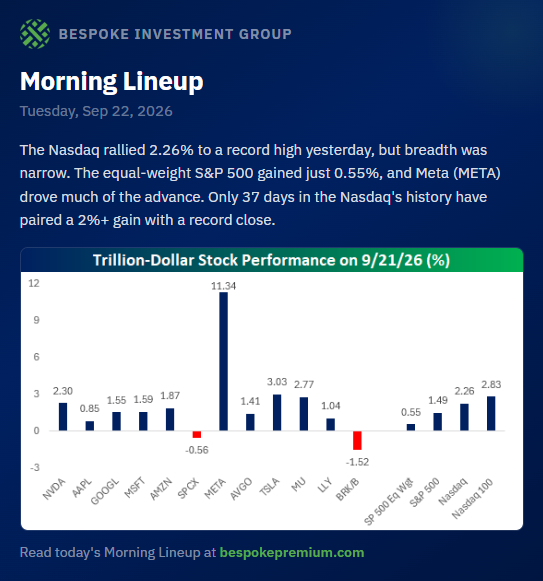
One-day performance of trillion-dollar stocks on 9/21 | Meta +11.34% leads, Tesla +3.03%, while Berkshire B lags at -1.52%
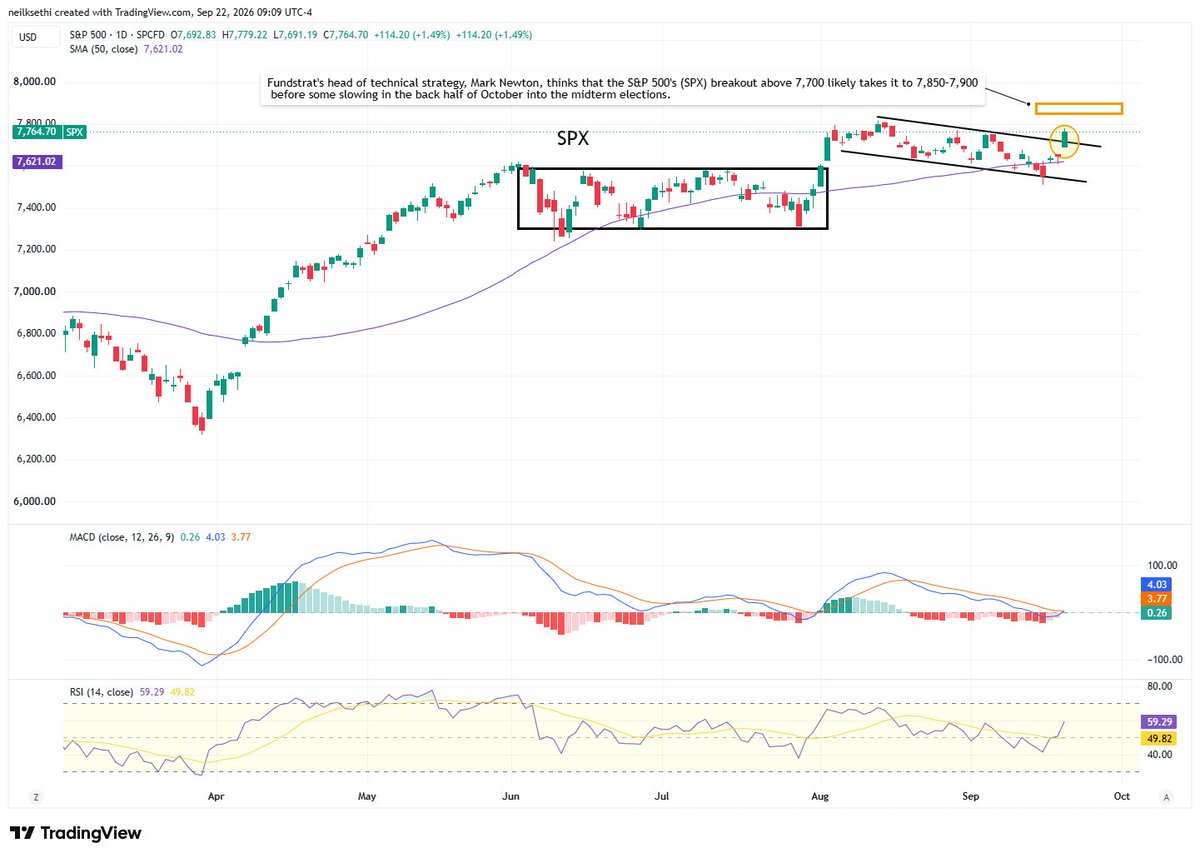
S&P 500 daily with 50-day MA, MACD and RSI | Latest 7,764.70, up 1.49%, holding above the 7,700 breakout
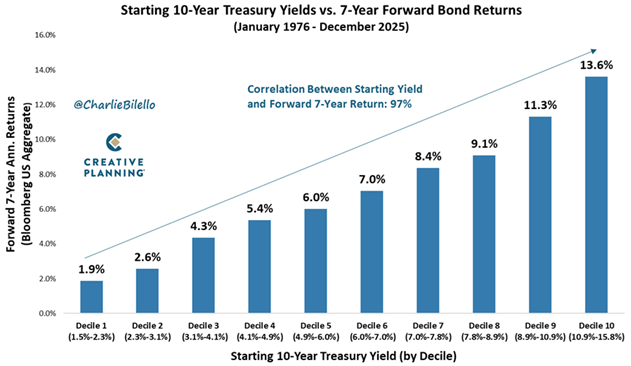
Starting 10Y yield decile vs forward 7-year bond return | Lowest decile 1.9%, highest 13.6%, 97% correlation
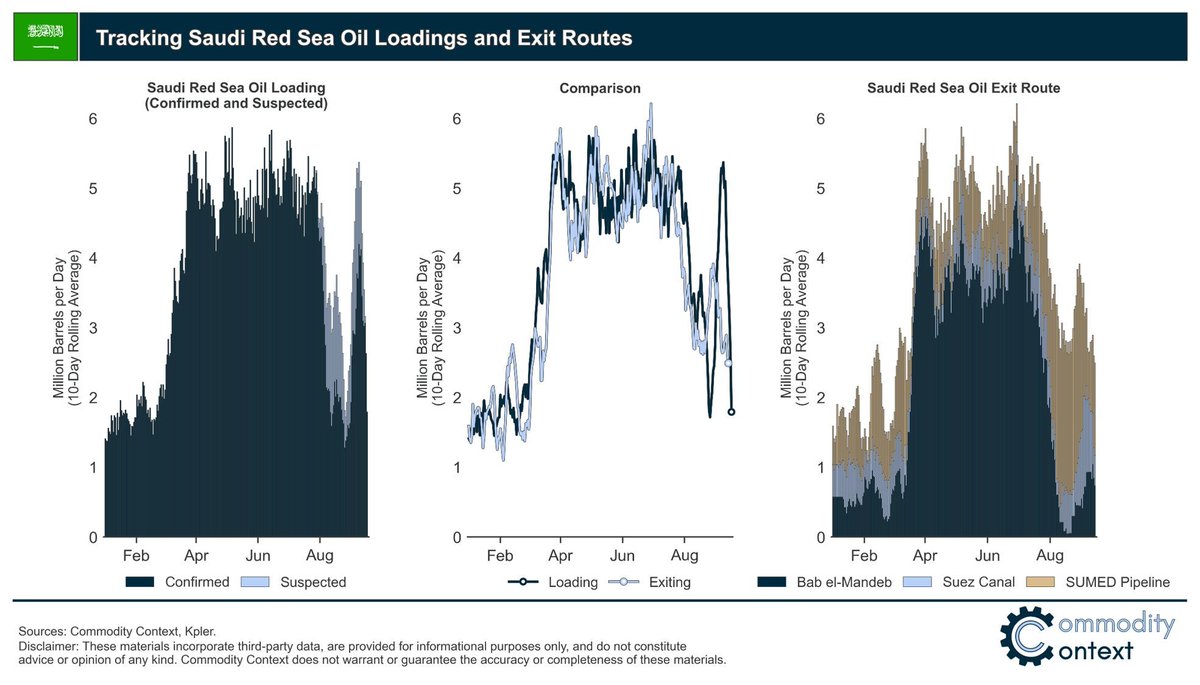
Saudi Red Sea crude loading and exit routes (Mb/d, 10-day avg) | Loadings off a ~6 Mb/d peak to ~1.75 Mb/d
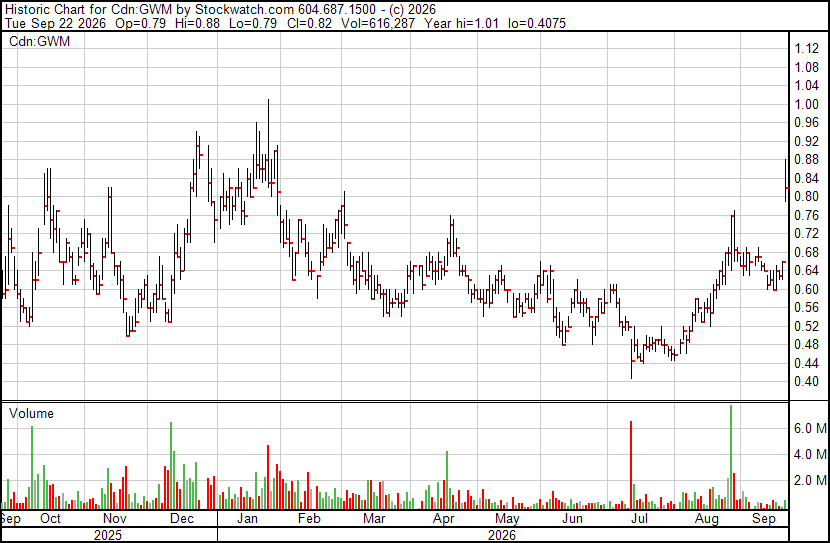
Galway Metals (GWM), past year daily | Latest C$0.82, up from the ~C$0.44 July low, with a 52-week high of C$1.01
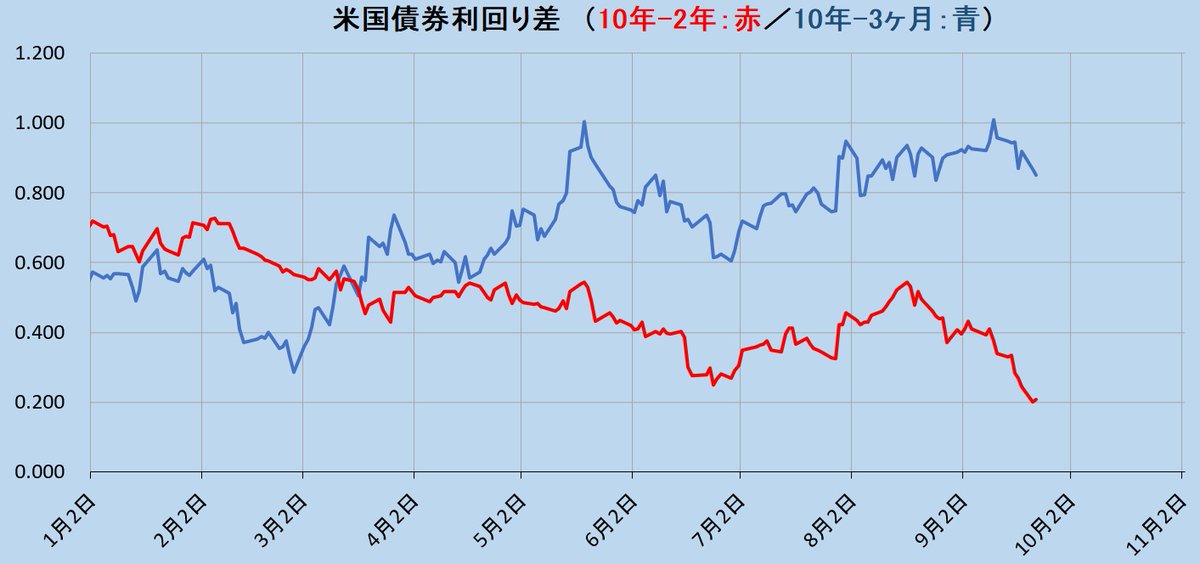
US Treasury term spreads, 10Y-2Y and 10Y-3M | The 10Y-2Y spread has narrowed to ~0.20
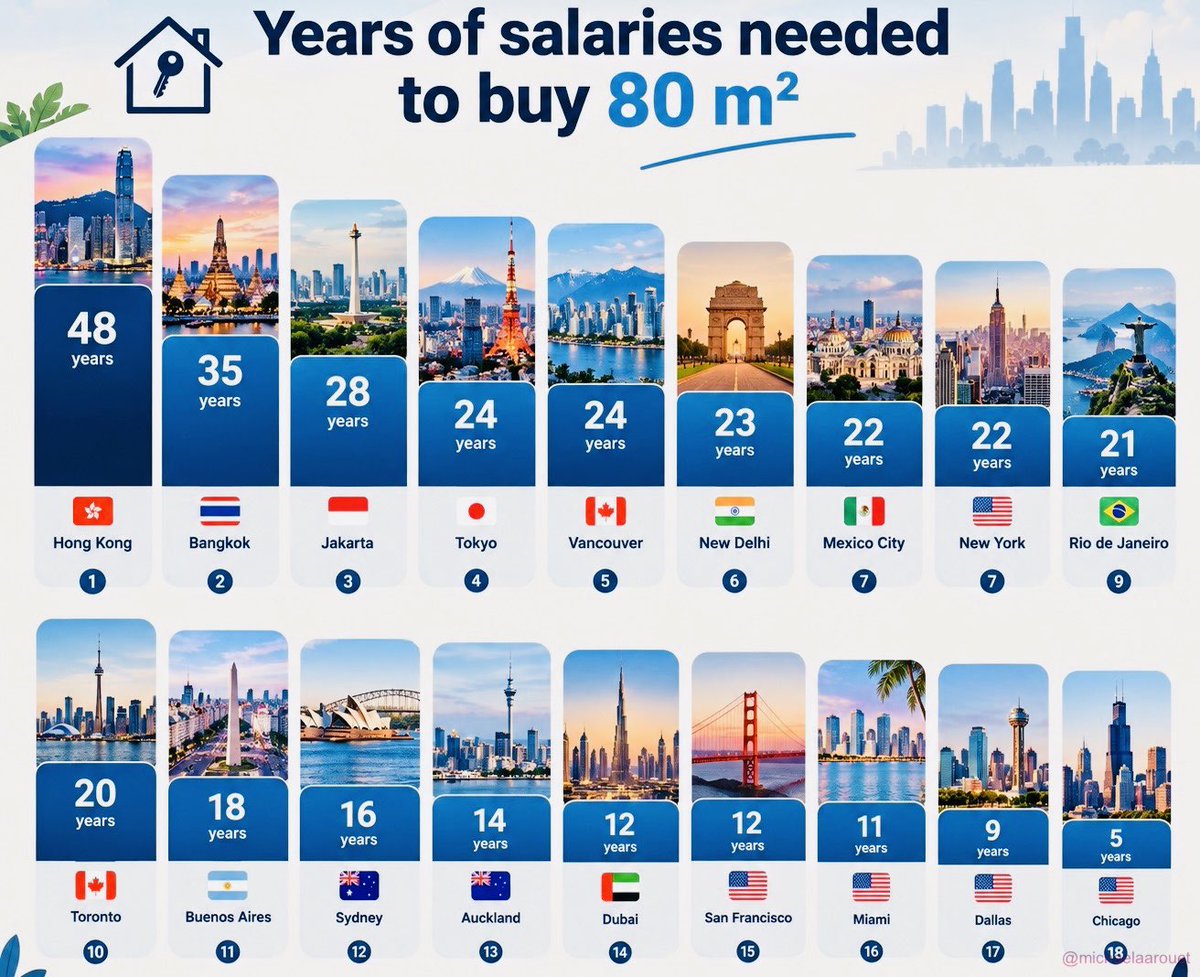
Years of salary to buy an 80 m² home by city | Hong Kong 48 years tops the list, Chicago just 5
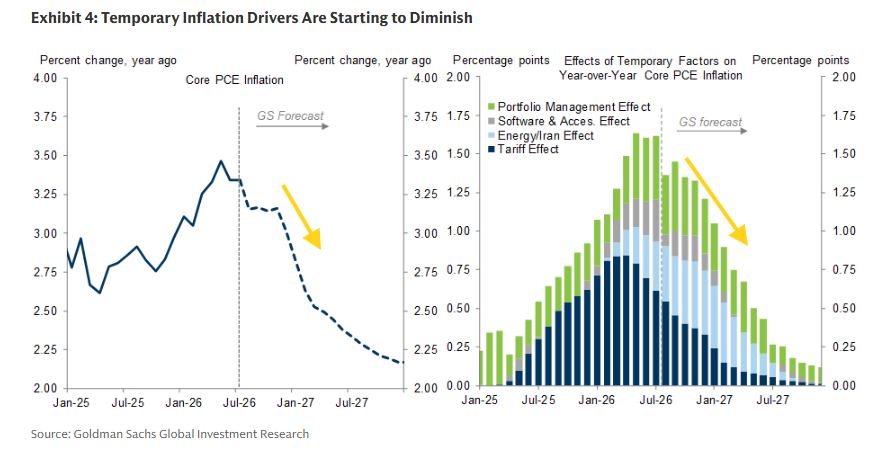
Core PCE inflation and the temporary factors behind it, 2025-2027 with GS forecast | Temporary drivers peak near 1.6pp then fade, with core PCE seen easing to ~2.2% by 2027
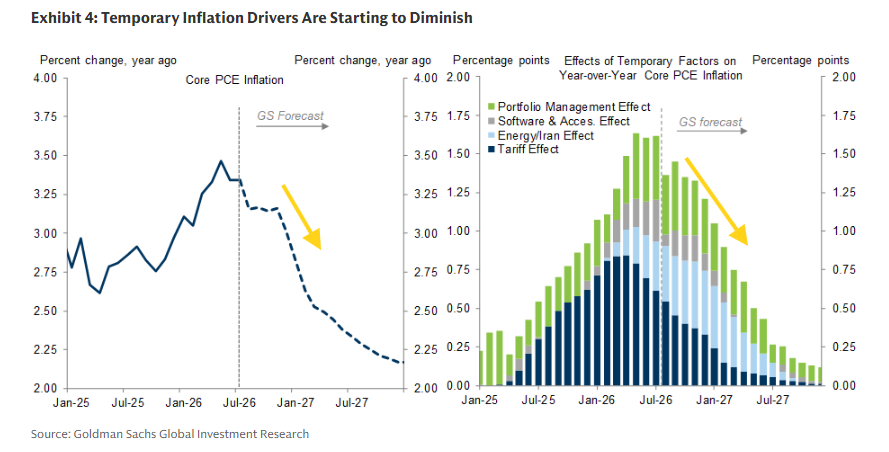
Core PCE inflation and the contribution of temporary factors (GS forecast) | Core PCE peaks near 3.4% around mid-2026 as tariff and energy effects fade
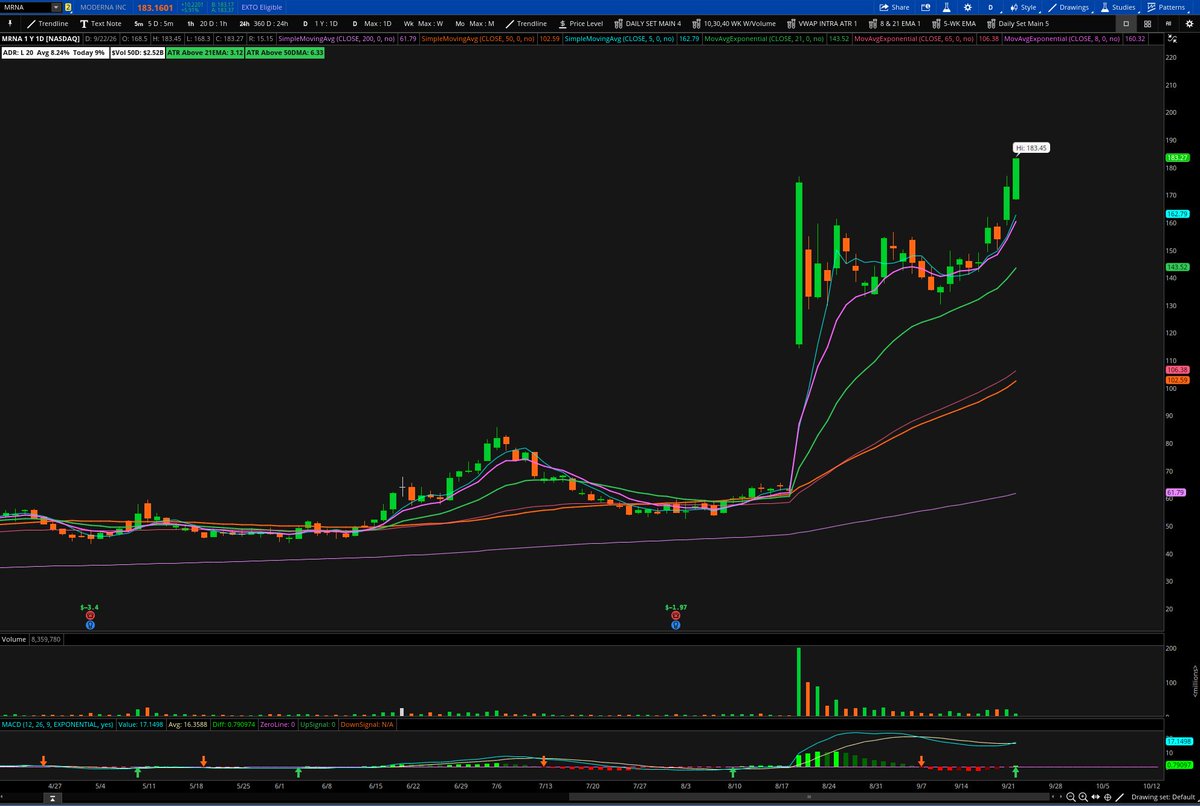
Moderna (MRNA), past year daily | Latest ~$183, up 8.24% on the day and far above the ~$50 summer low
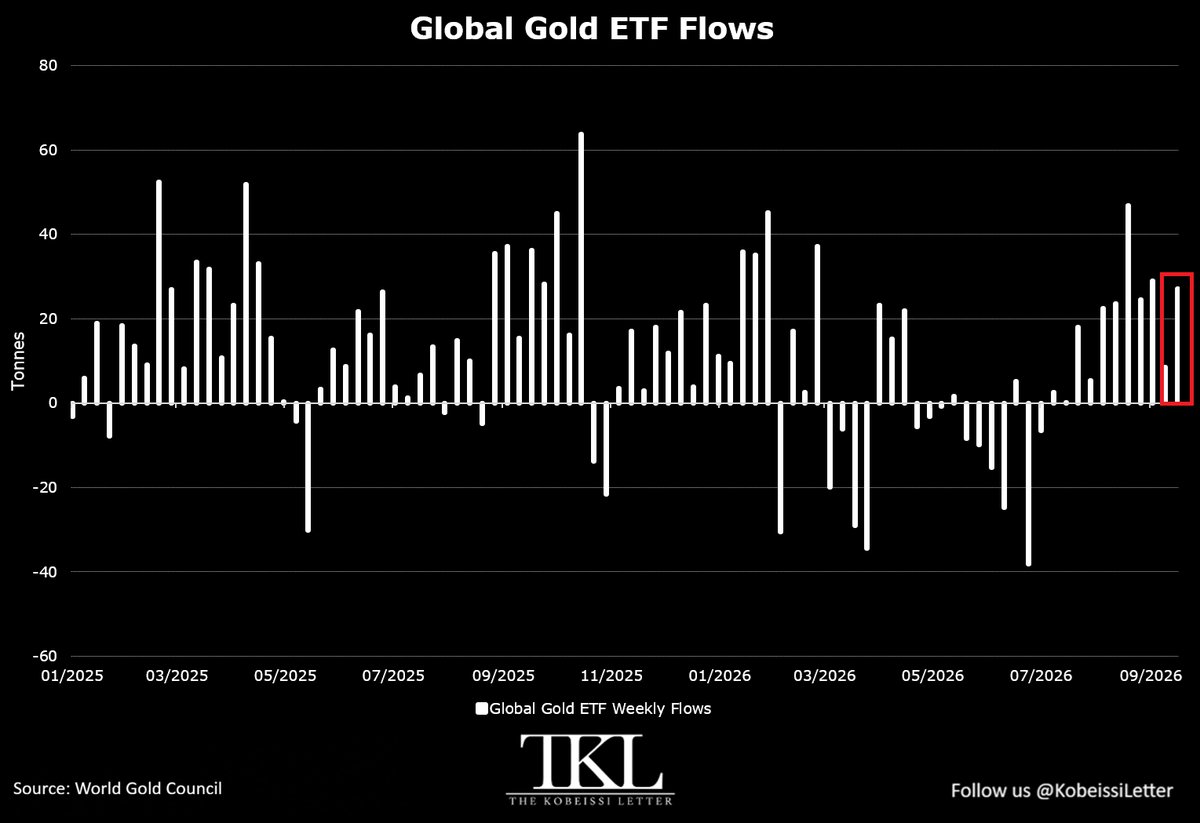
Global gold ETF weekly flows, tonnes | +27.1t last week, an 11th straight weekly inflow lifting holdings to a record 4,250t
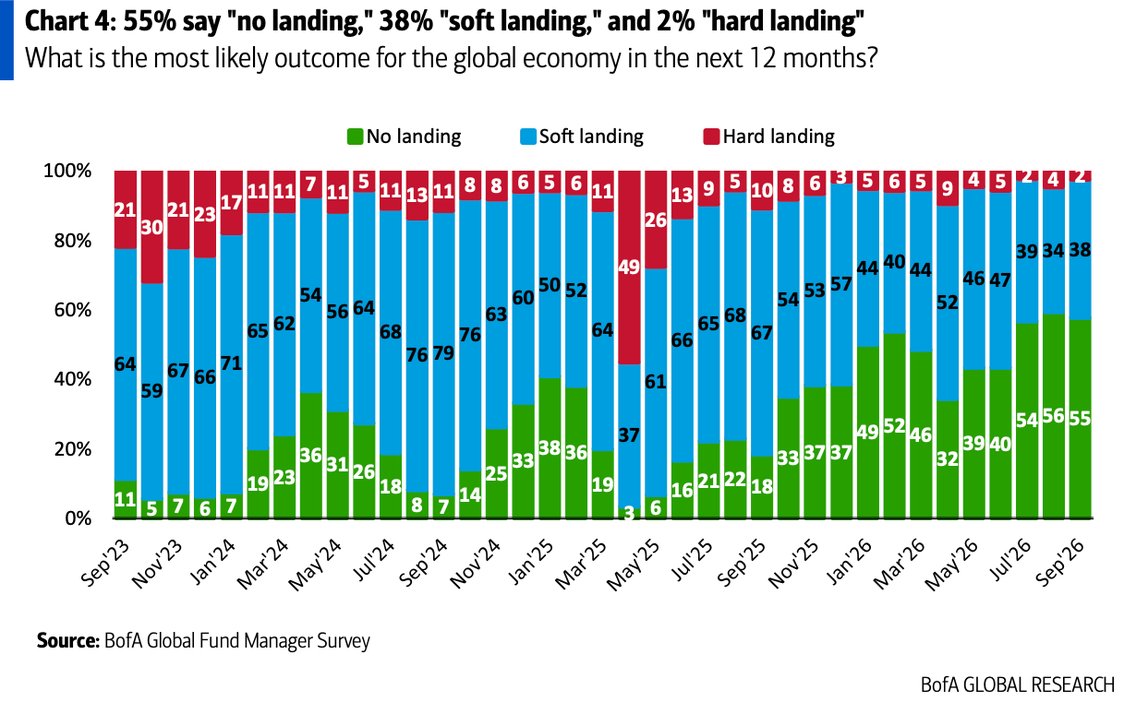
BofA fund manager survey on the global economy | 55% no landing, 38% soft landing, only 2% hard landing
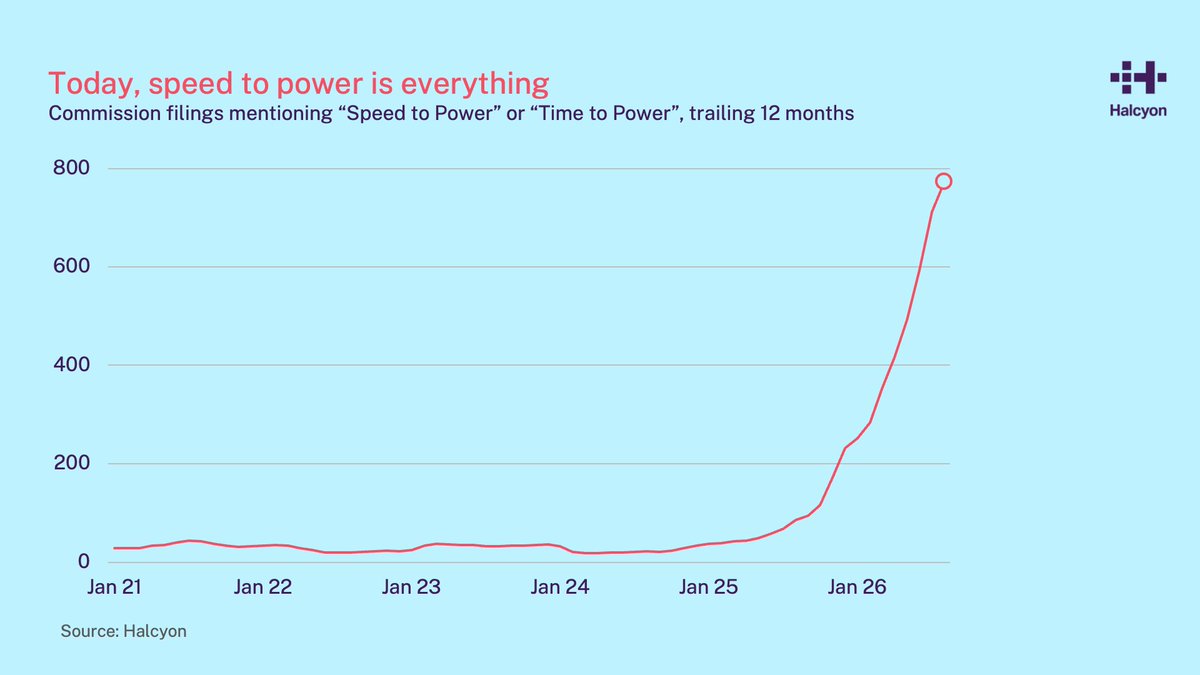
Commission filings mentioning 'Speed to Power' or 'Time to Power', trailing 12 months | Up from under 50 before 2024 to about 780, reflecting the data-center power scramble
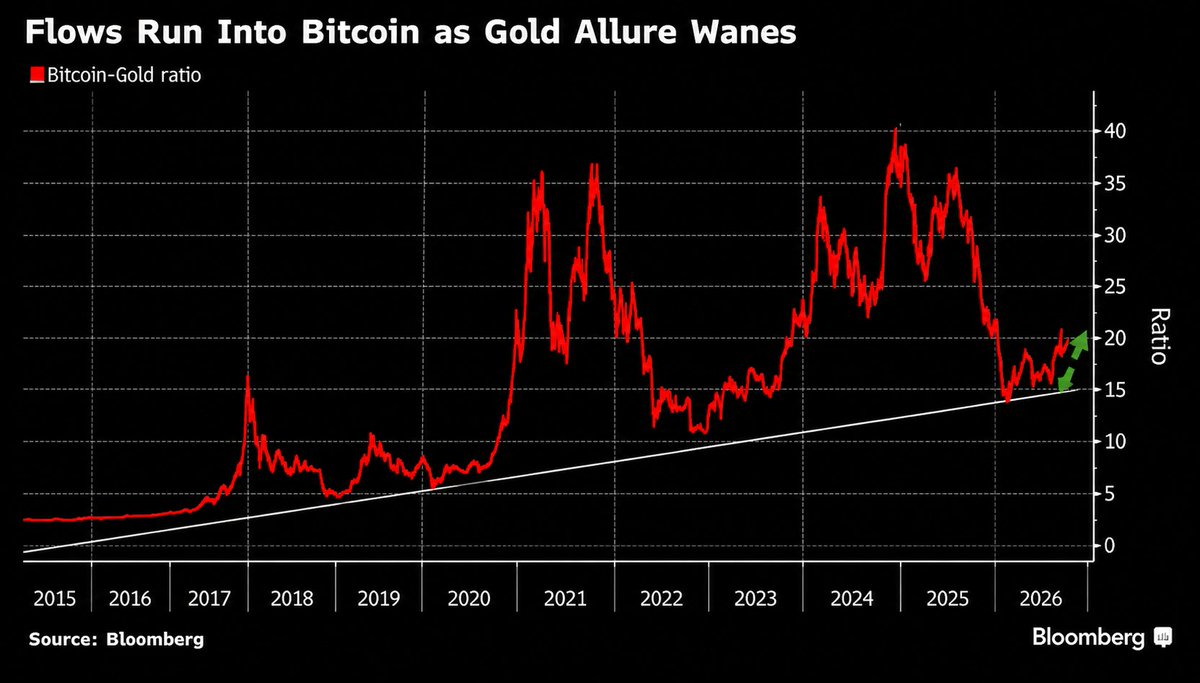
Bitcoin-to-gold ratio since 2015 | Back near 20 after falling below 15 in late 2025, rising above its long-term uptrend line
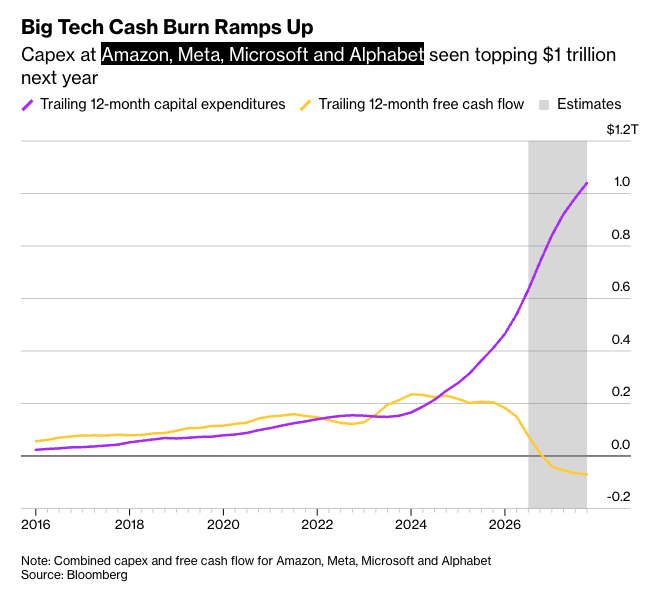
Trailing 12-month capex vs free cash flow at Amazon, Meta, Microsoft and Alphabet | Capex nears $1T into 2027 while combined FCF swings negative
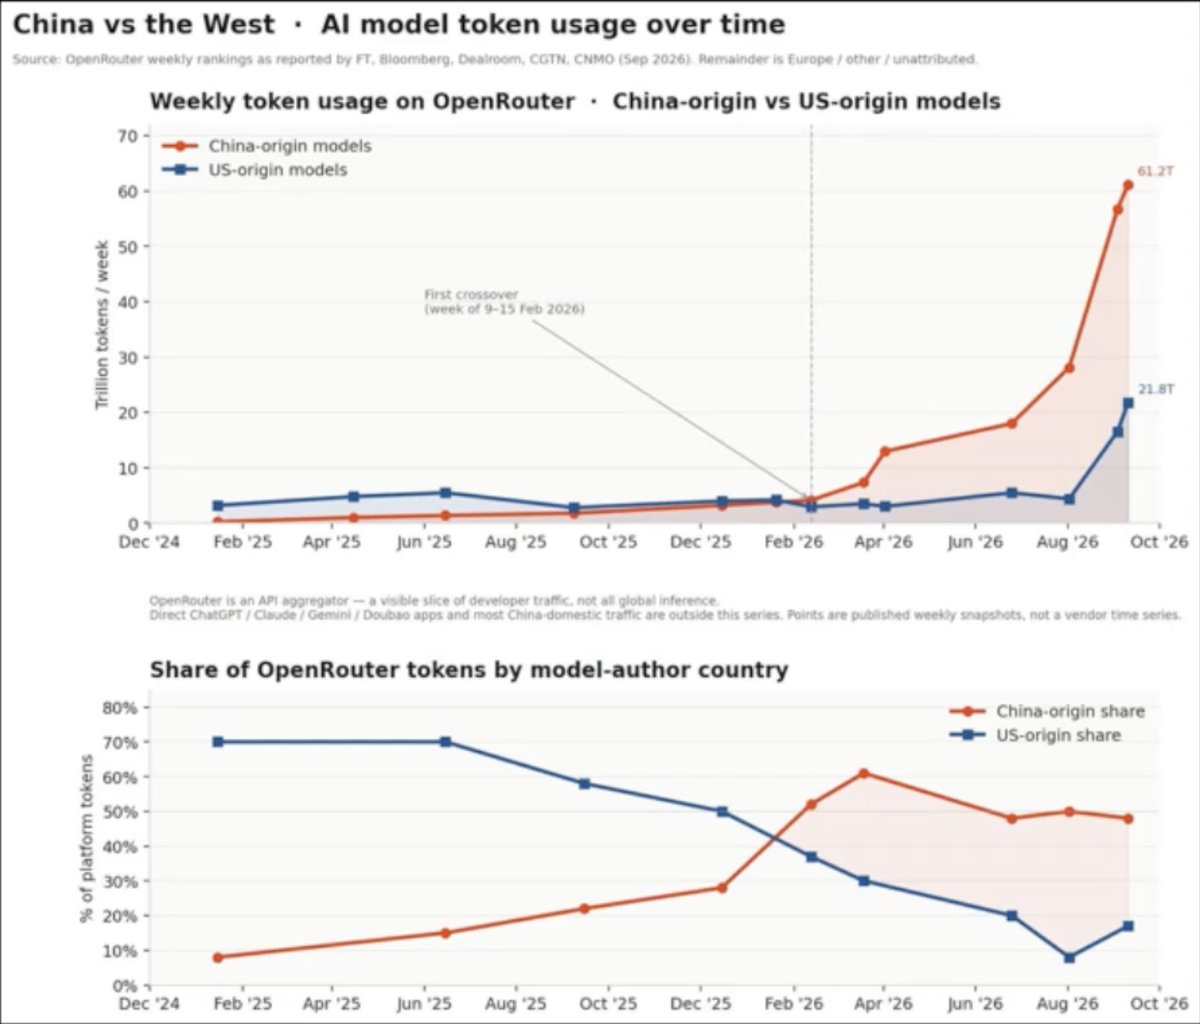
Weekly token usage on OpenRouter, China- vs US-origin models | China-origin now 61.2T vs US 21.8T, after the first crossover in February 2026
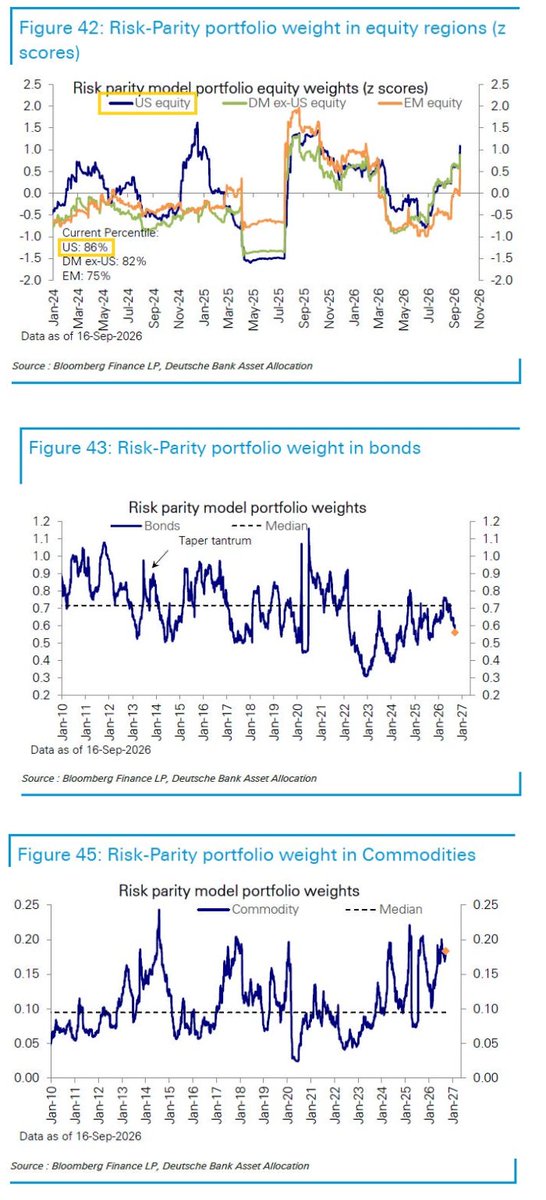
Deutsche Bank risk-parity model weights across equities, bonds and commodities | US equity at the 86th percentile and commodities at the 95th, while bonds sit at the 26th
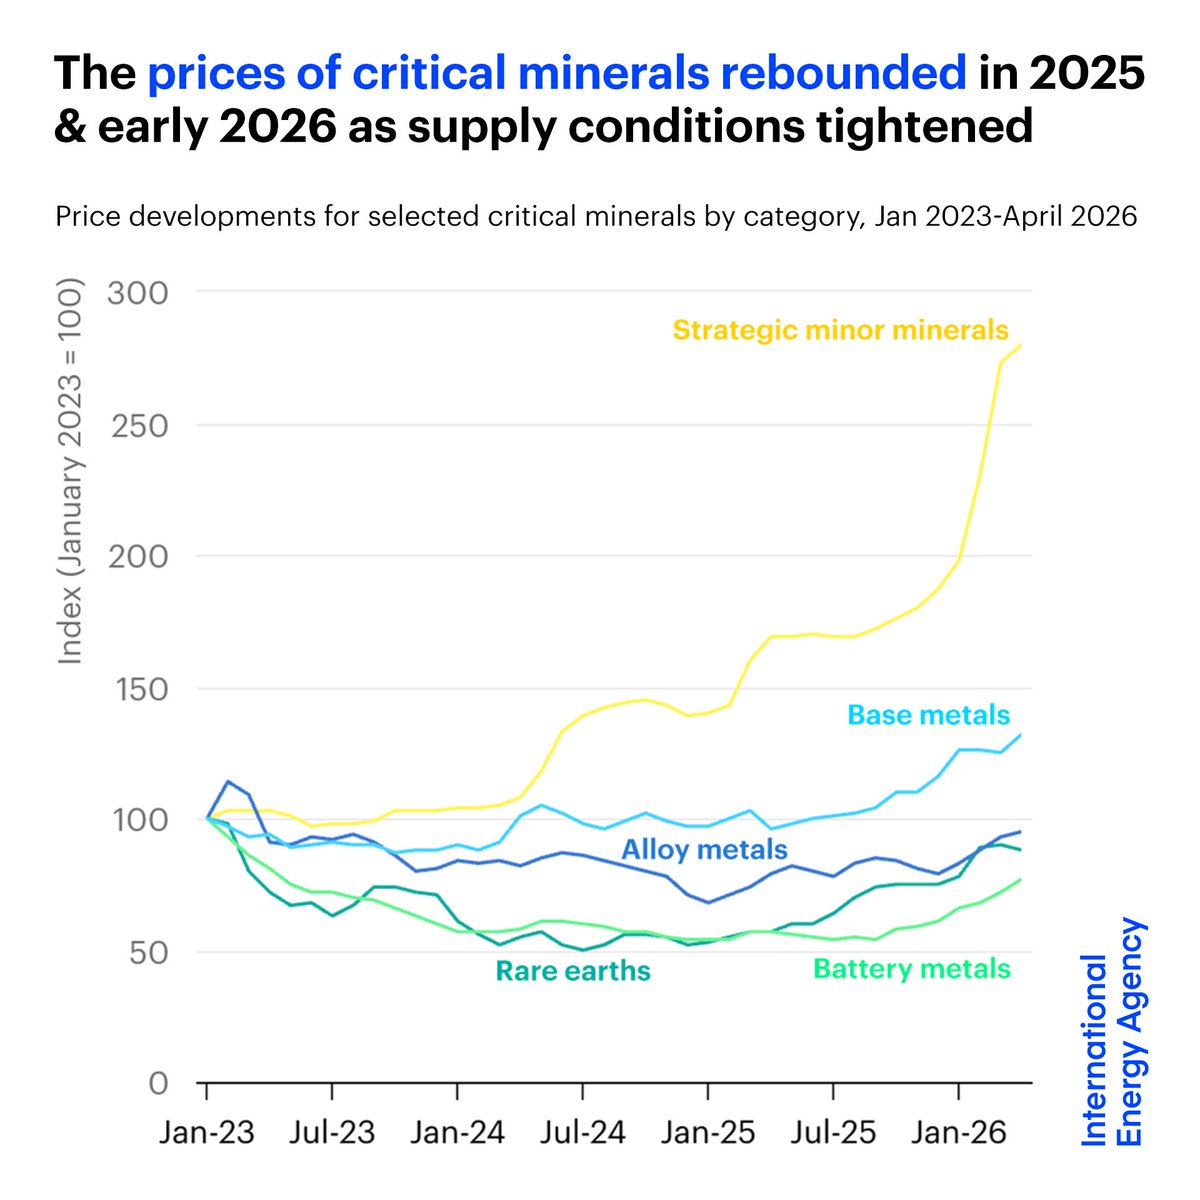
Price index for critical minerals by category, January 2023 = 100 | Strategic minor minerals near 280 lead, with base metals ~130 and battery metals only ~75
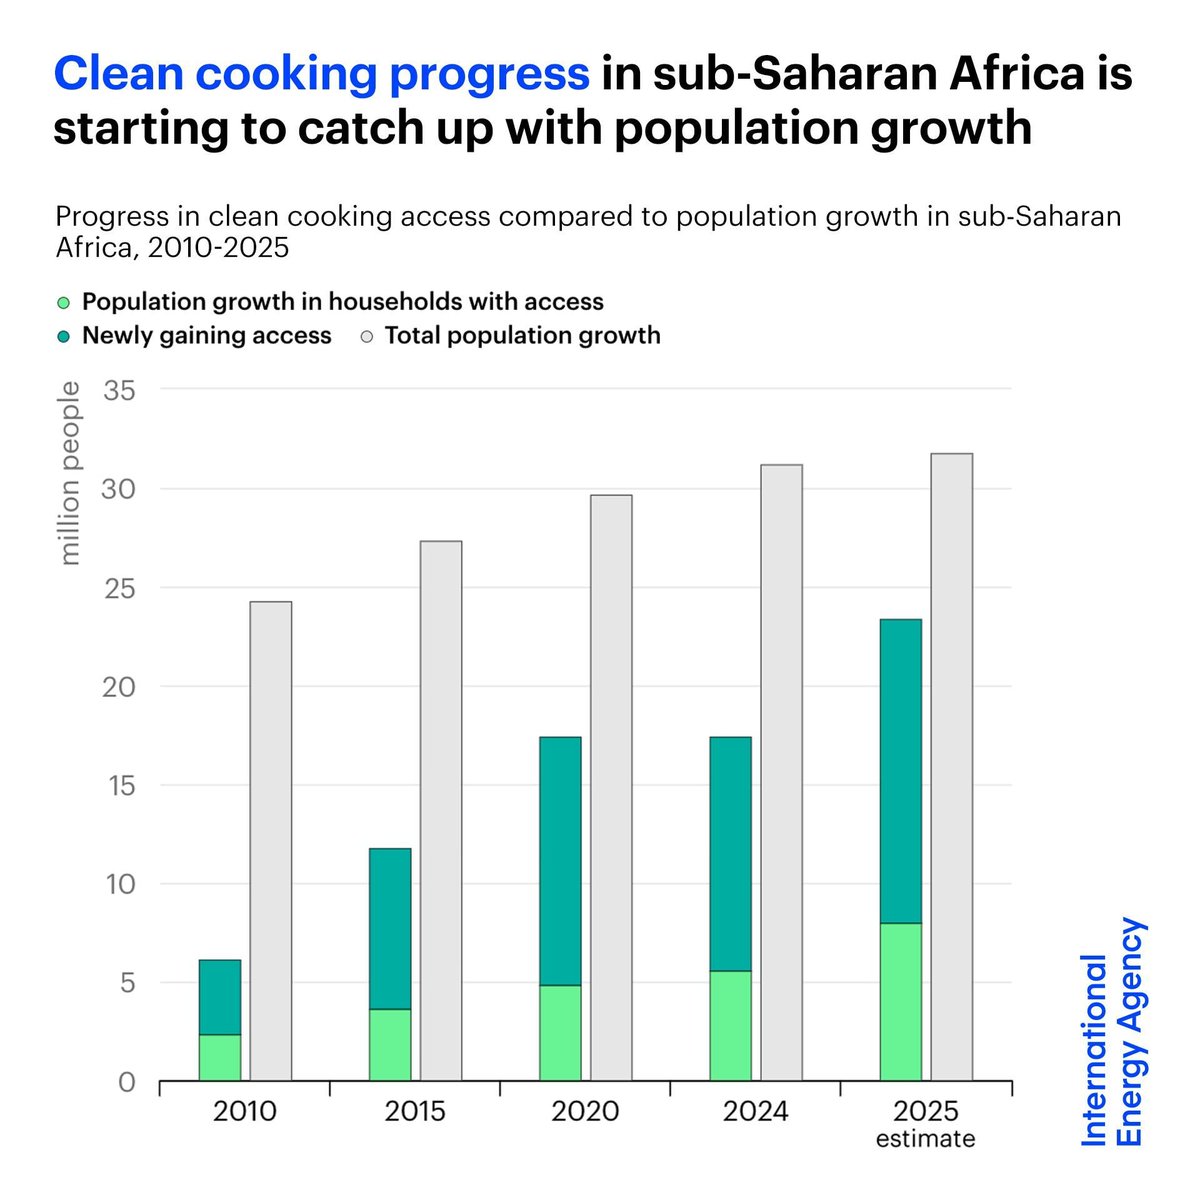
Clean-cooking access vs population growth in sub-Saharan Africa (million people) | 2025 gains near the ~32m total population growth
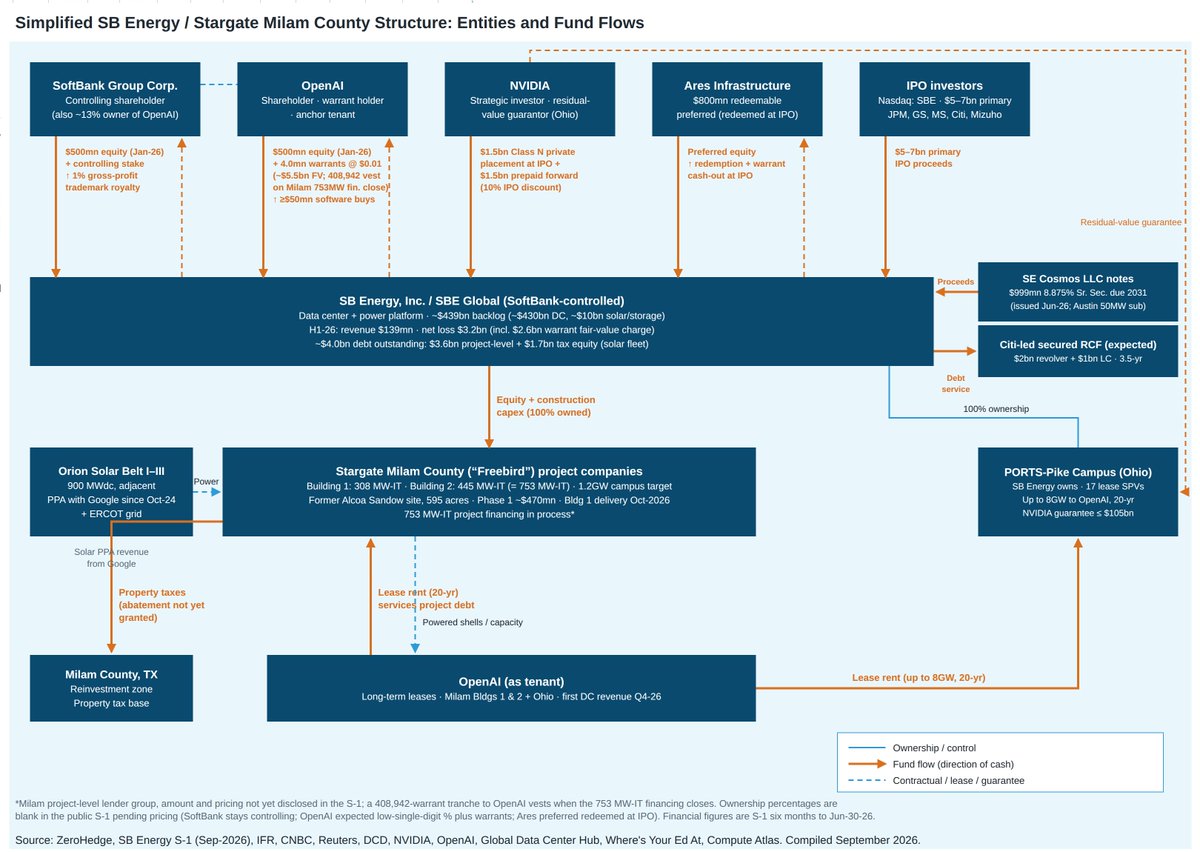
Entities and fund flows for the SB Energy / Stargate Milam County project | SoftBank controls and adds $500mn, NVIDIA places $1.5bn and guarantees 10% at IPO, with a $5-7bn primary raise
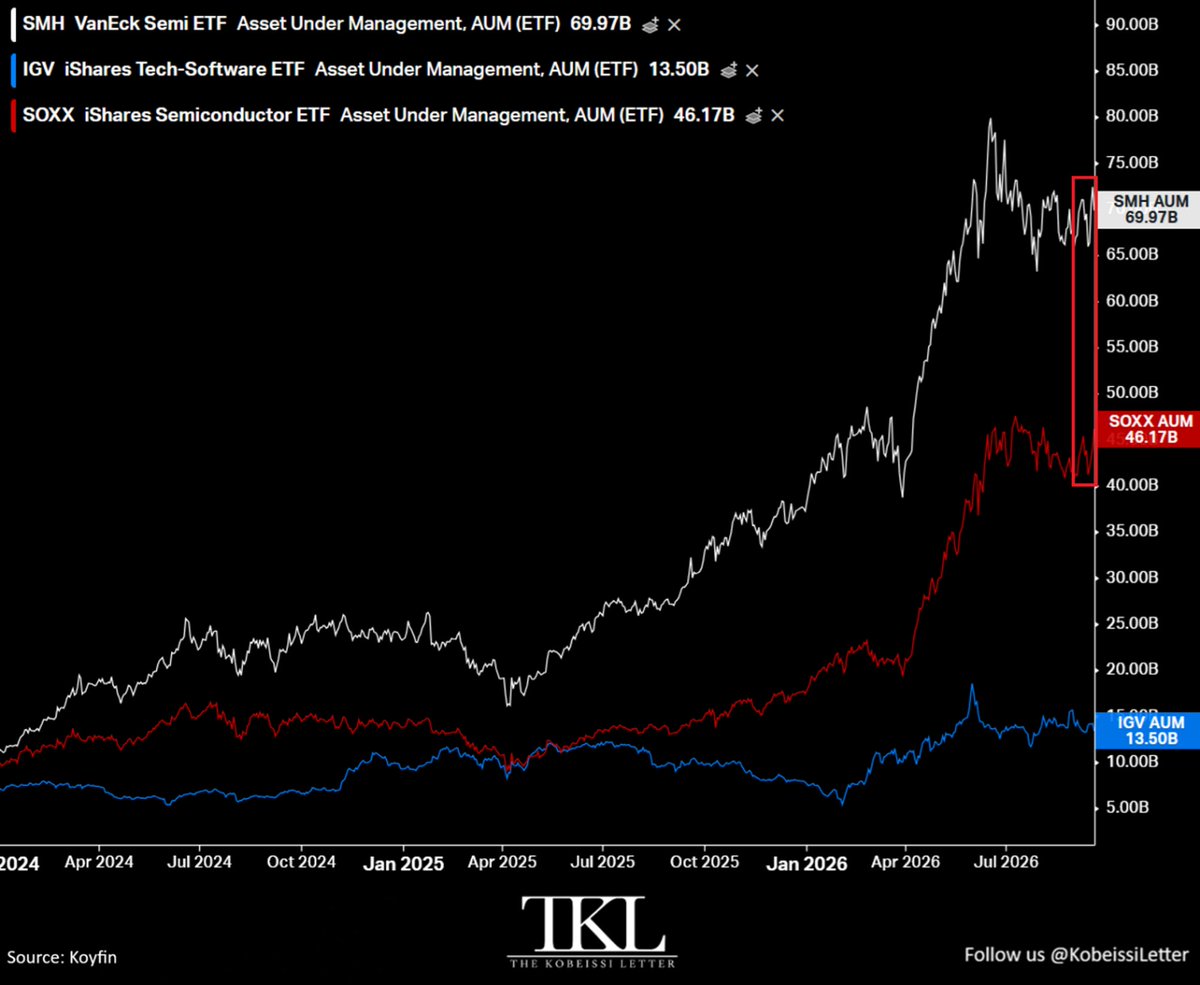
AUM of semiconductor and software ETFs | SMH at $69.97B and SOXX at $46.17B, far above software ETF IGV at $13.5B
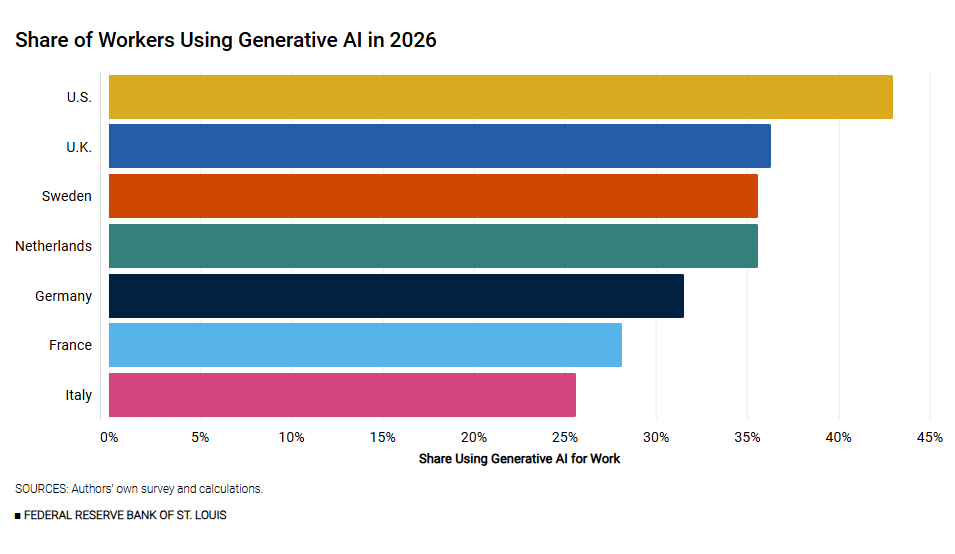
Share of workers using generative AI for work by country | US highest at ~43%, Italy lowest at ~26%
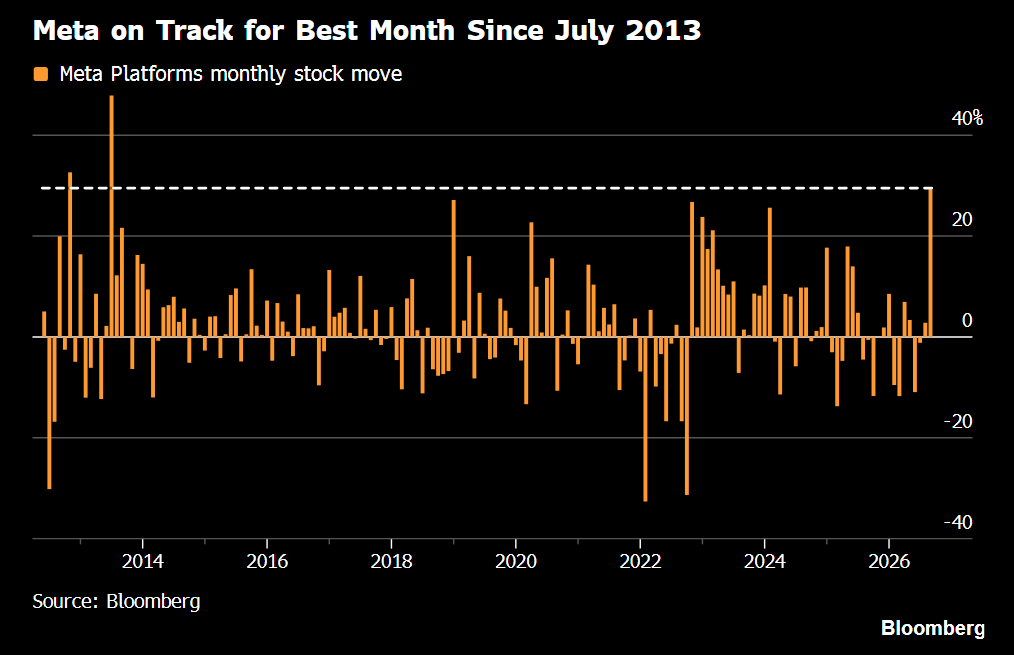
Meta Platforms monthly stock move since 2013 | Up ~32.7% this month, the strongest since July 2013
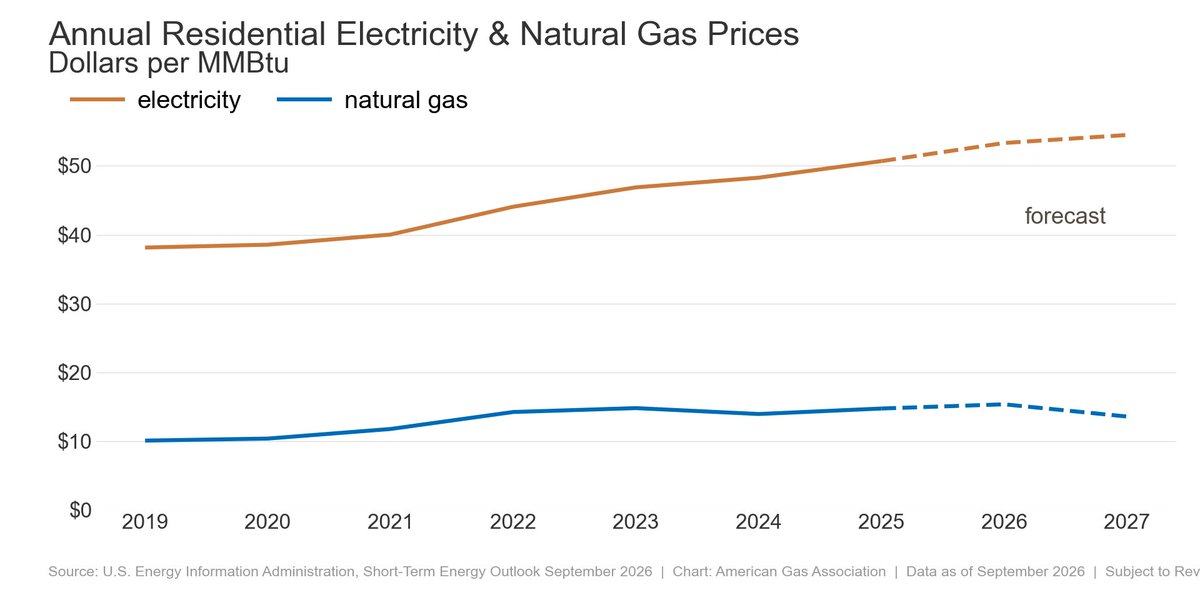
US residential electricity vs natural gas prices (USD/MMBtu) | Electricity to ~$54, natural gas near $14 and set to ease
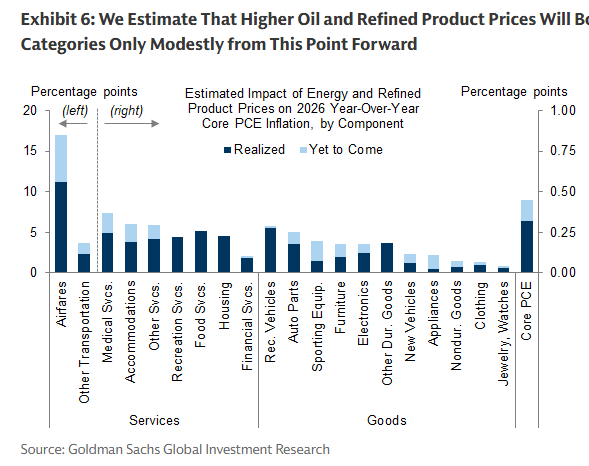
Estimated impact of energy and refined-product prices on 2026 core PCE by component | GS sees just 3-5bp added to monthly core PCE through year-end, with airfares hit most
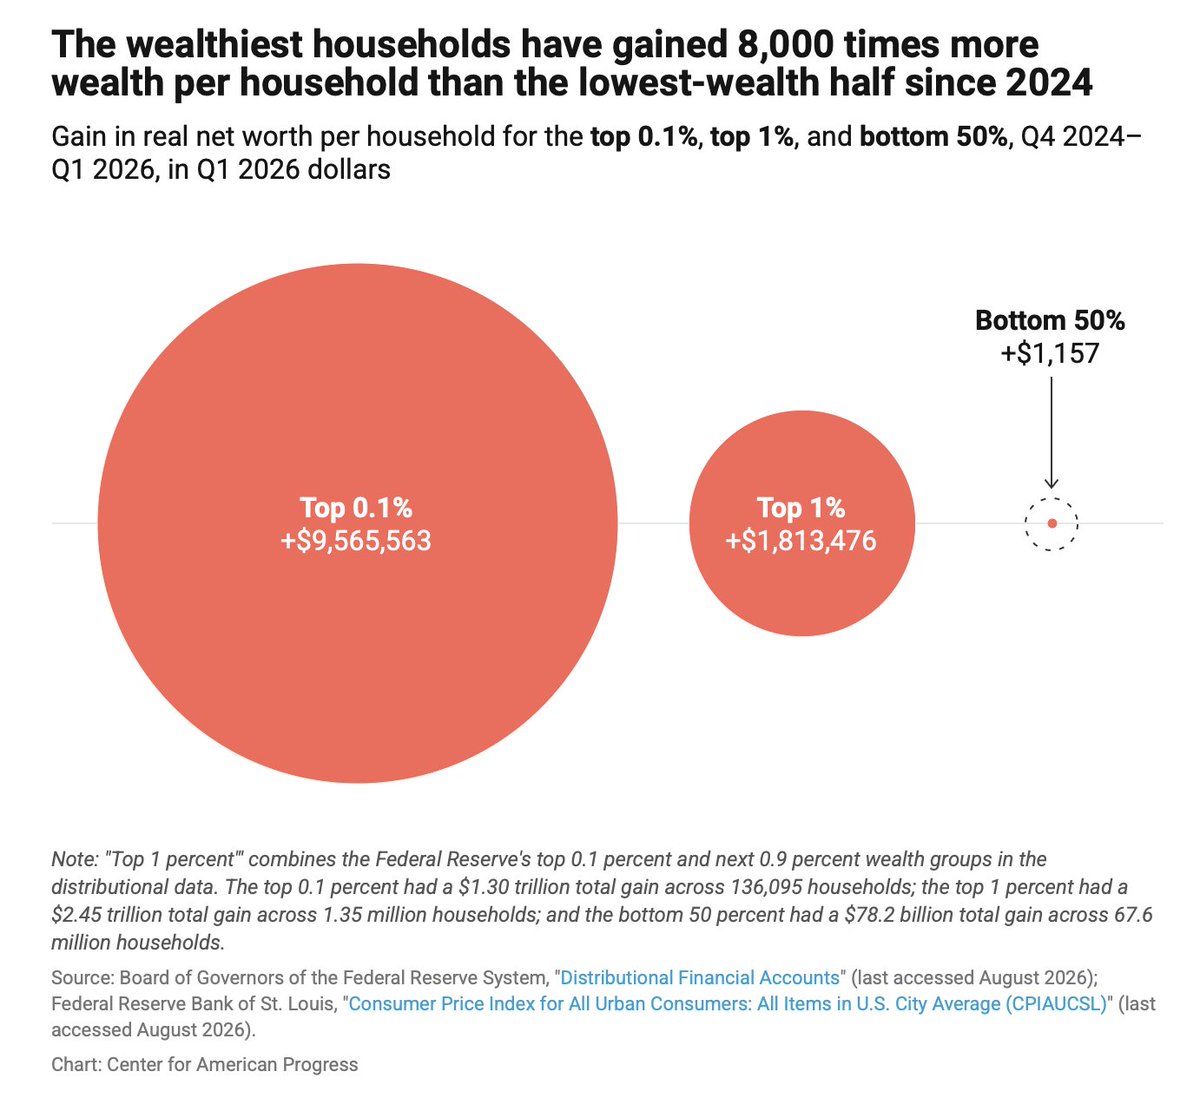
Real net-worth gain per household by wealth group | Top 0.1% +$9.57M, top 1% +$1.81M, bottom 50% just +$1,157
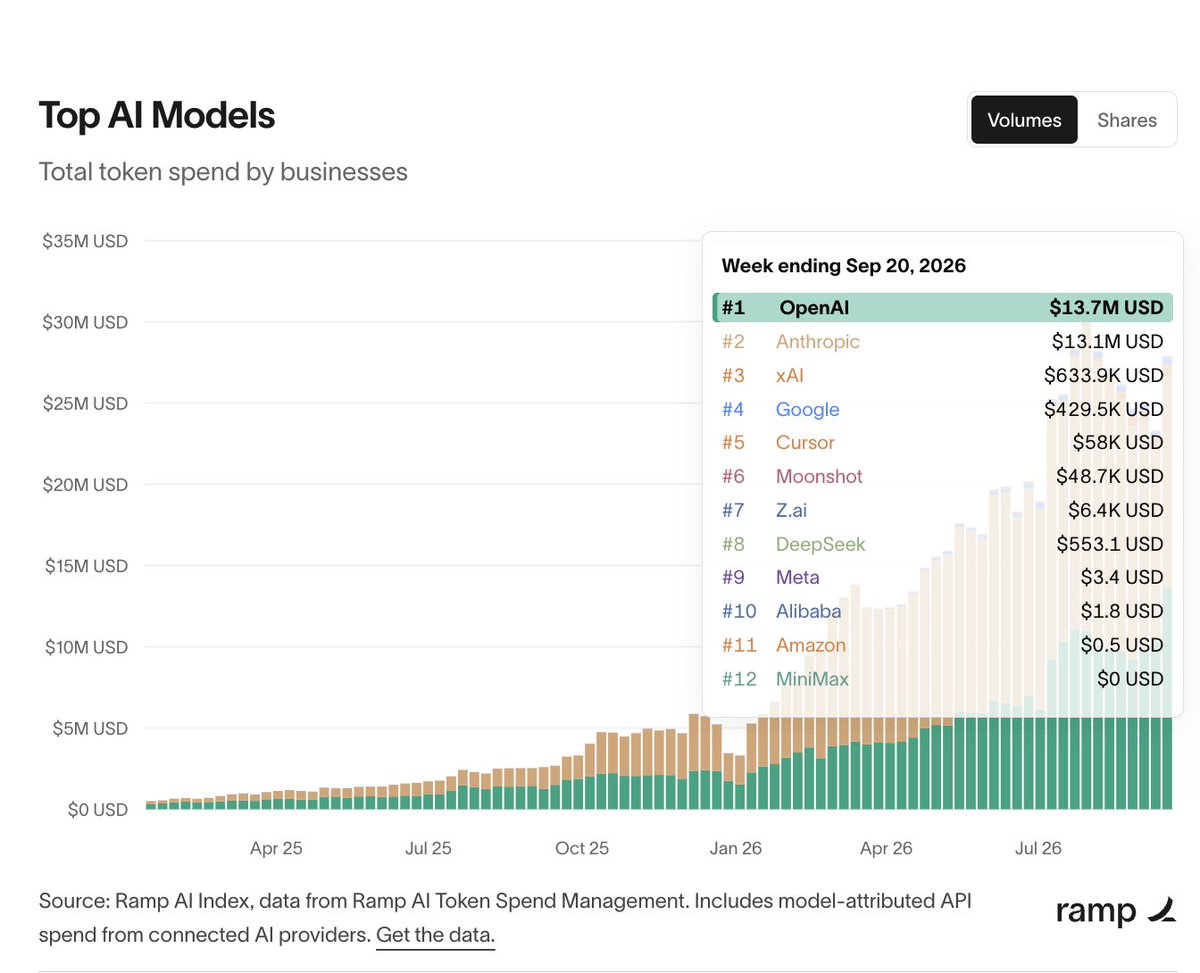
Weekly business token spend by AI model | Week ending Sep 20, OpenAI at $13.7M just ahead of Anthropic at $13.1M
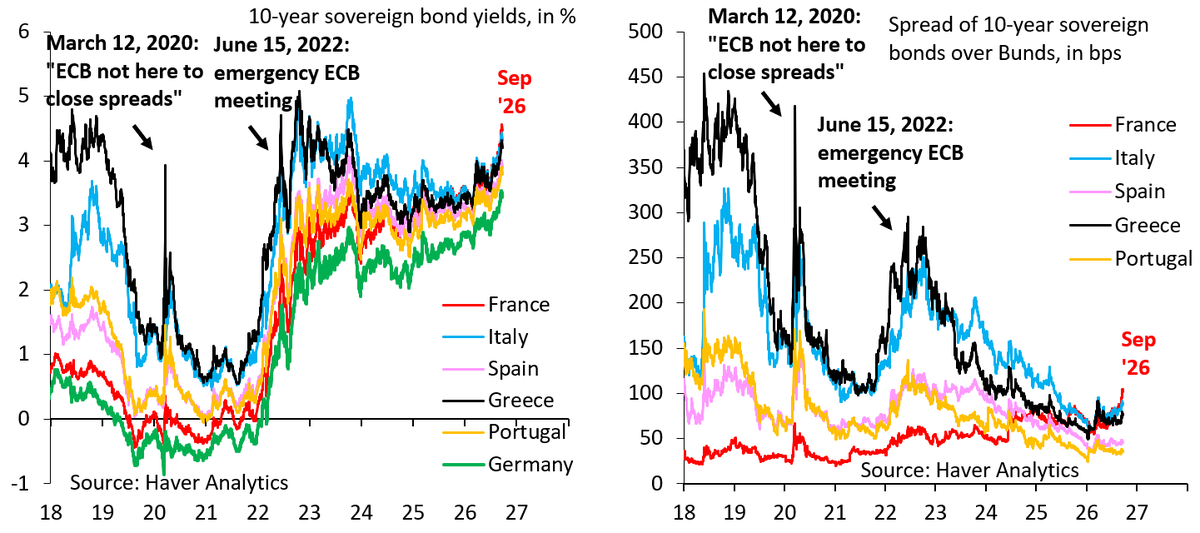
10-year euro-area yields and spreads over Bunds | Yields near 4%, France's spread up to ~100 bps
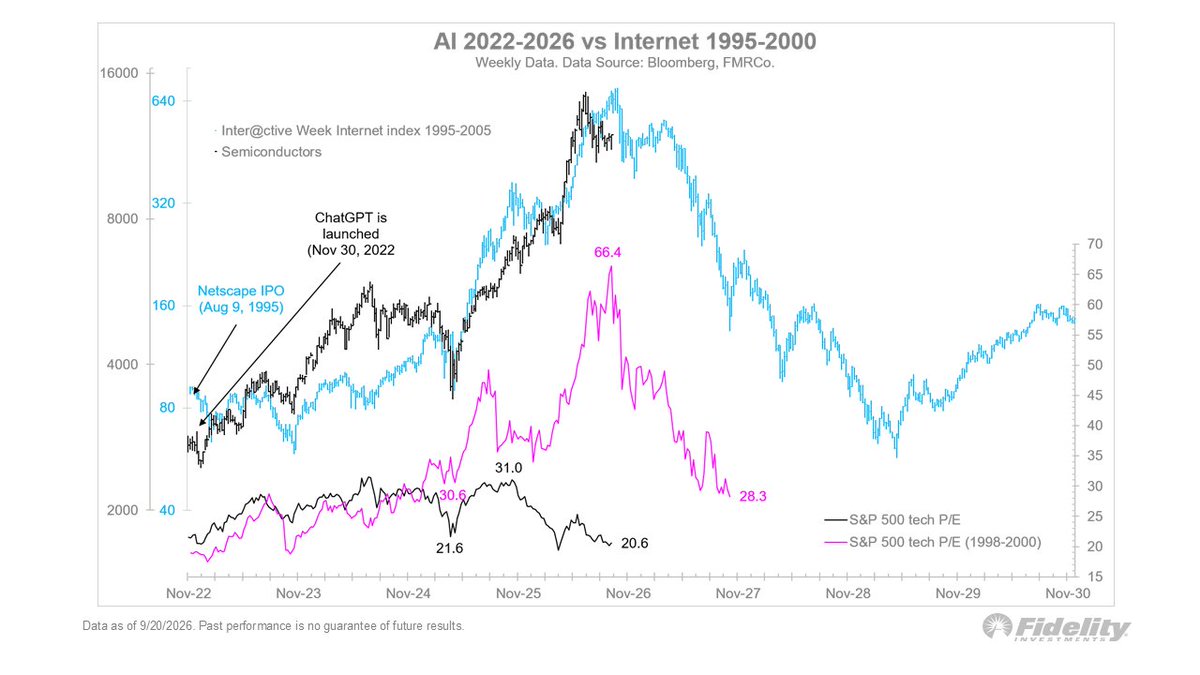
AI semiconductors 2022-2026 vs the internet index 1995-2000, weekly | The price path closely rhymes, yet S&P tech P/E is ~20.6 now versus the 66.4 dotcom peak
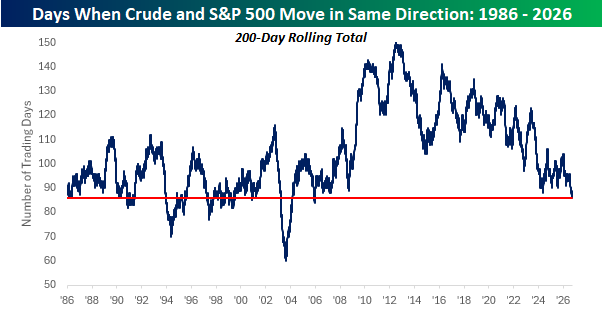
Days when crude and the S&P 500 move in the same direction, 200-day rolling total, 1986-2026 | Recently down to ~85, the fewest since 2008, signaling weaker co-movement
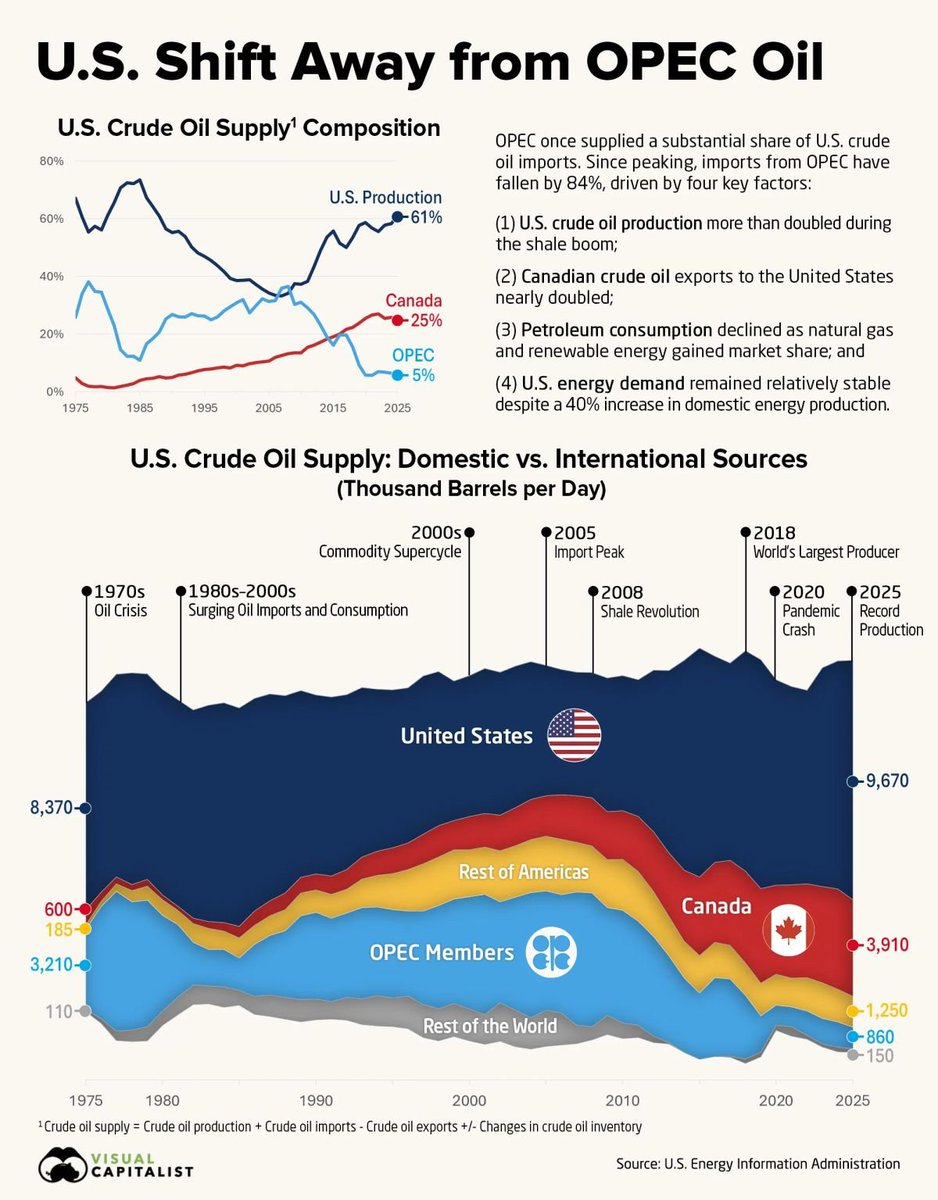
US crude oil supply composition, 1975-2025 | OPEC's share has fallen 84% from its peak to 5%, while US production is 61% and Canada 25%
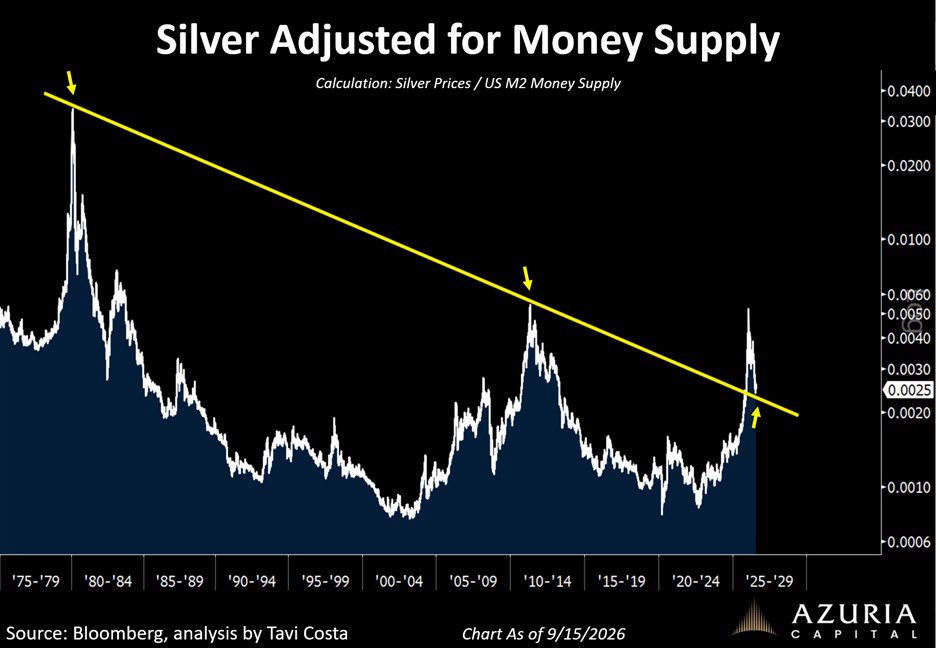
Silver price divided by US M2 money supply, 1975-2026 | The ratio has broken its post-1980 downtrend line to ~0.0025, retesting former resistance that now acts as support
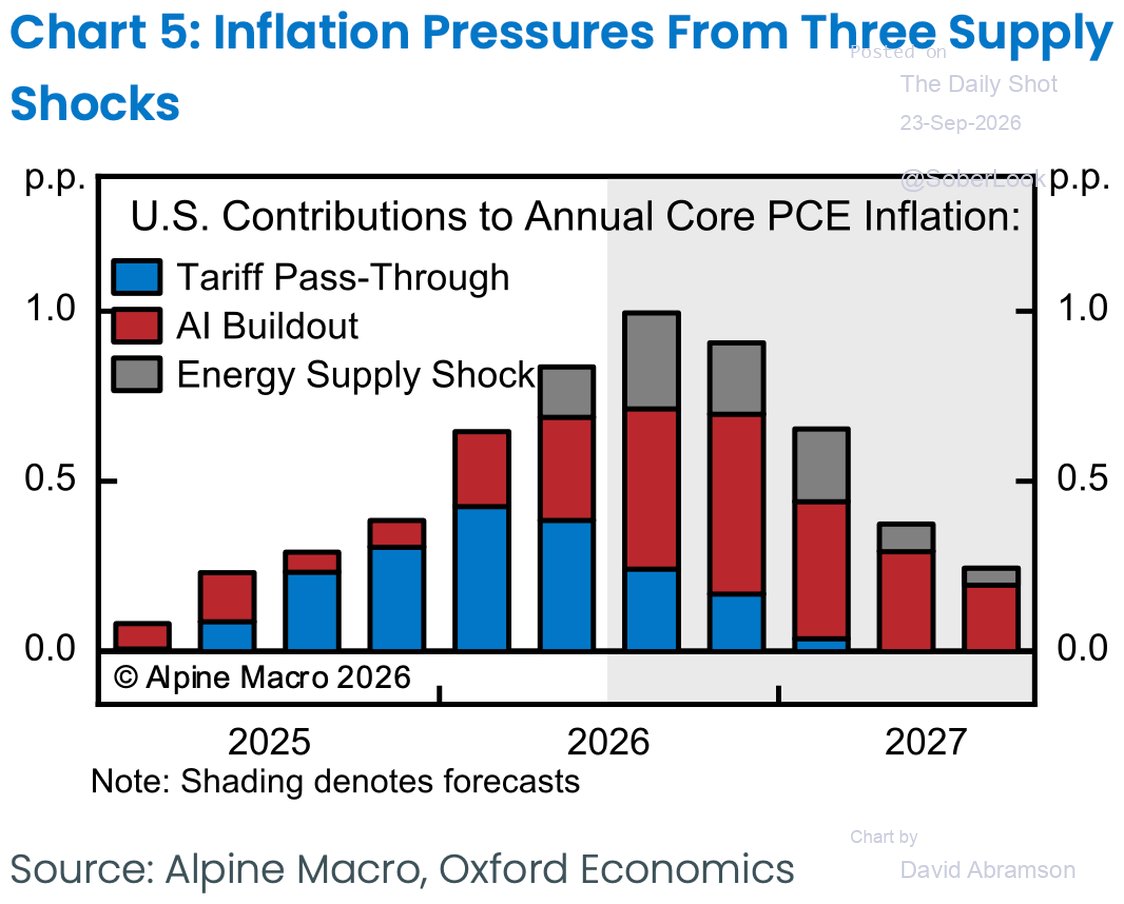
US contributions to annual core PCE inflation, 2025-2027 | The three supply shocks peak at ~1.0pp in 2026, easing to ~0.25pp by end-2027
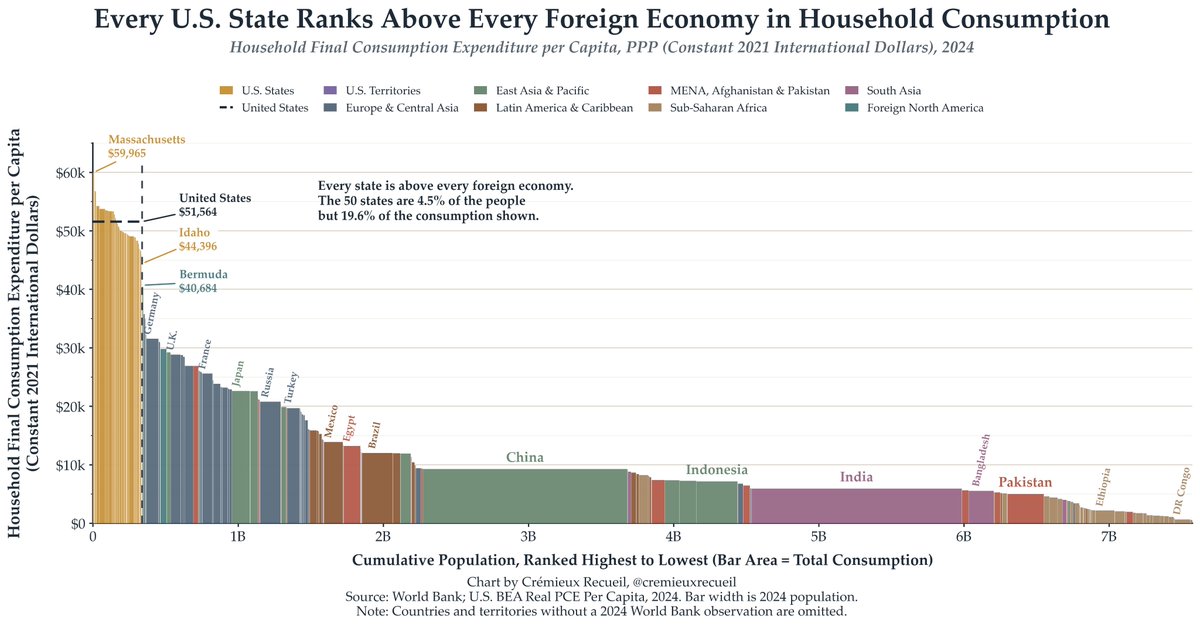
Household consumption per capita vs population, 2024 PPP | US states are 4.5% of people but 19.6% of consumption, each above every foreign economy
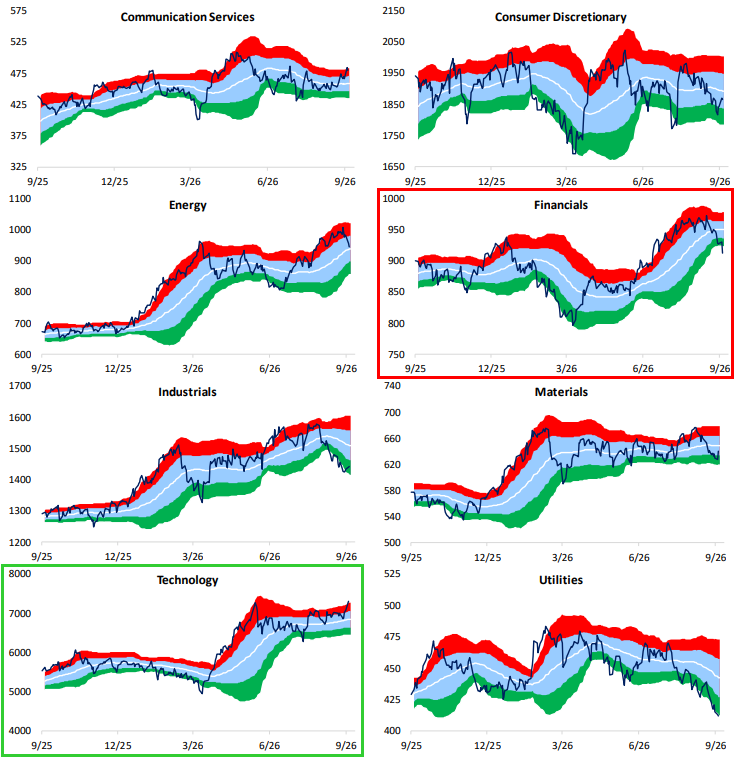
S&P 500 sector prices against their overbought/oversold bands, past year | Technology breaks above its overbought zone to a record while Financials fall into extreme oversold
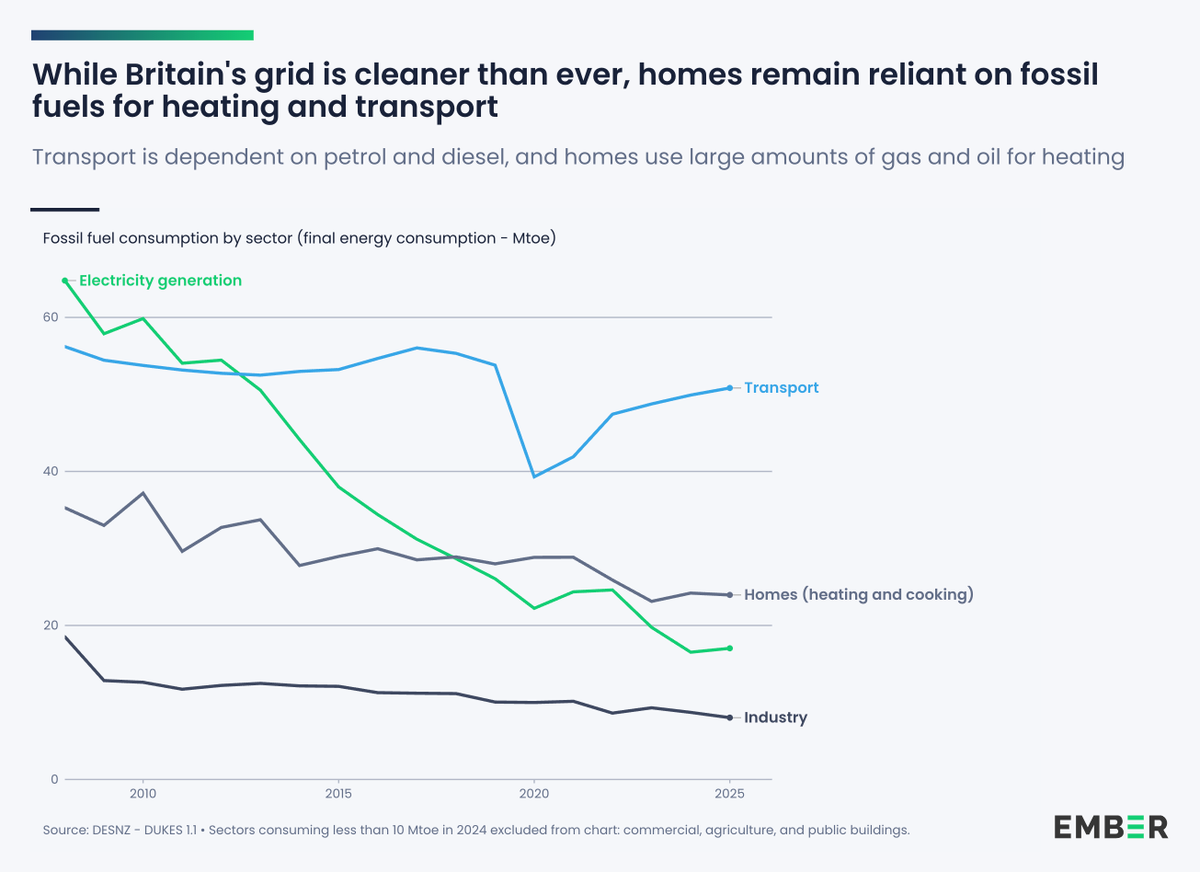
UK fossil-fuel final energy consumption by sector (Mtoe), 2008-2024 | Power-sector use falls from ~65 to ~17 Mtoe; transport is now the largest at ~50, home heating ~24
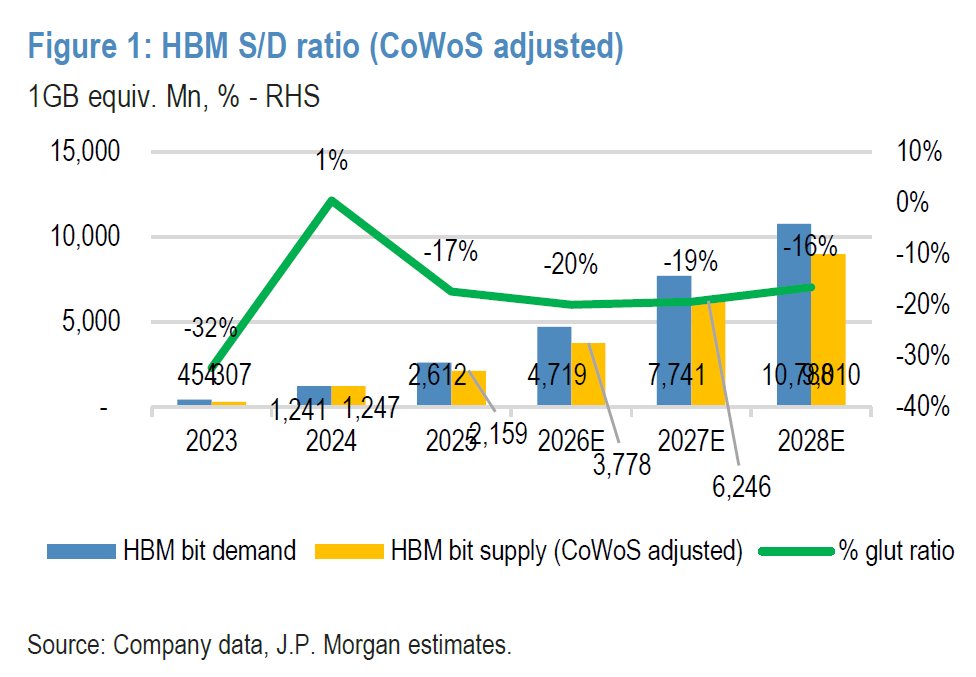
HBM bit supply/demand and glut ratio, 2023-2028E | Deficit of -20% in 2026E, -19% in 2027E, -16% in 2028E, a persistent shortage
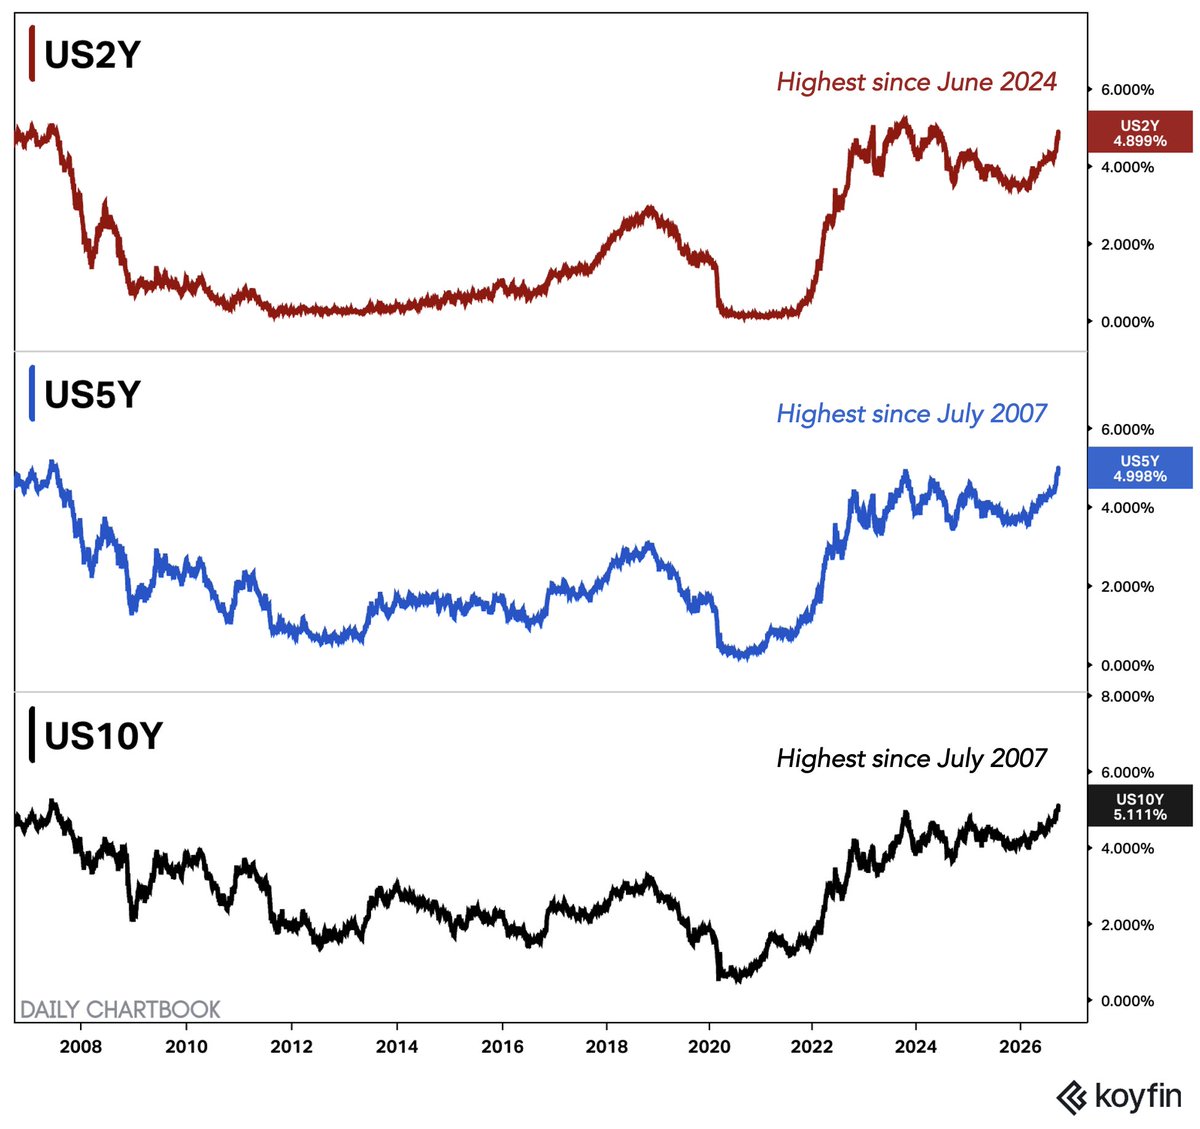
US 2Y, 5Y and 10Y Treasury yields, long-term | 5Y at 4.998% and 10Y at 5.111%, highest since July 2007; 2Y at 4.899%, highest since June 2024
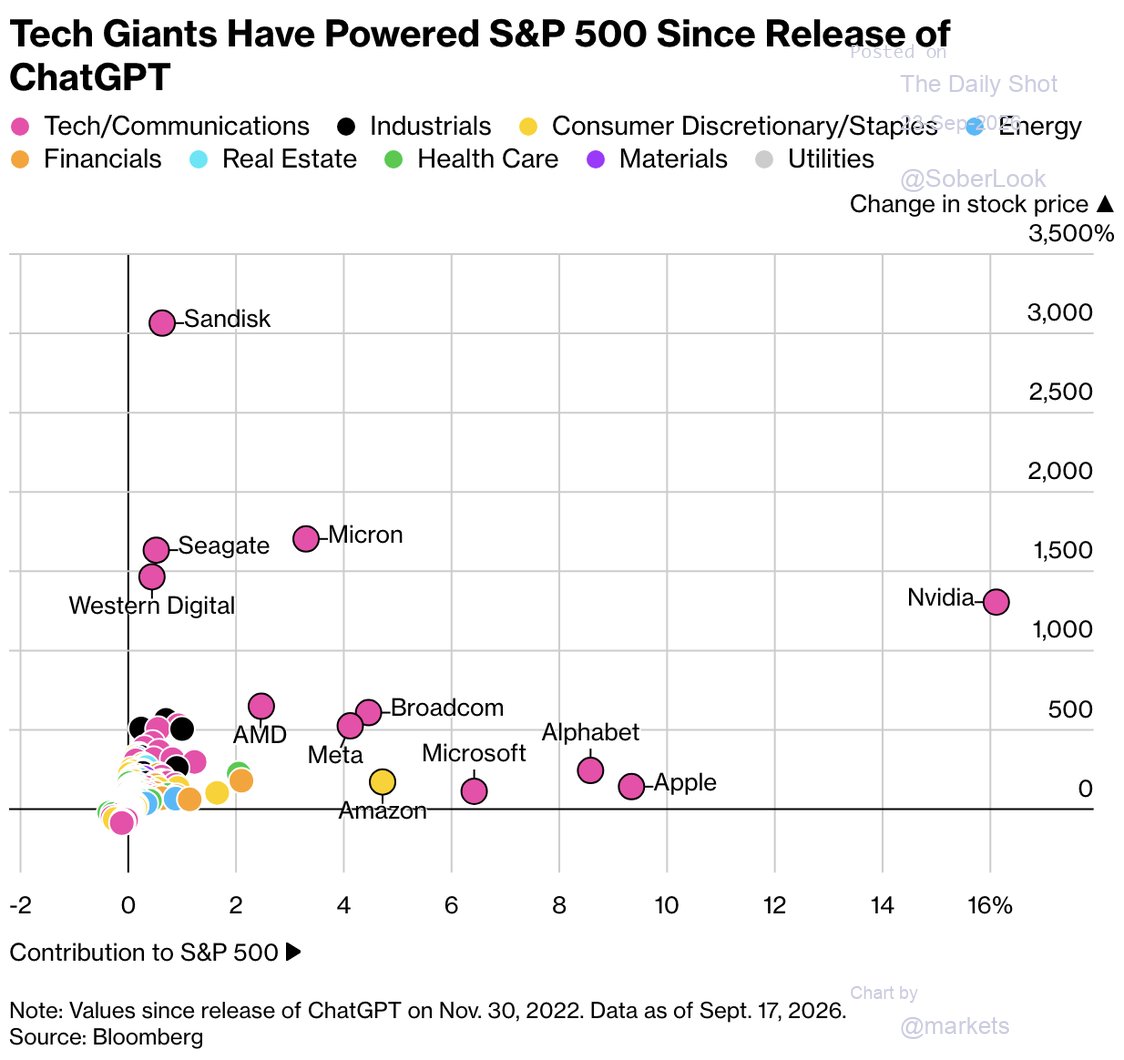
Stock contribution to the S&P 500 vs price change since Nov 2022 | Nvidia leads with the biggest contribution and SanDisk up nearly 3,000%, AI names dominate
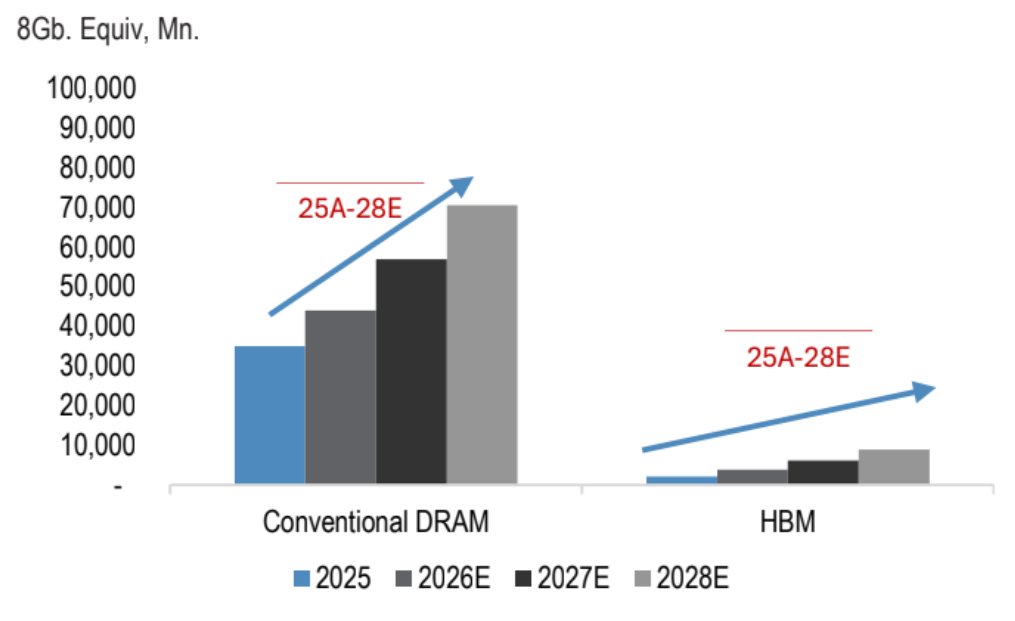
Conventional DRAM vs HBM bit demand, 2025-2028E (mn 8Gb-eq) | Conventional DRAM from ~35bn to ~71bn by 2028E, HBM growing off a low base
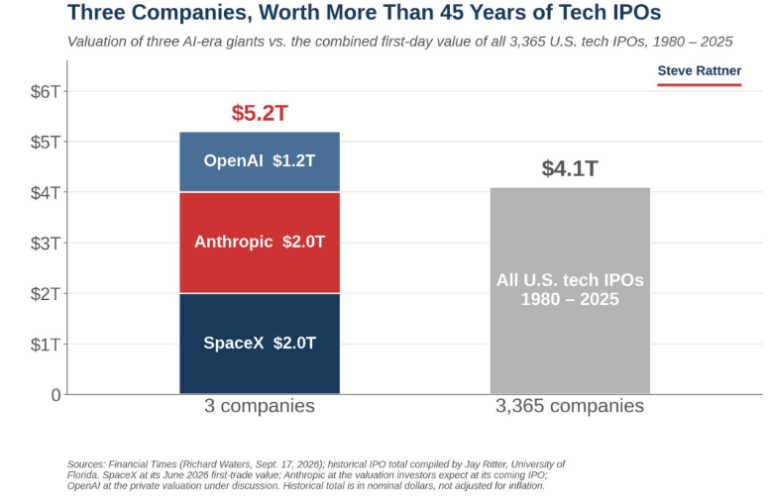
Valuation of 3 AI-era giants vs 3,365 US tech IPOs (USD tn) | OpenAI+Anthropic+SpaceX total $5.2T, above the $4.1T first-day value of all 1980-2025 tech IPOs
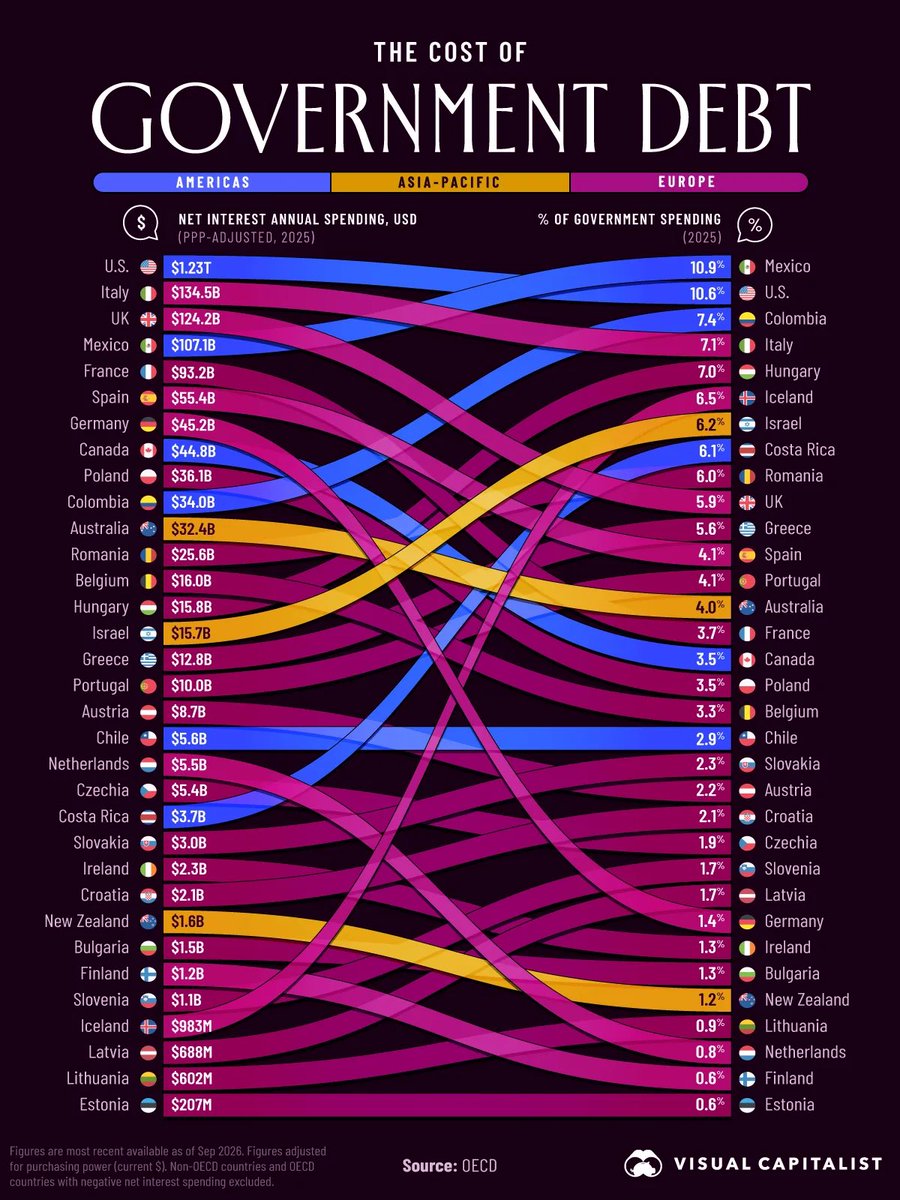
Government net interest spending and its share of government spending by country, 2025 | The US tops absolute spending at $1.23T; as a share, Mexico leads at 10.9% and the US at 10.6%
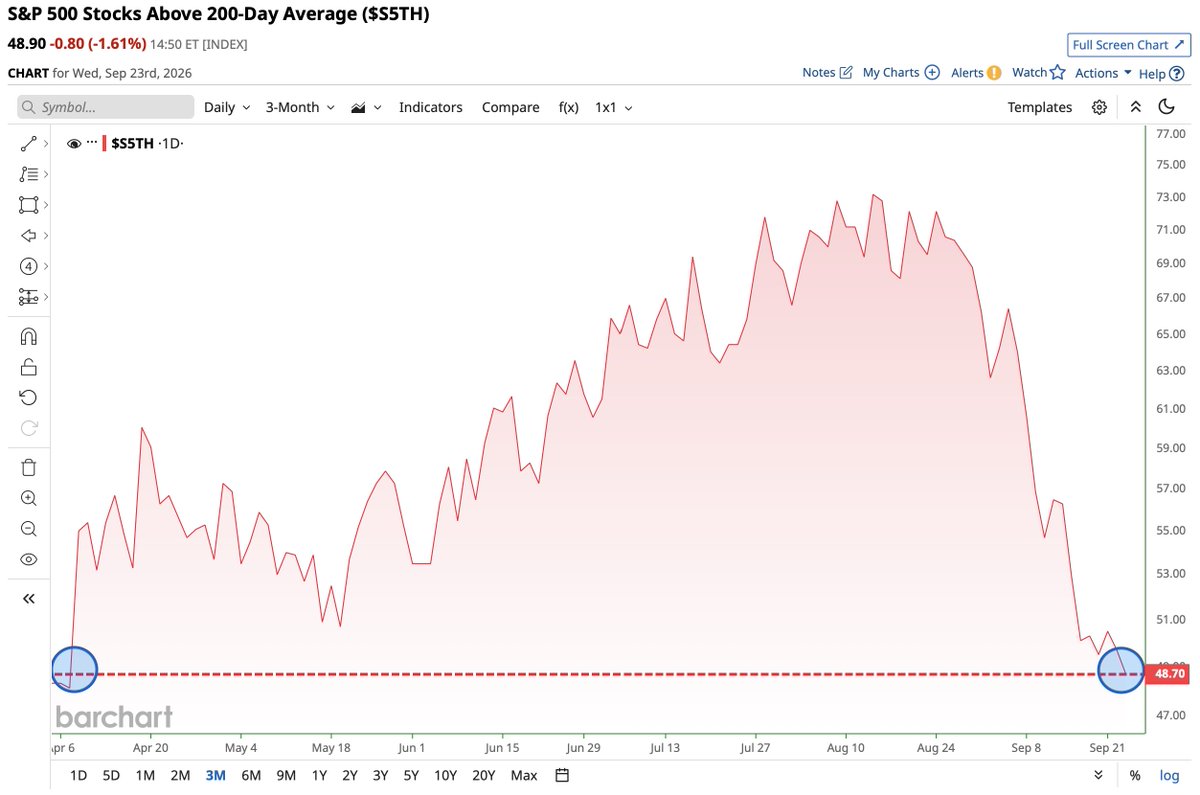
Percent of S&P 500 members above their 200-day moving average, past 3 months | Now 48.9%, down from over 73% in August, with more than half below the line
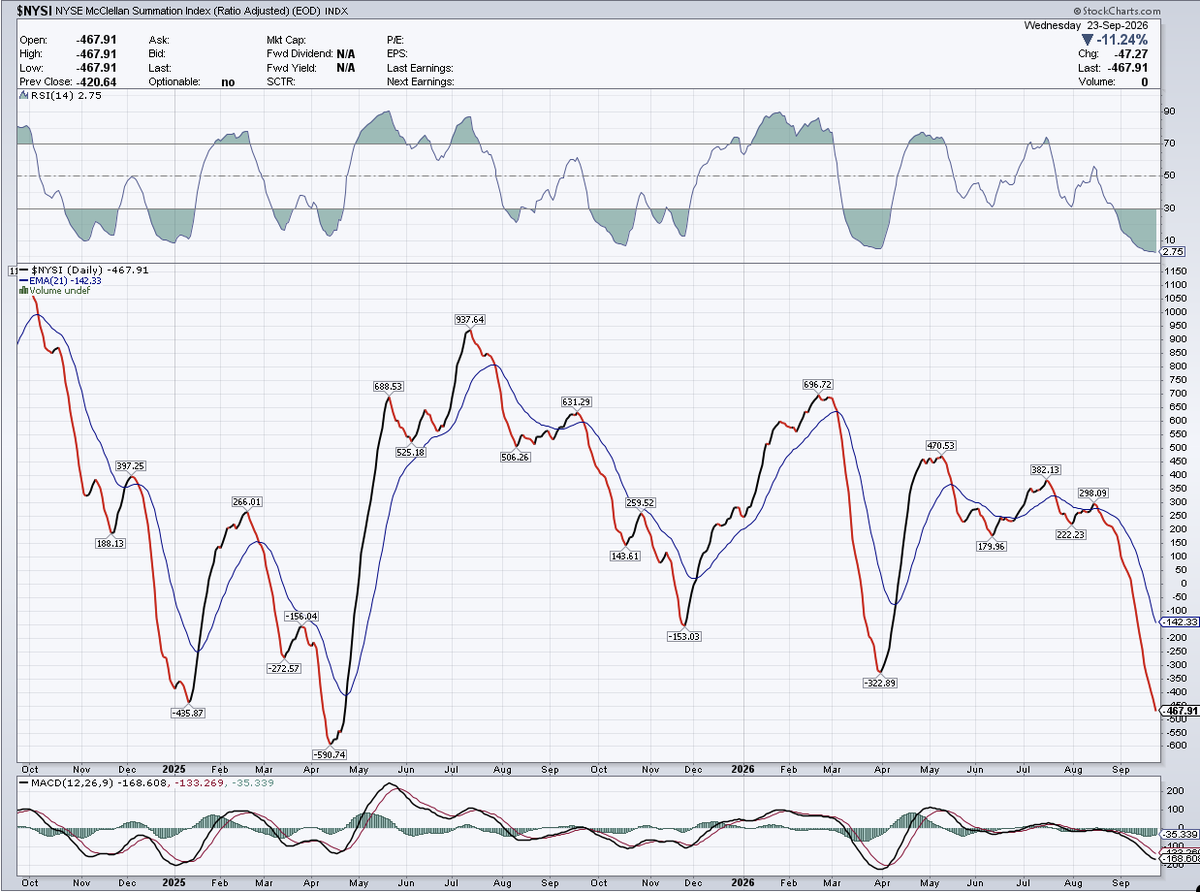
NYSE McClellan Summation Index ($NYSI) | Down to -468 at a new low, with RSI at just 2.75
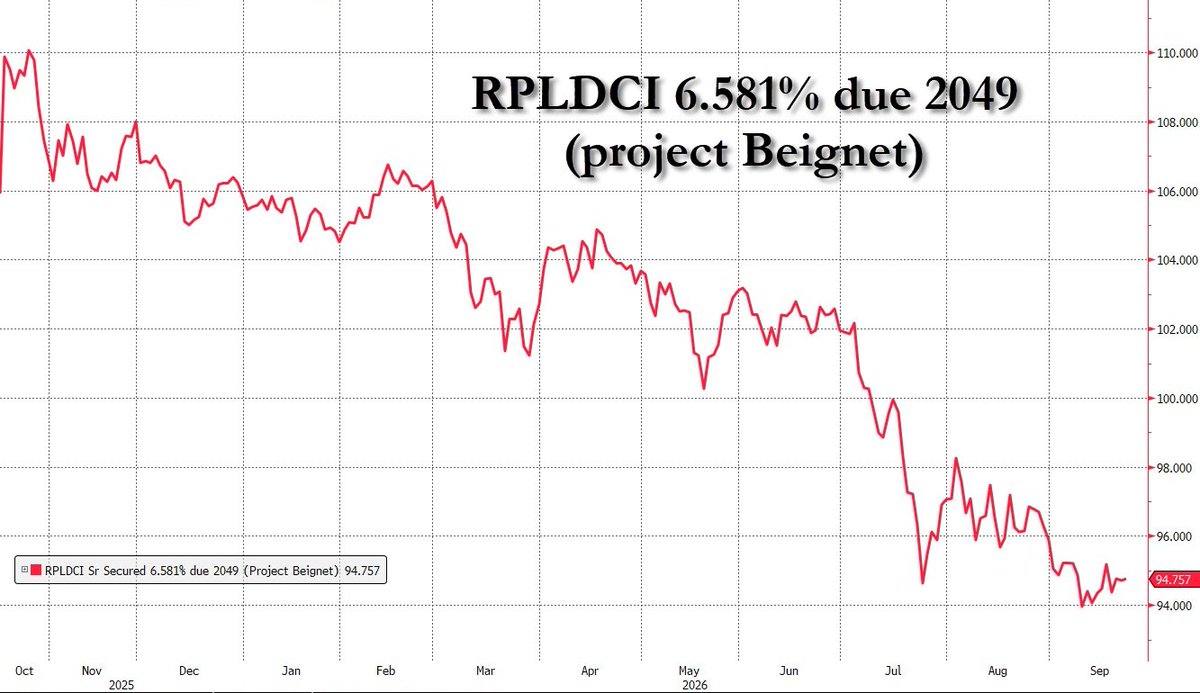
Price of the Meta Hyperion-linked bond, 6.581% due 2049 | Down to 94.76, an all-time low
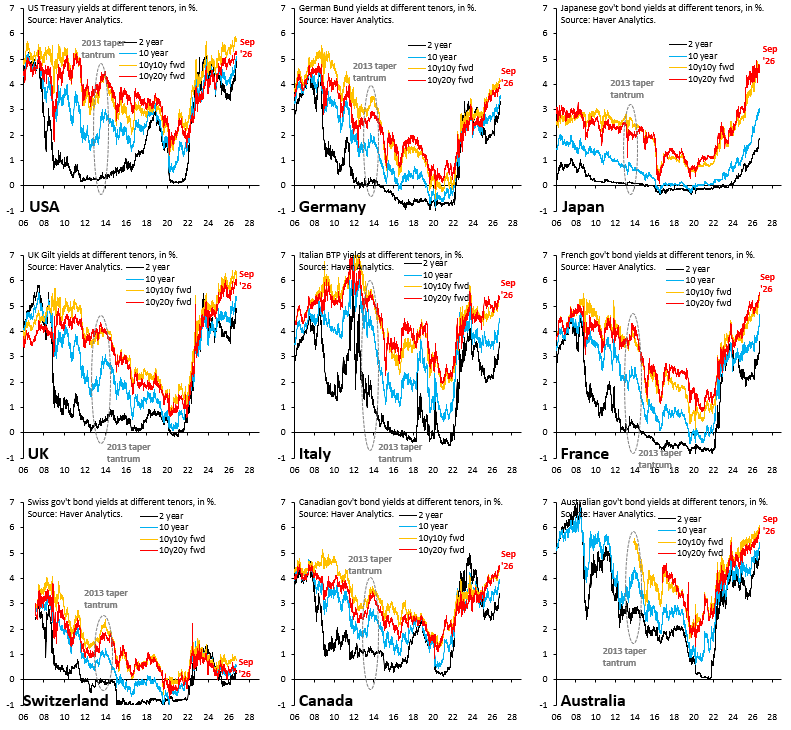
Sovereign yields by tenor for nine economies, 2006-2026 (%) | US, Germany, Japan, UK, Italy, France and others all higher into Sep 2026
Core PCE inflation and temporary-factor contributions, 2025-2027E (%, ppt) | Tariff, energy/Iran and software effects peak and fade as GS sees core PCE easing faster
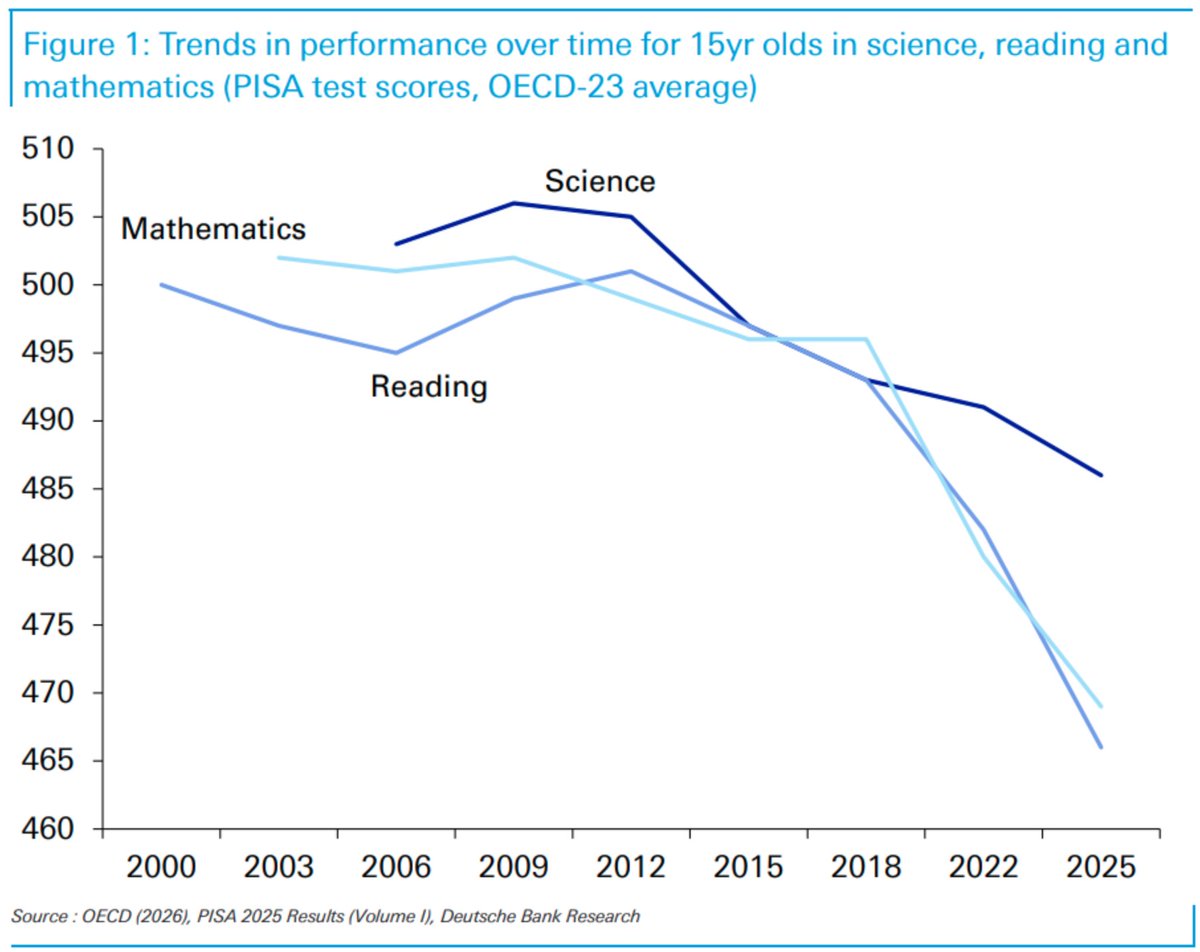
OECD-23 average PISA scores for 15-year-olds in science, reading and mathematics, 2000-2025 | In 2025 math falls to 466, reading 469 and science 486, all record lows
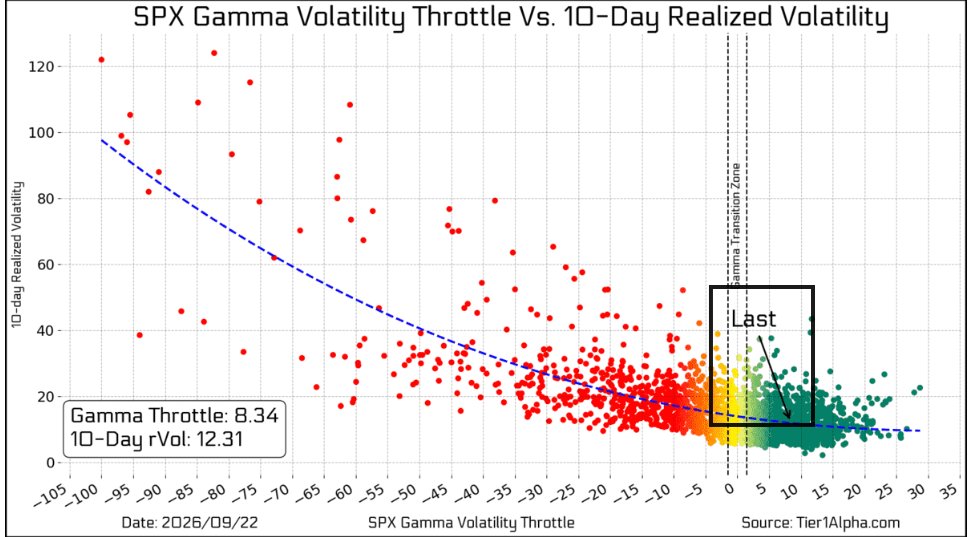
SPX gamma volatility throttle vs 10-day realized volatility, Sept 22, 2026 | Latest throttle at +8.34 with realized vol of 12.31, on the suppression curve that dampens index moves
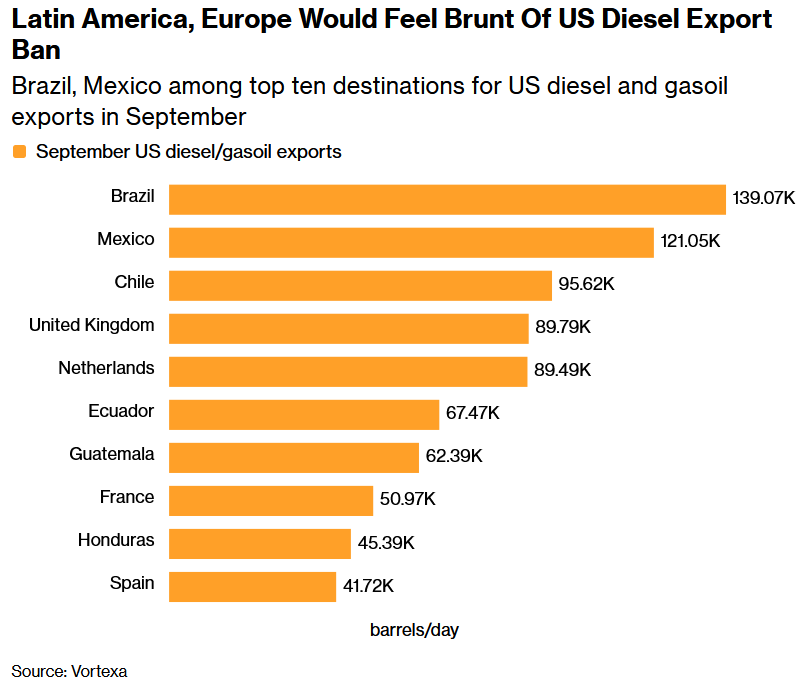
Top ten destinations for US diesel/gasoil exports, September (barrels/day) | Brazil at 139K b/d and Mexico at 121K lead, with Latin America and Europe dominating the list
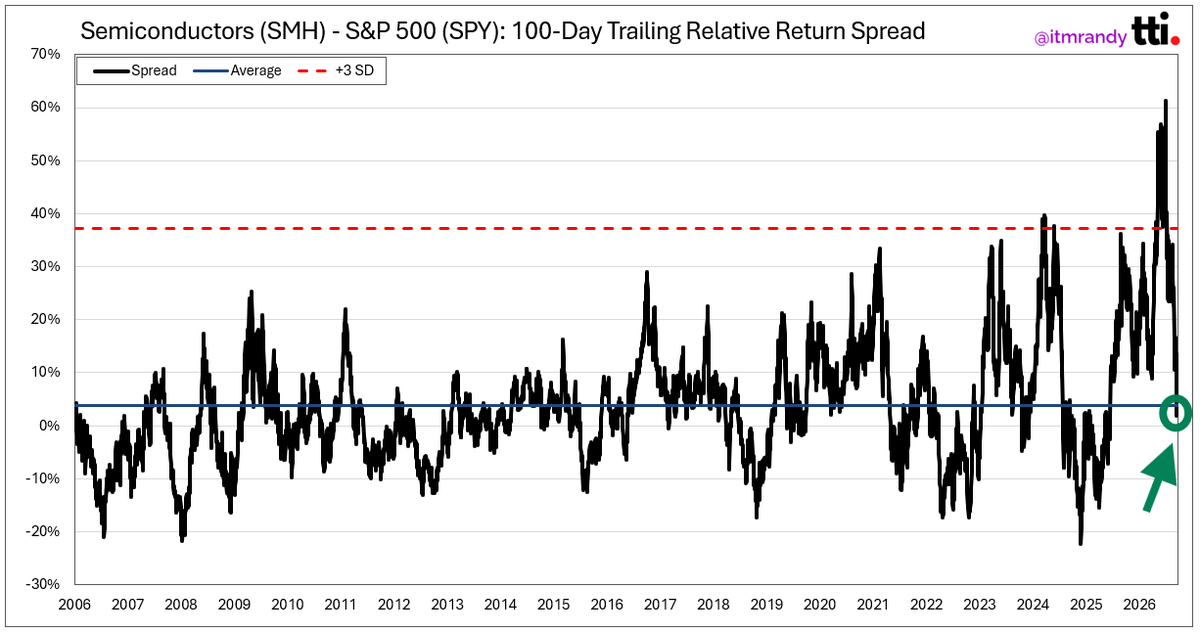
SMH-SPY 100-day trailing relative return spread | Down from a +3 SD extreme in May to below its 20-year average
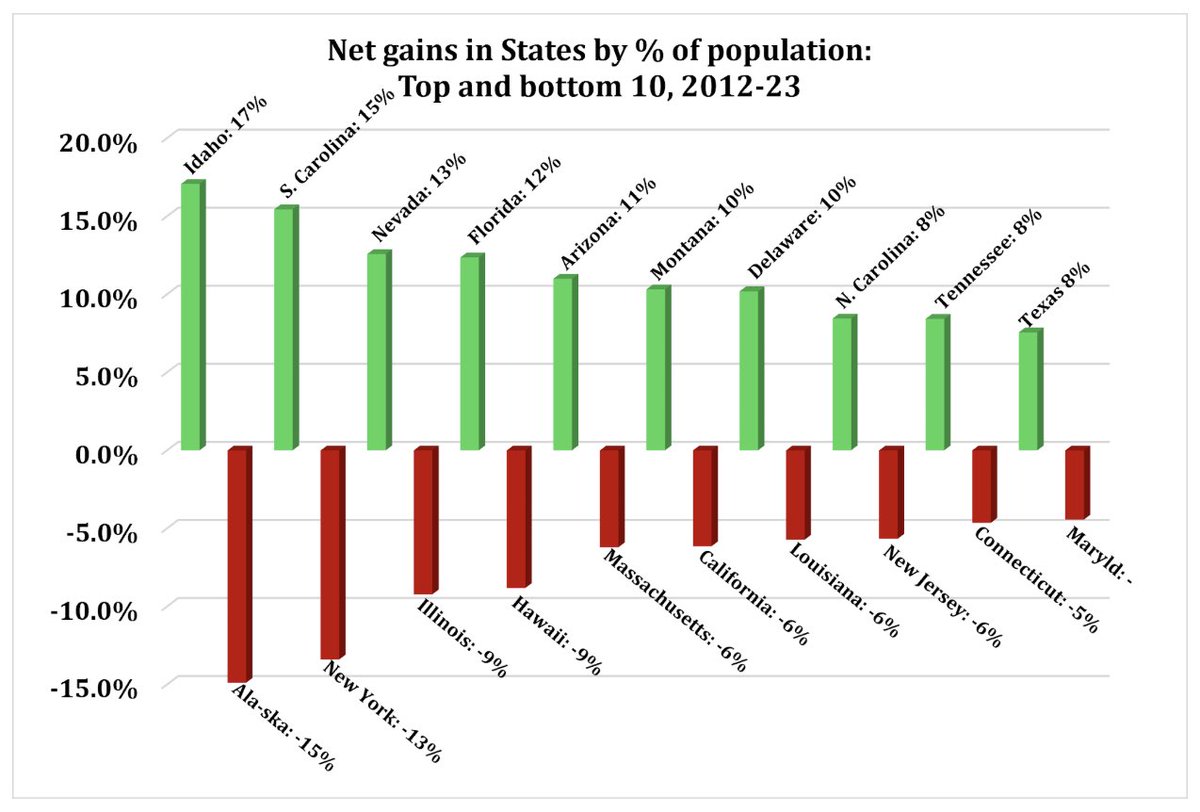
Net population change by state as % of population, top and bottom 10, 2012-2023 | Idaho +17%, South Carolina +15% and Nevada +13% lead; Alaska -15% and New York -13% lose most
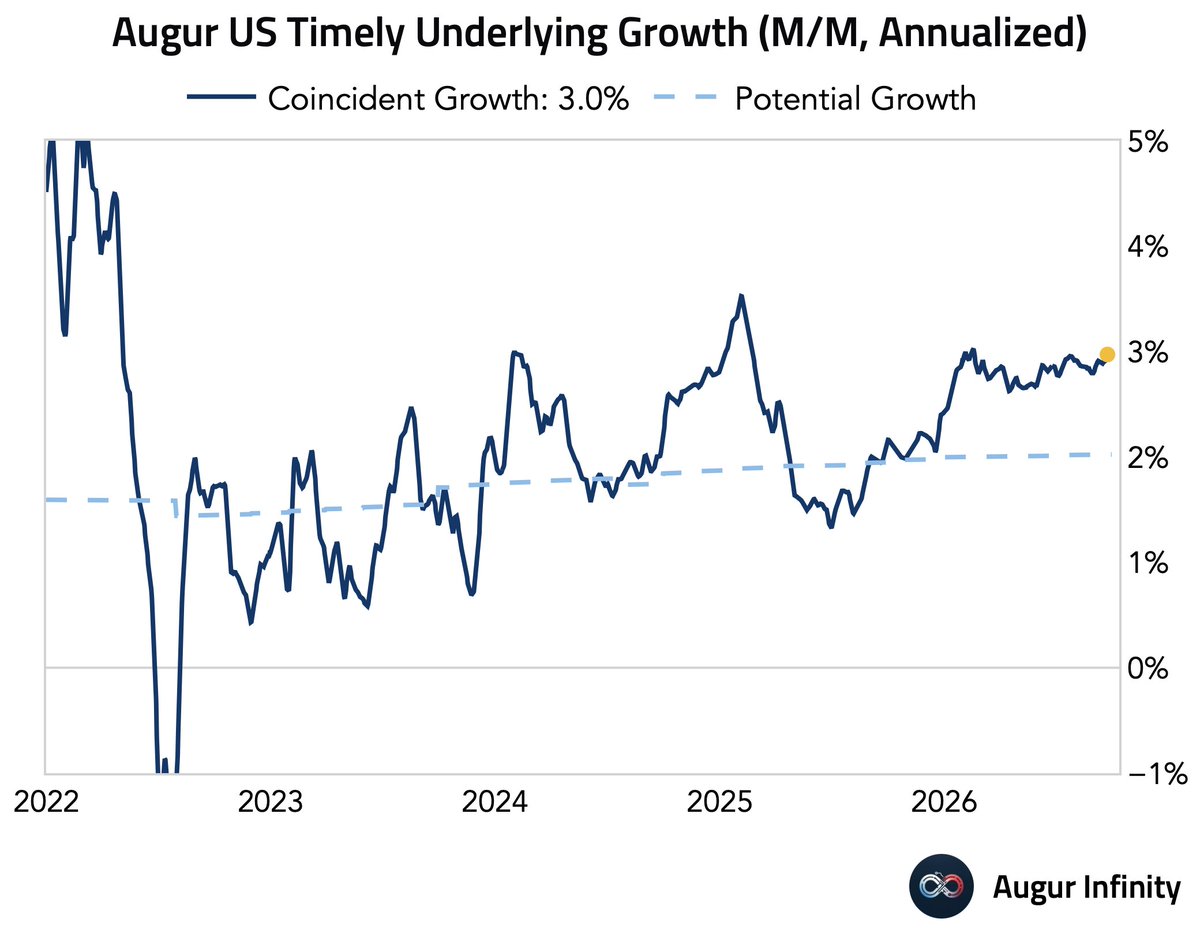
Augur US timely underlying growth (M/M annualized), 2022-2026 | Coincident growth rises to 3.0%, above potential growth of ~2%, signaling above-trend momentum
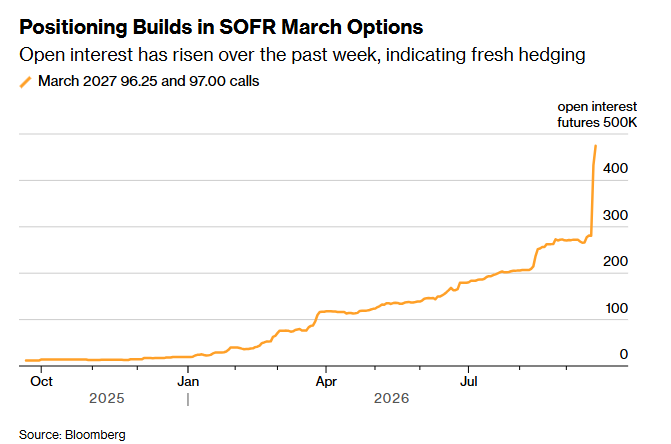
Open interest in March 2027 SOFR calls | Jumps to ~470k over the past week, signaling fresh hedging
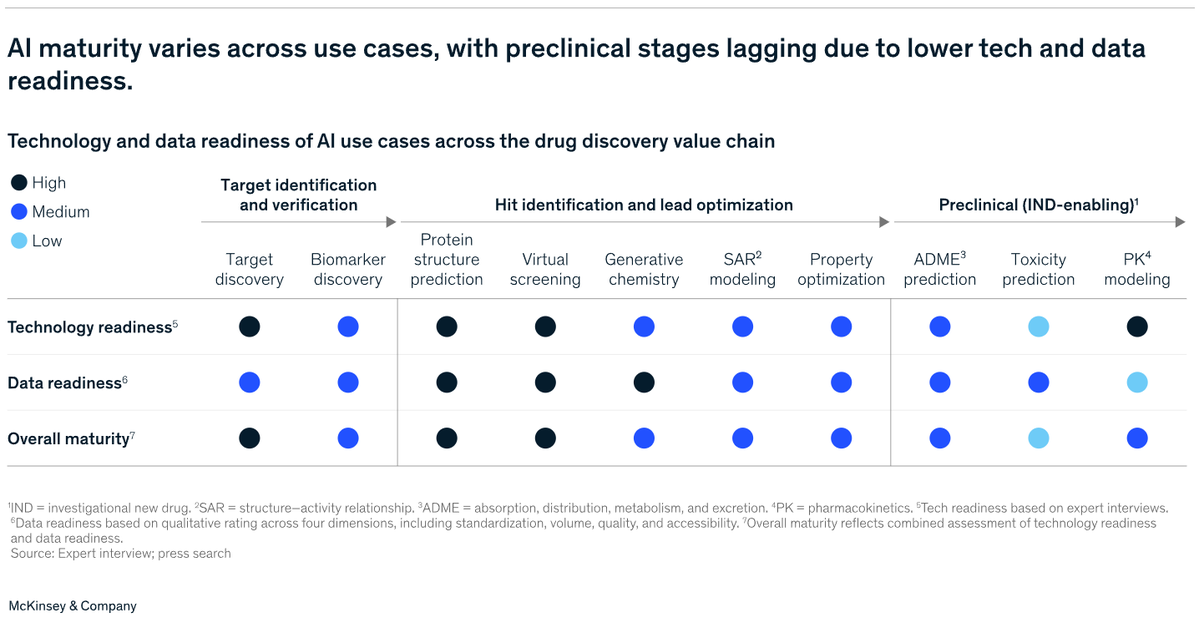
Technology and data readiness of AI use cases across the drug-discovery value chain (high/medium/low) | Target and hit-identification stages score higher, while preclinical toxicity and PK prediction lag
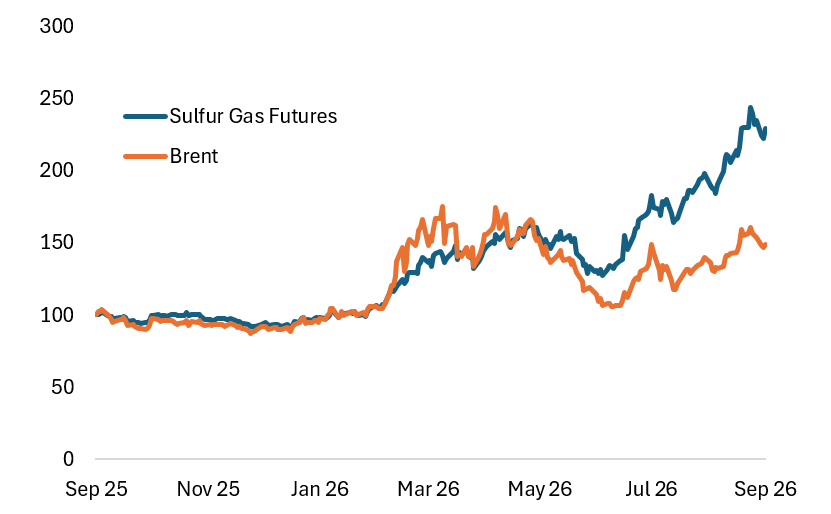
Sulfur gas futures vs Brent (indexed to 100) | Since Sept 2025 the former rose to ~225 vs Brent's ~150, a widening refined premium
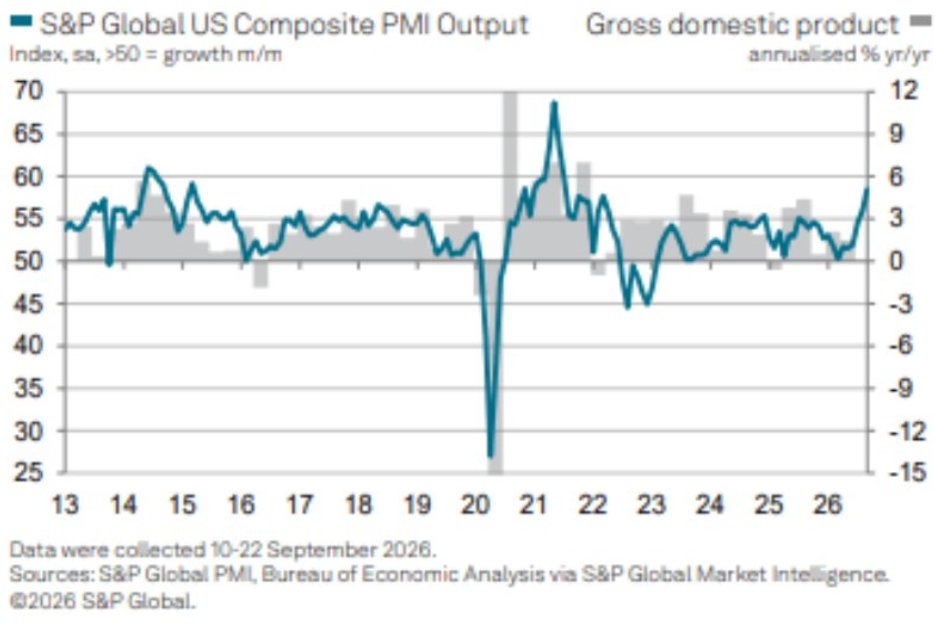
S&P Global US Composite PMI Output and GDP growth, 2013-2026 | PMI output rises to about 58.5, back to its highest since 2021, signaling faster expansion
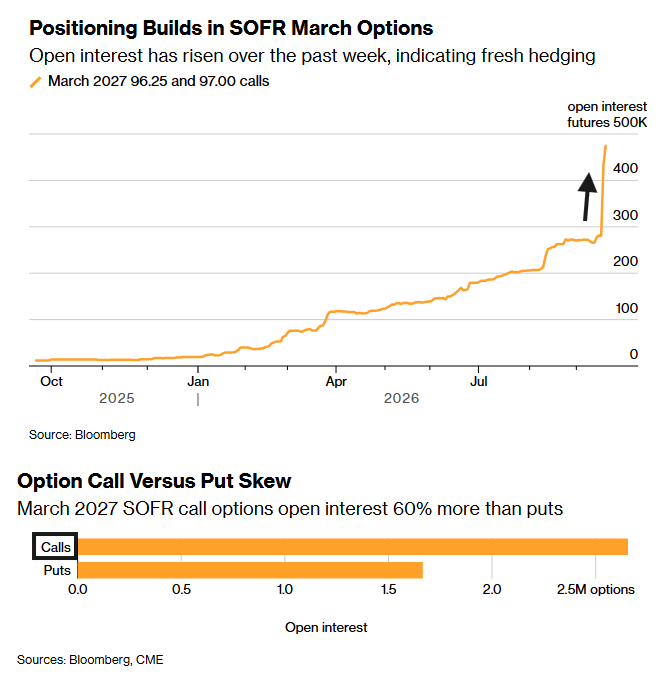
March 2027 SOFR options open interest and call/put skew | Call OI ~2.7M, about 60% above puts, hedging a shallower Fed path
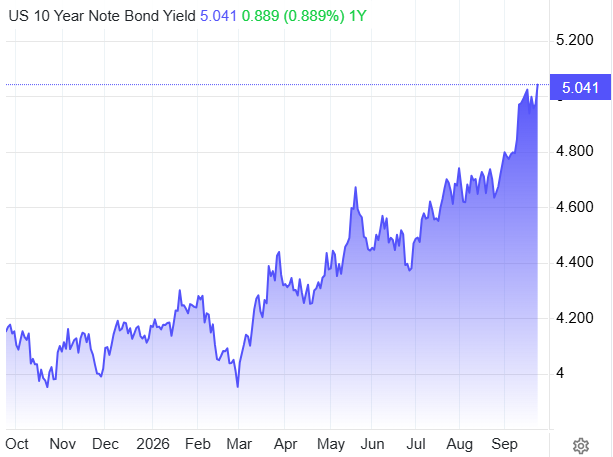
US 10-year Treasury yield, past year (%) | Now 5.041%, up ~0.89pp over the year, breaking above 5%
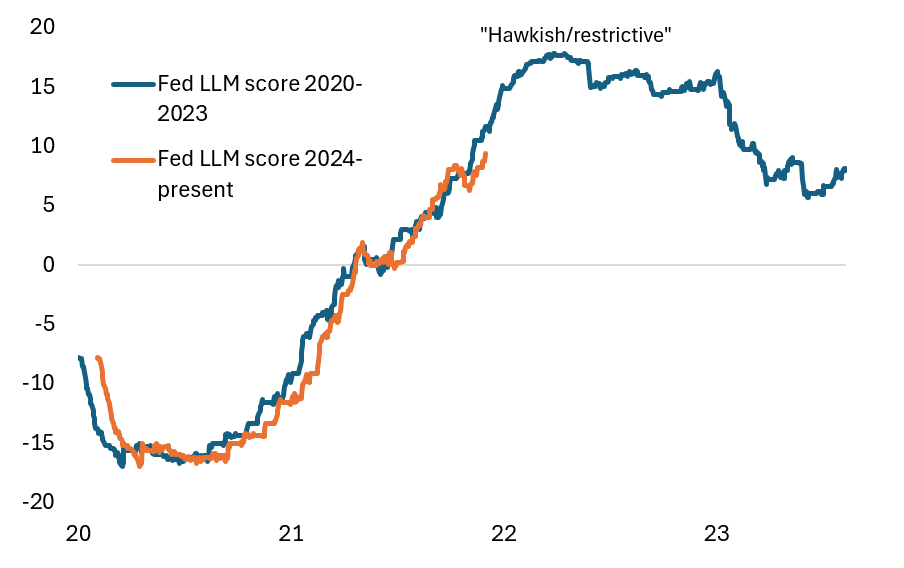
Fed hawkish/restrictive communication score, 2020-2023 vs 2024-present | The two cycles closely rhyme, with the score climbing off a ~-15 trough along a similar path
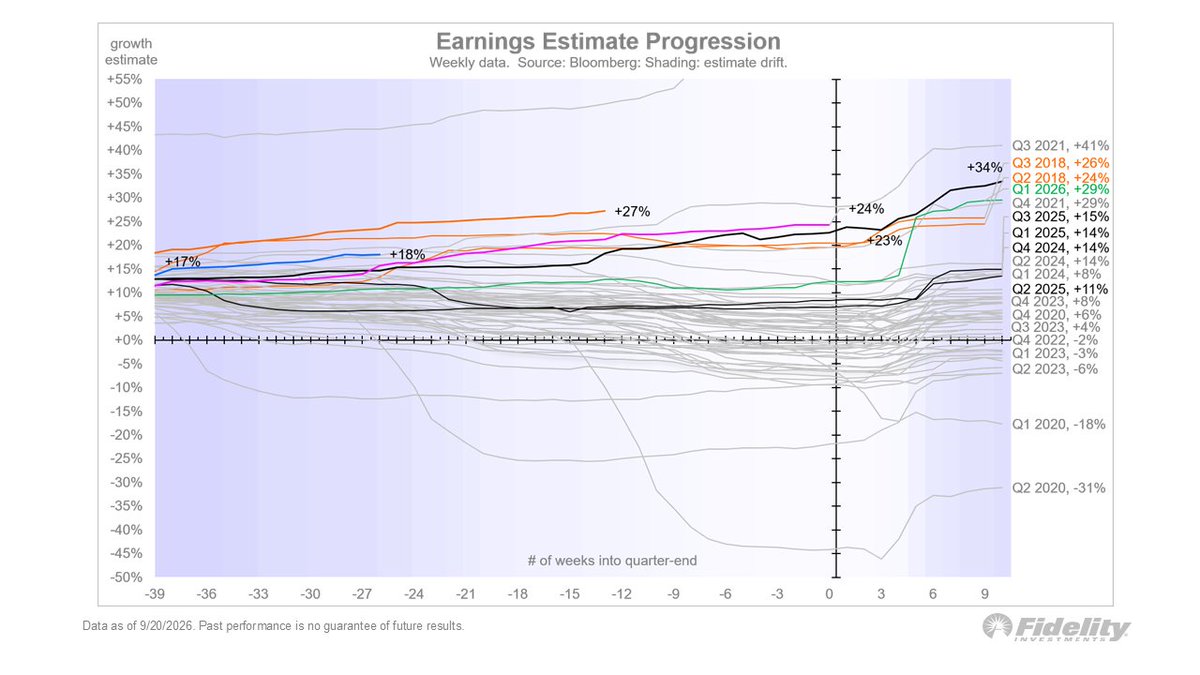
Quarterly earnings-growth estimates by weeks into quarter-end (weekly data) | Q3 holding near 24%, unlike the usual decline as the quarter closes
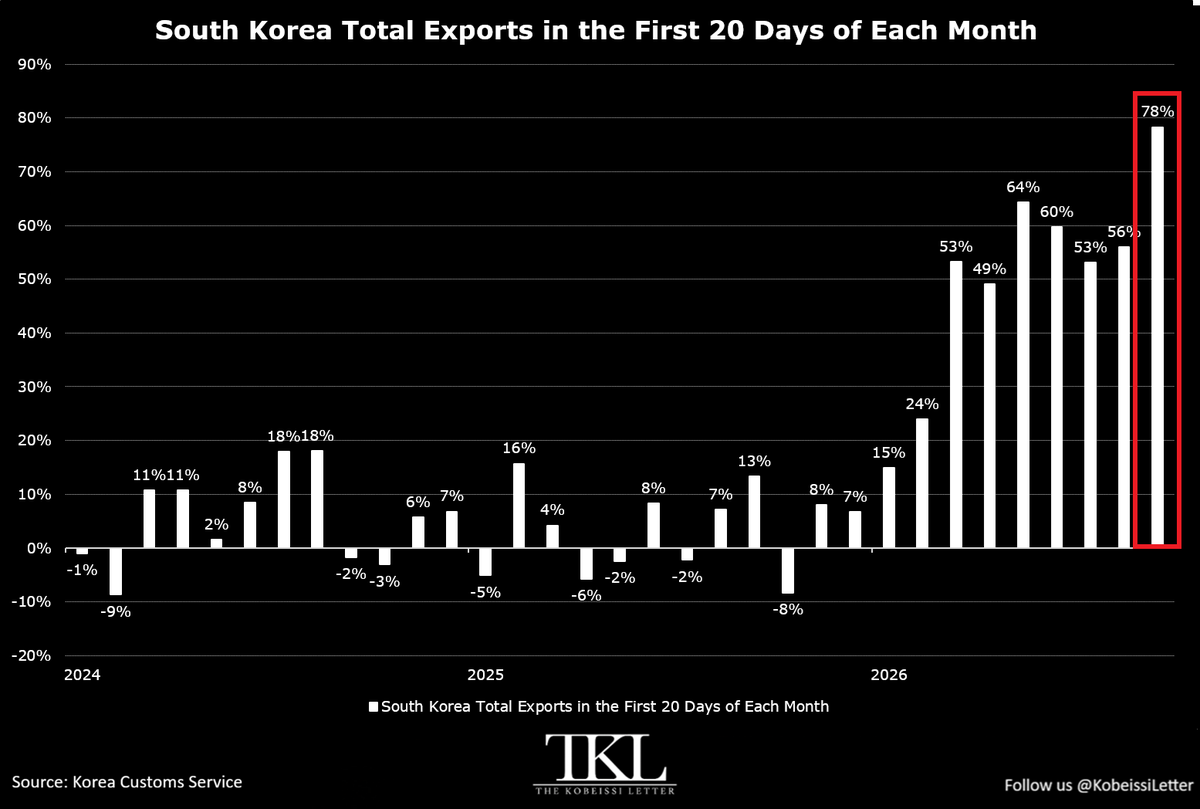
South Korea total exports, first 20 days of each month, YoY | ~+78% in September, the strongest on record and a fifth straight month above 50%
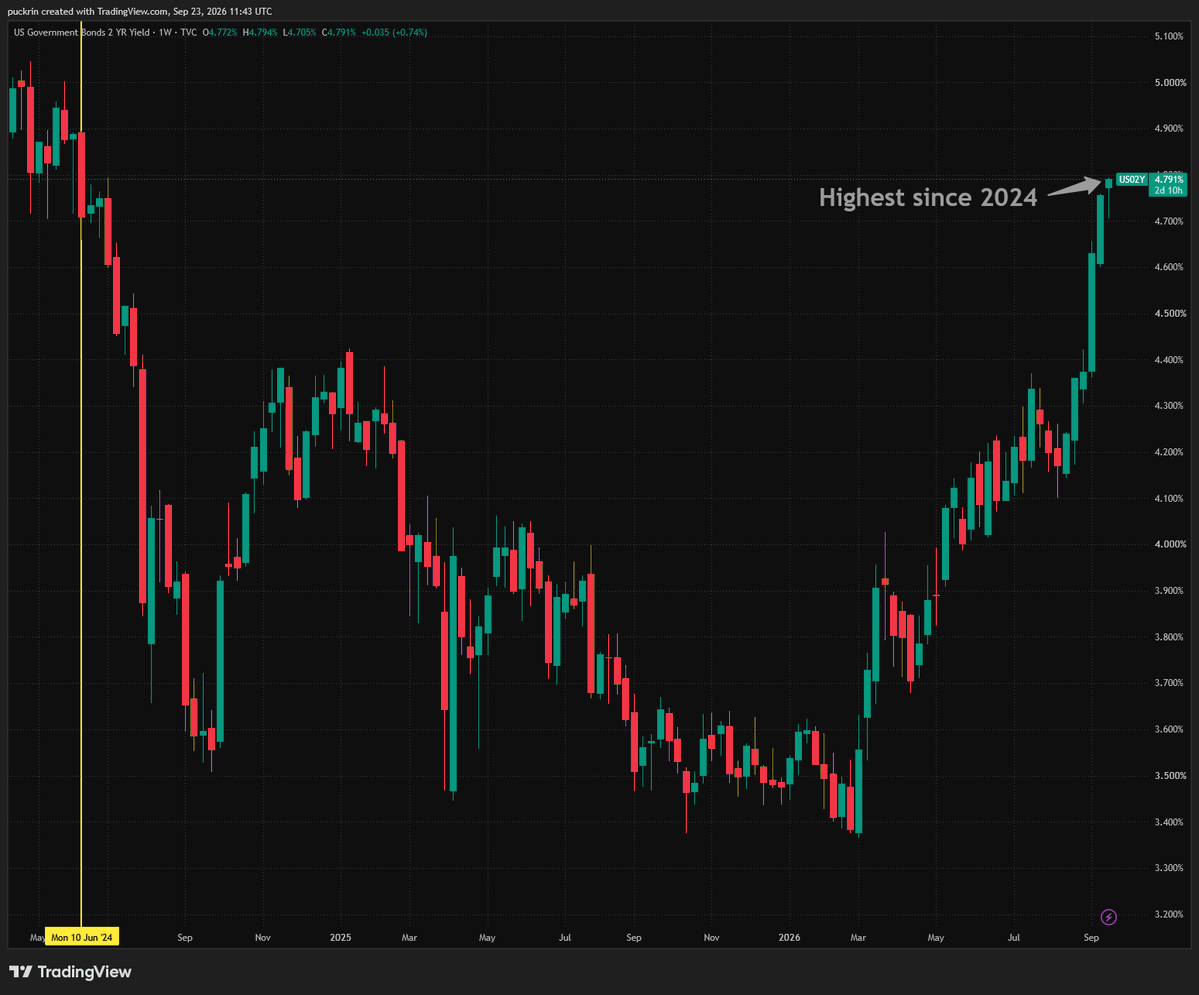
US 2-year Treasury yield, weekly | Breaks above 4.79%, the highest since 2024
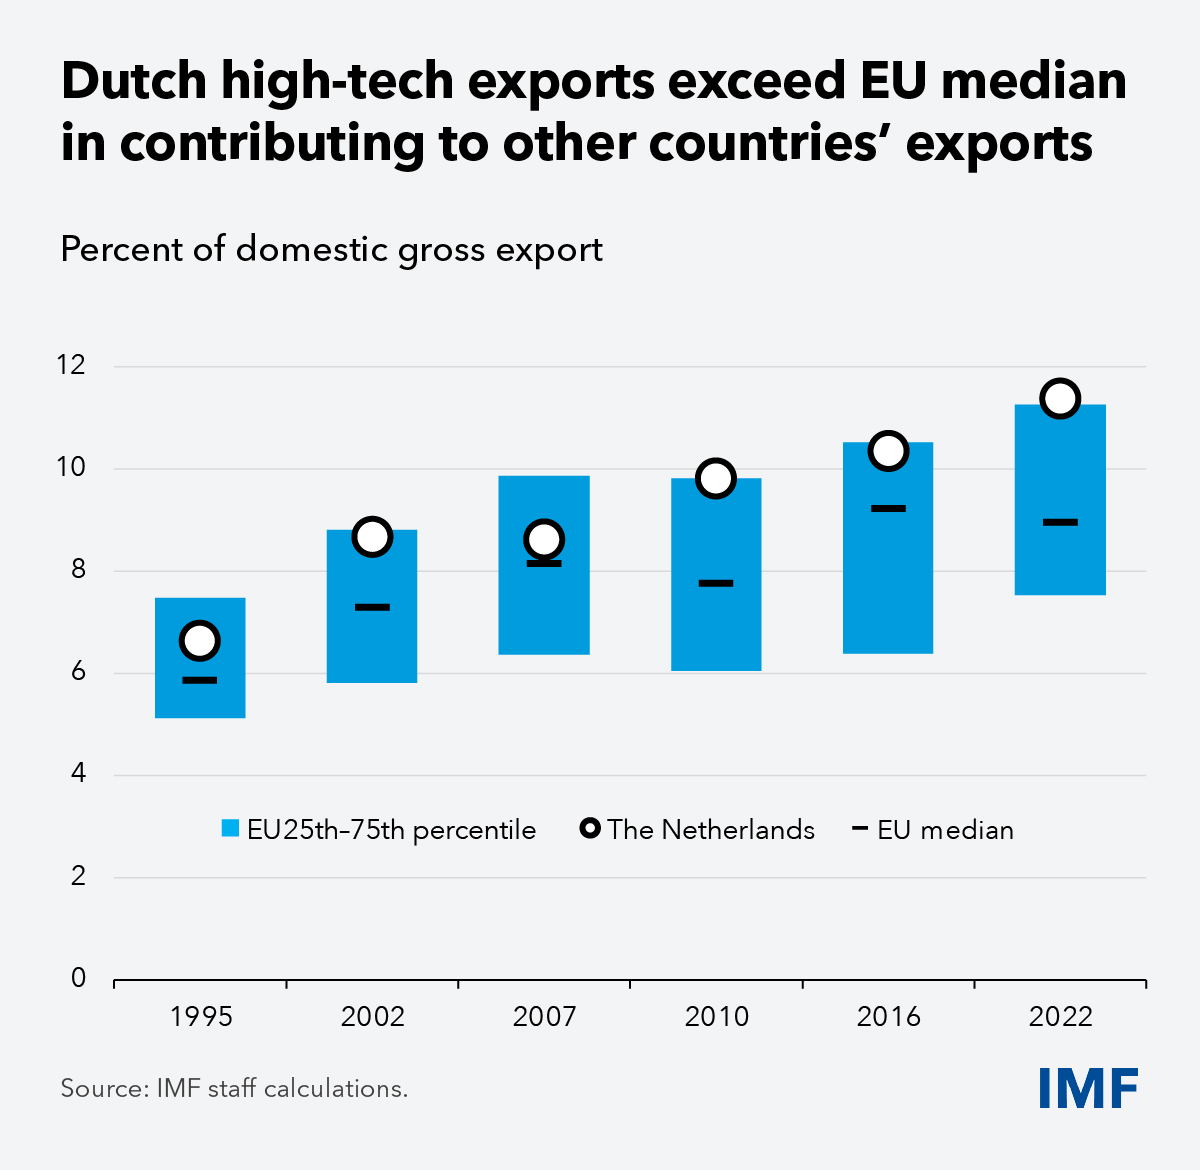
High-tech share of domestic gross exports, Netherlands vs EU, 1995-2022 | The Netherlands rises from ~6.5% in 1995 to ~11.3% in 2022, staying above the EU median of ~9%
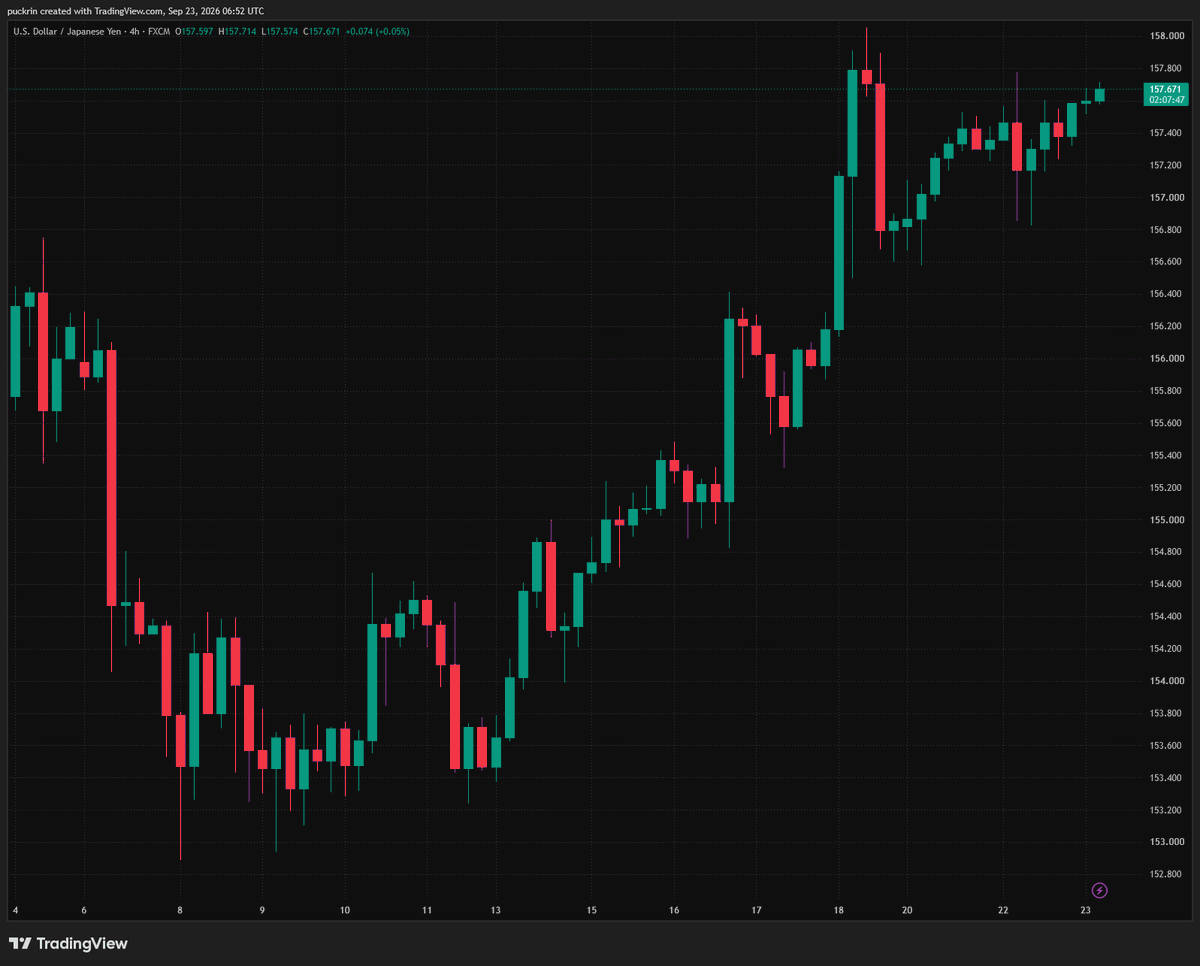
USD/JPY, 4-hour | Up from about 153 to roughly 157.7, with the yen weaker even after the BoJ rate hike
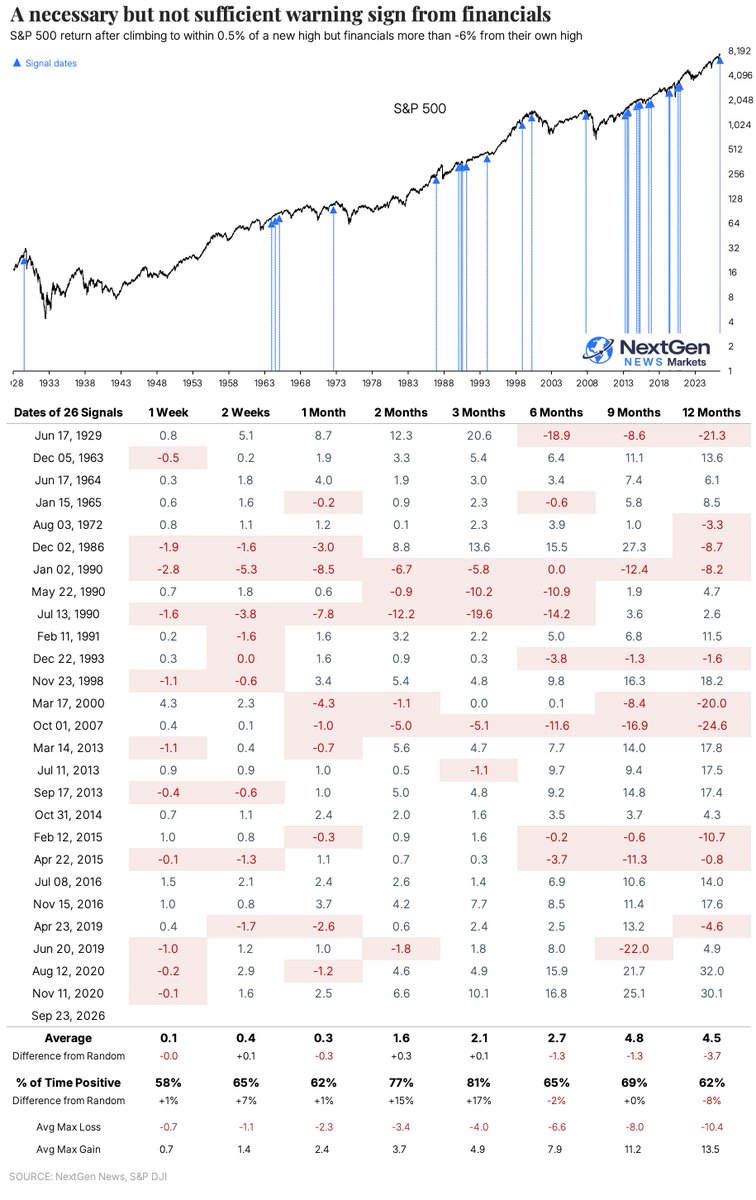
S&P 500 with financials-lagging warning dates since 1929 | After 26 signals the 12-month return averaged +4.5% with a 62% hit rate
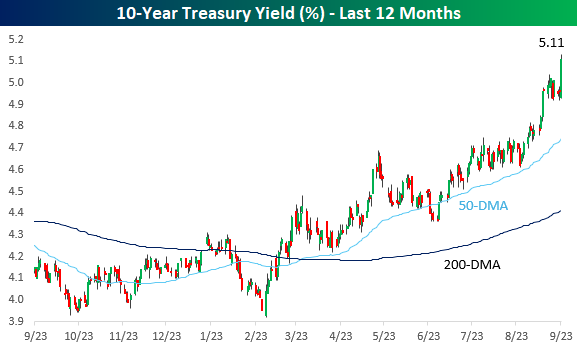
US 10Y Treasury yield, last 12 months with moving averages | Now 5.11%, above its 50- and 200-DMA at a range high
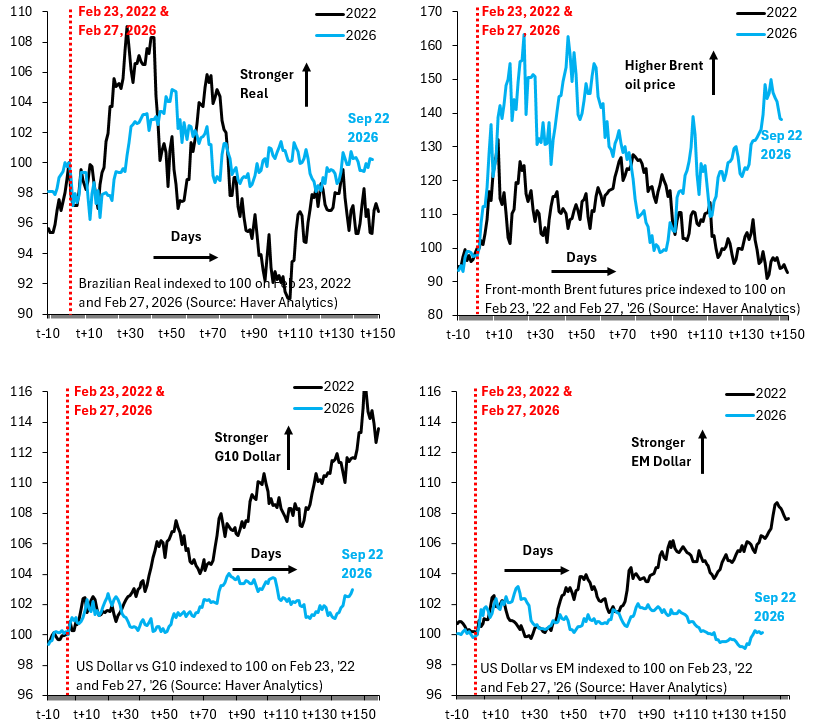
Real, Brent and USD indexed to 100, 2022 vs 2026 | Four panels: 2026 shows a firmer real and higher Brent, with diverging dollar paths
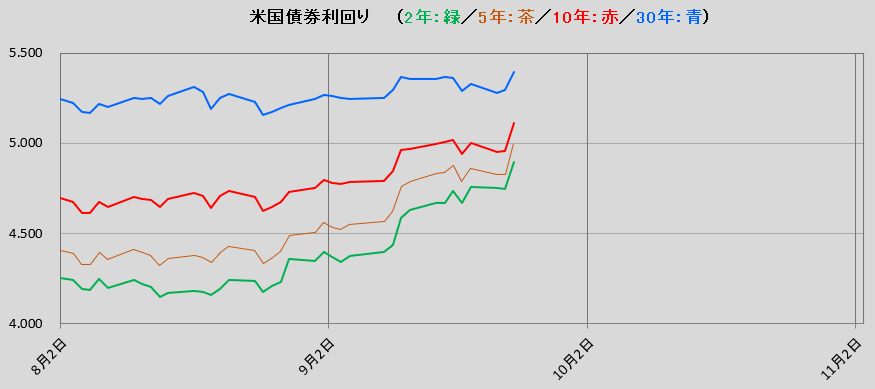
US Treasury yields (2/5/10/30-year), Aug-Sep 2026 | 30Y ~5.4%, 10Y ~5.1%, 5Y ~4.85% and 2Y ~4.9%, all rising since early August
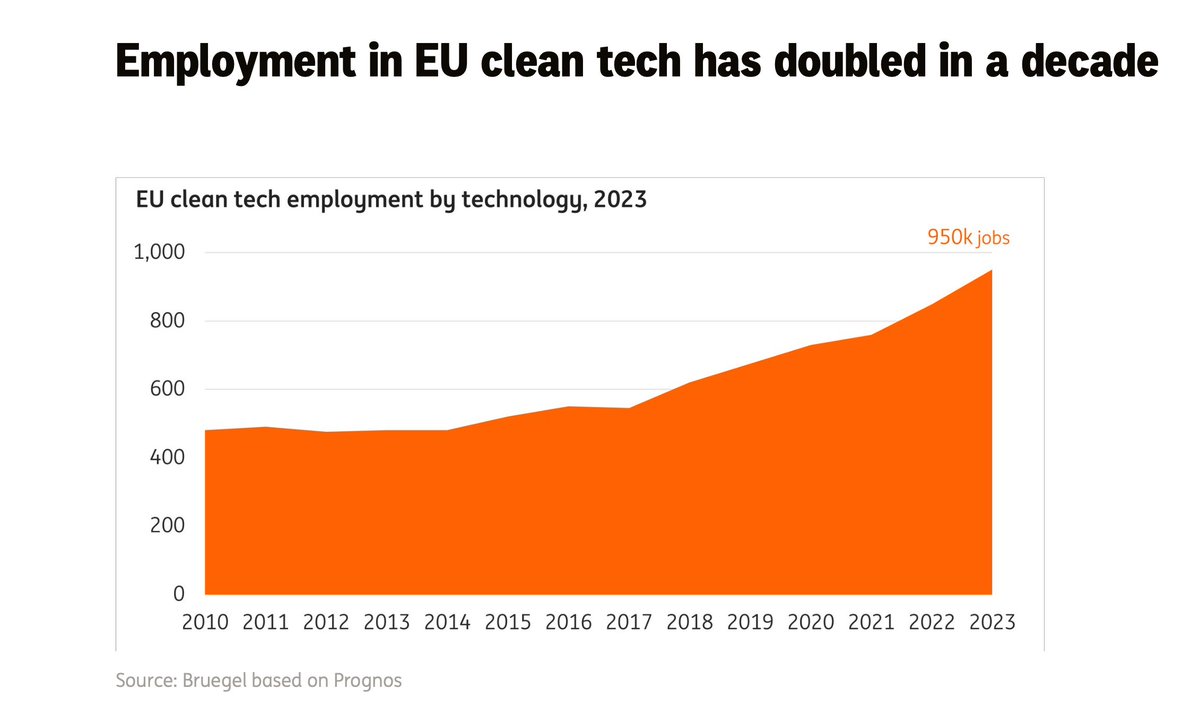
EU clean-tech employment by technology (thousands) | Up from ~480k in 2010 to 950k in 2023, a decade doubling
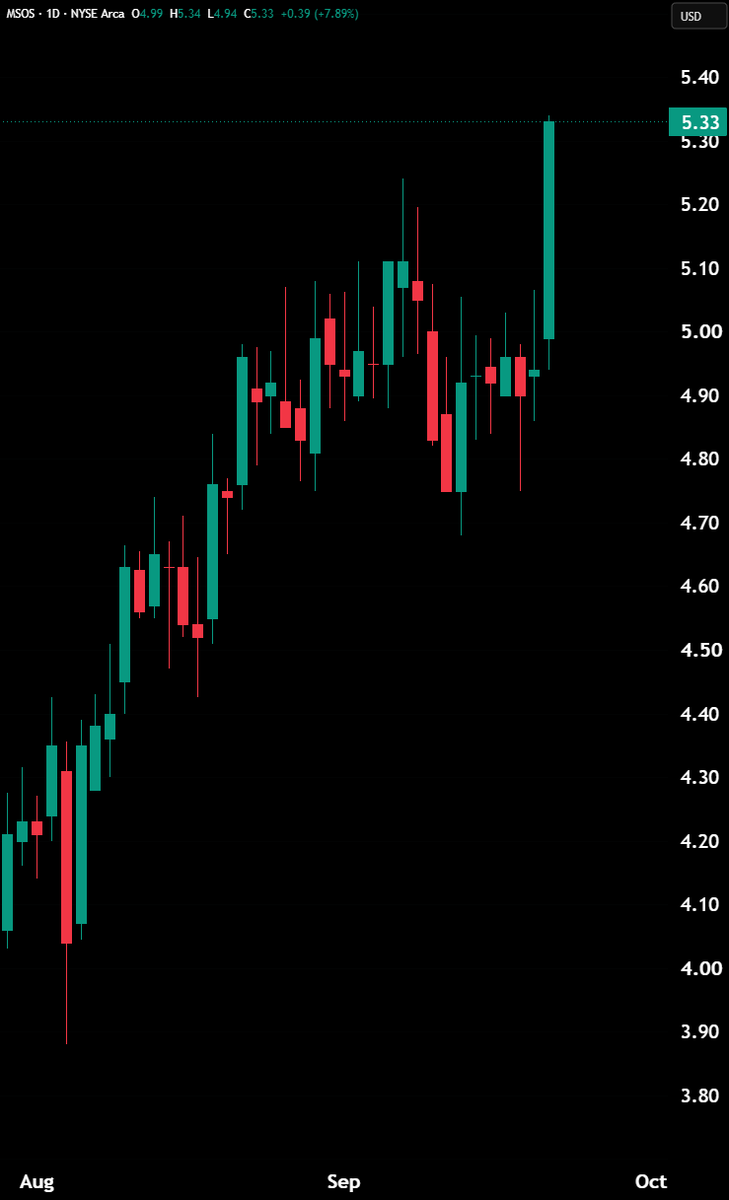
US cannabis ETF ($MSOS) daily price | Up 7.9% on the day to $5.33
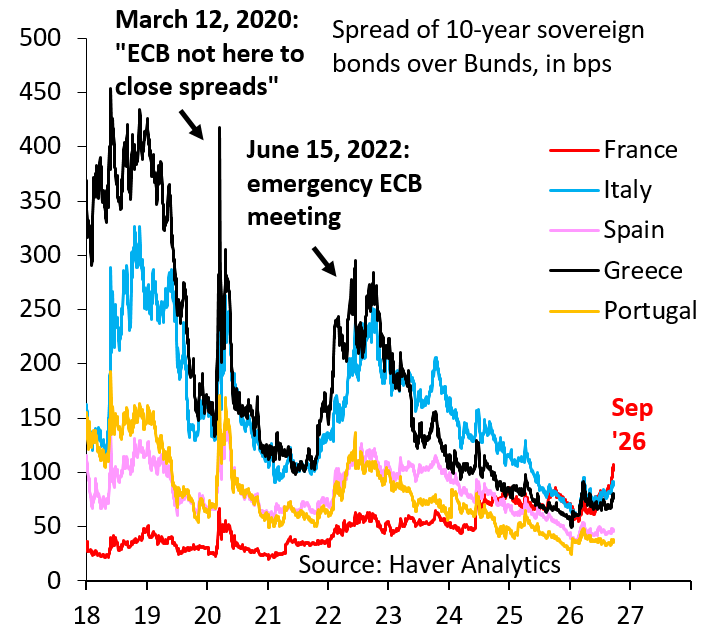
10-year sovereign spreads over Bunds, bps | France, Italy, Spain, Greece and Portugal all well off their 2020 and 2022 peaks
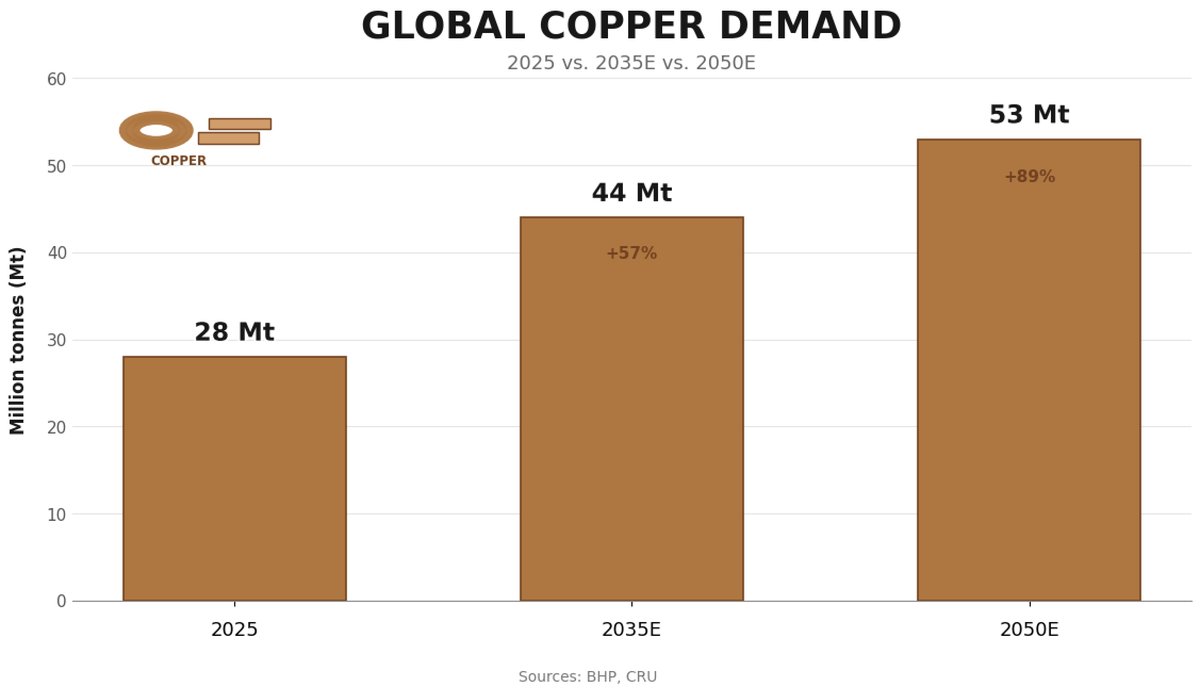
Global copper demand, 2025 vs 2035E vs 2050E (Mt) | From 28Mt in 2025 to 44Mt (+57%) by 2035 and 53Mt (+89%) by 2050
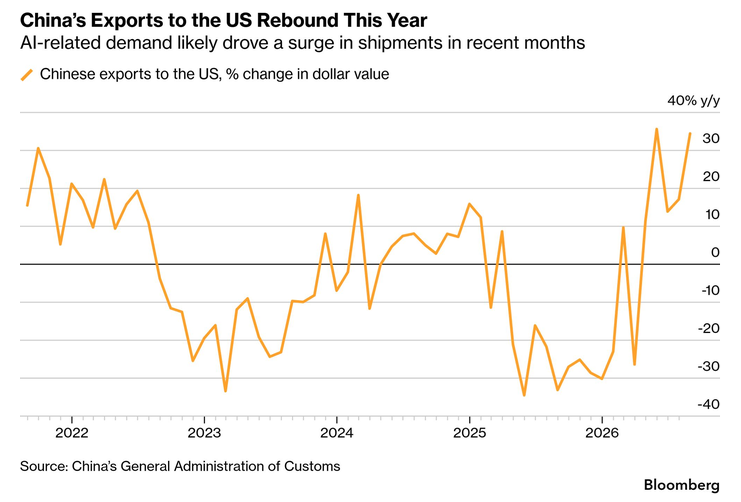
Chinese exports to the US, % change in dollar value | ~+34% y/y in August, double July's pace and a fifth straight monthly gain
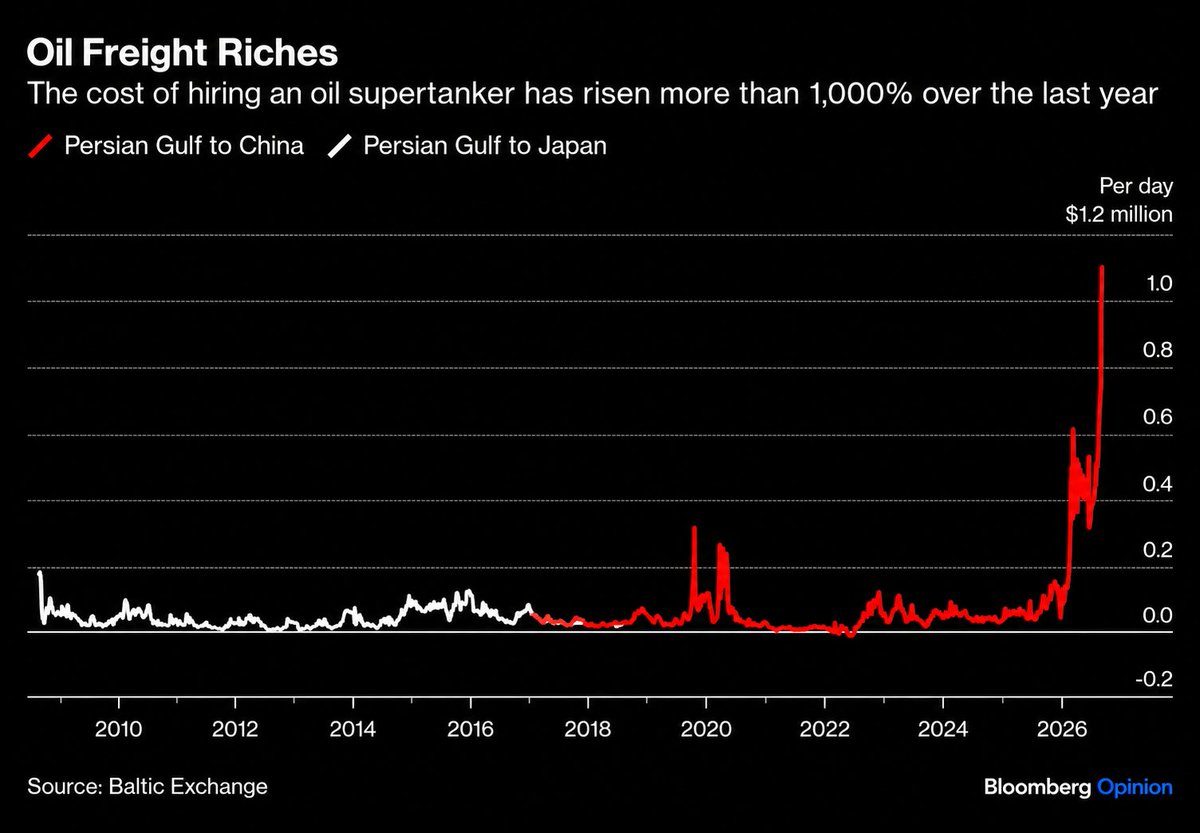
VLCC day rates, Persian Gulf to China and Japan | ~$1.1M/day, up more than 1,000% over the past year
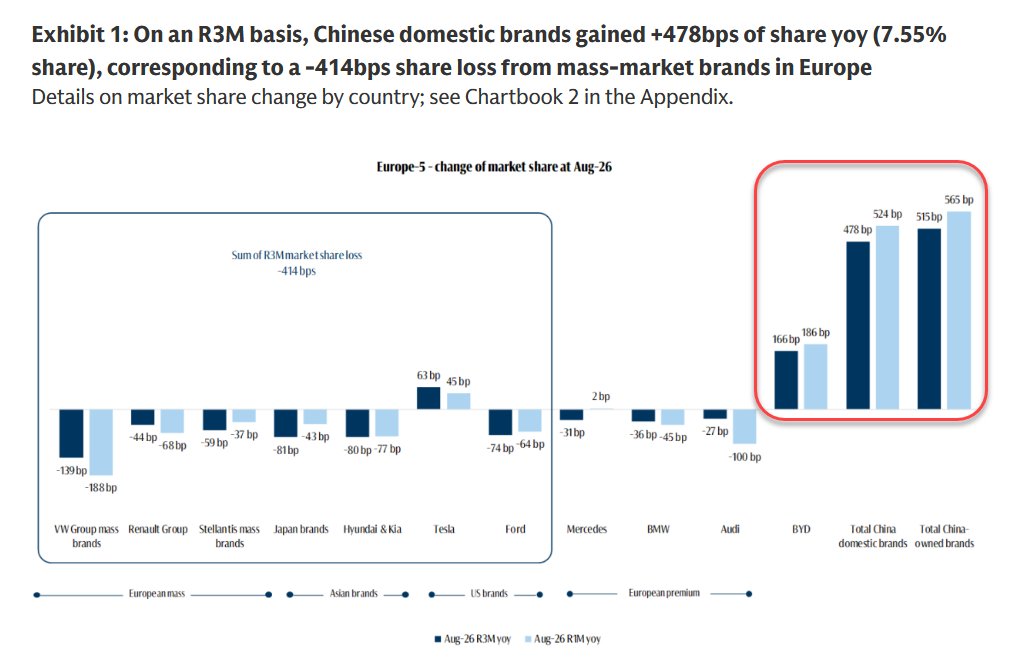
Change in Europe-5 auto market share, bps, R3M yoy as of Aug 2026 | Chinese domestic brands +478bp (total China-owned +515bp) vs VW mass -139bp
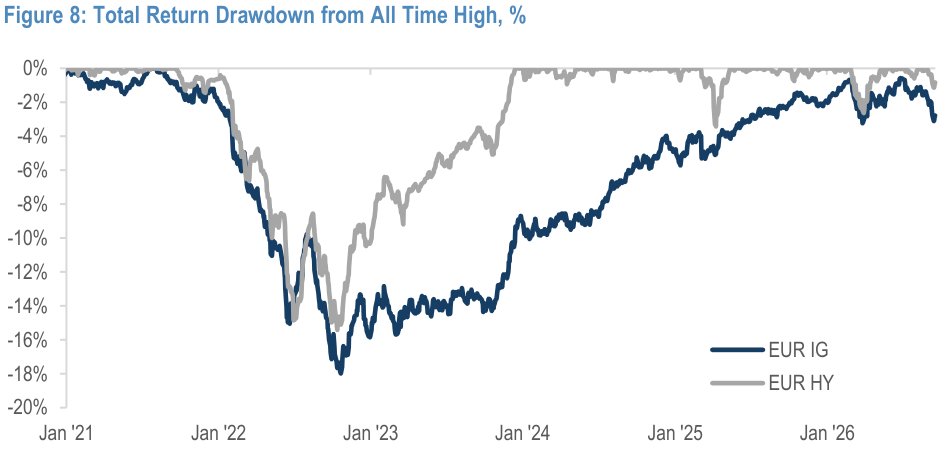
Euro IG and HY total-return drawdown from all-time highs, % | IG now about -2.8%, recovering from -18% in 2022, while HY is nearly flat
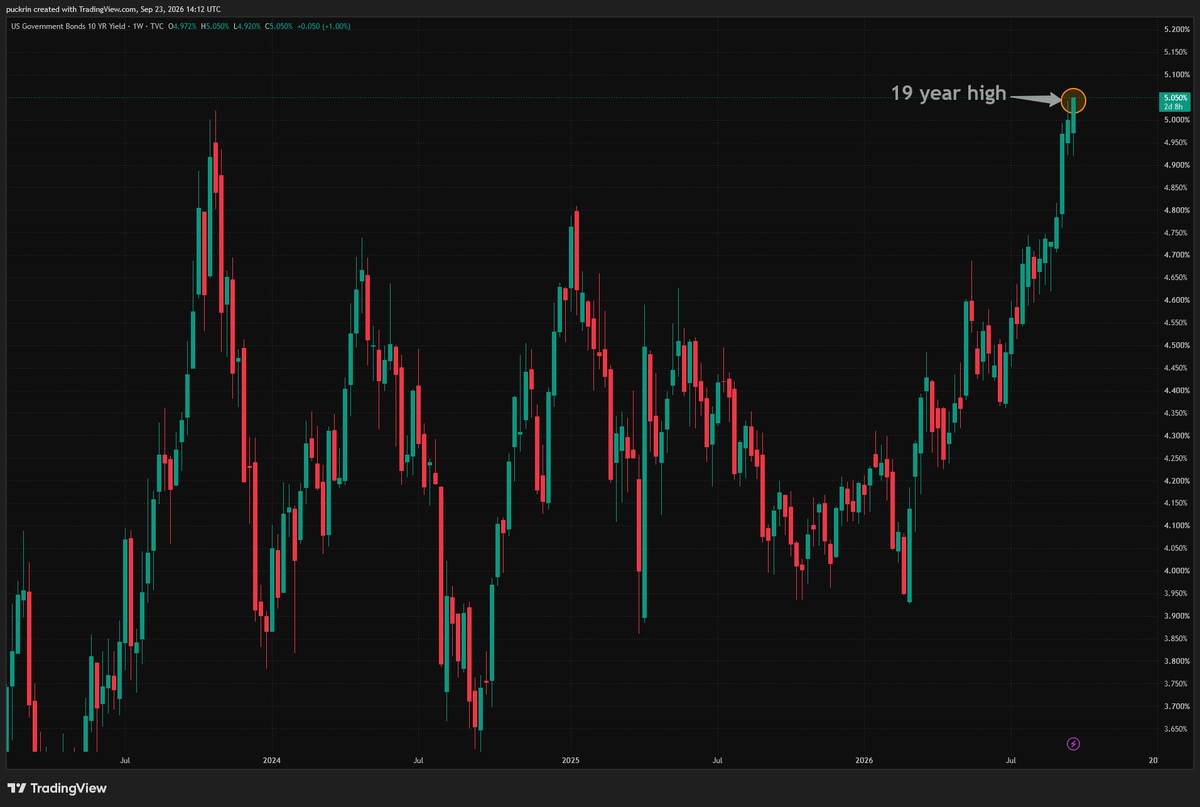
US 10-year Treasury yield, weekly | Breaks above 5.04%, the highest in 19 years
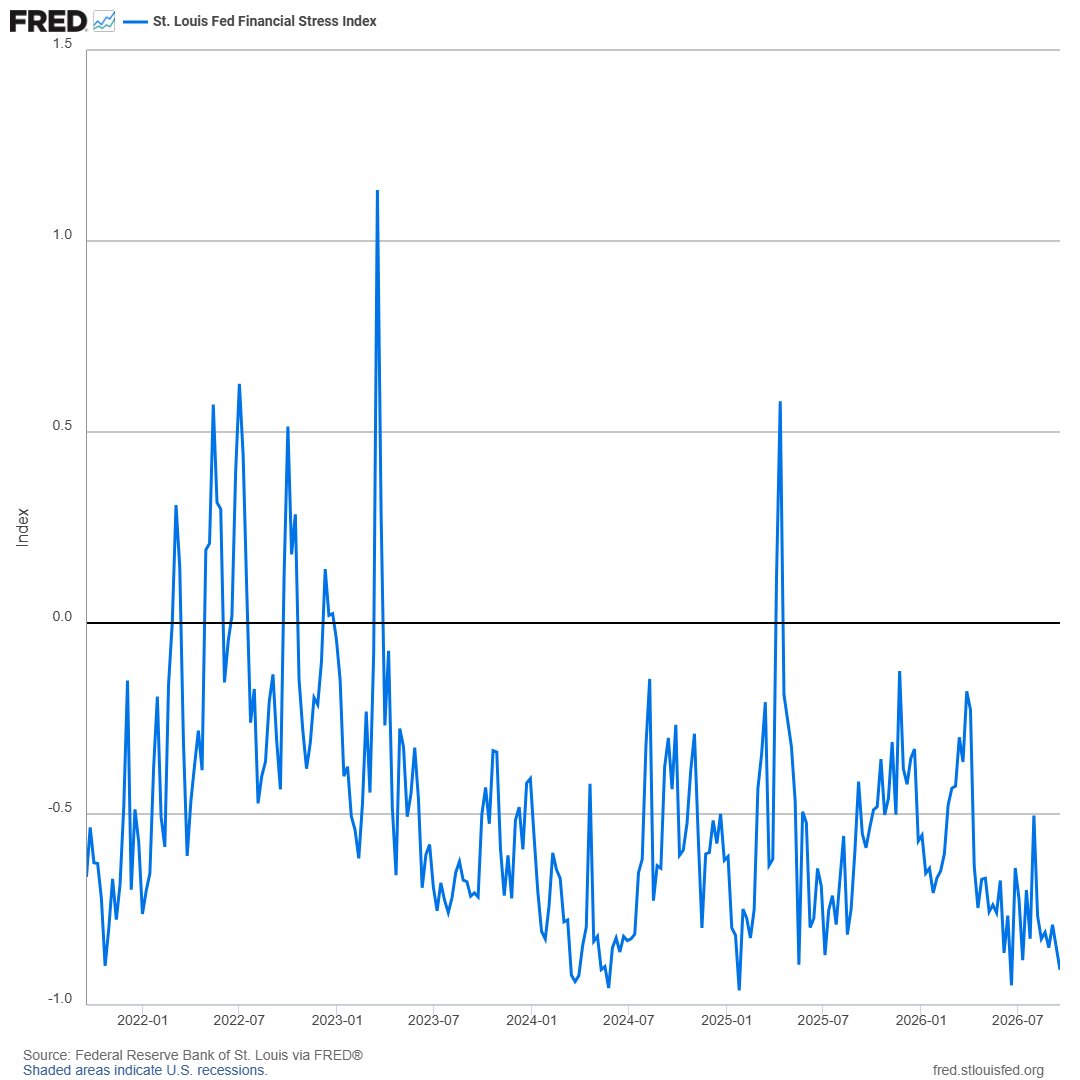
St. Louis Fed Financial Stress Index, 2022-2026 | -0.91 in the week to Sep 18 vs -0.85 prior; 0 is normal and below 0 signals below-average stress
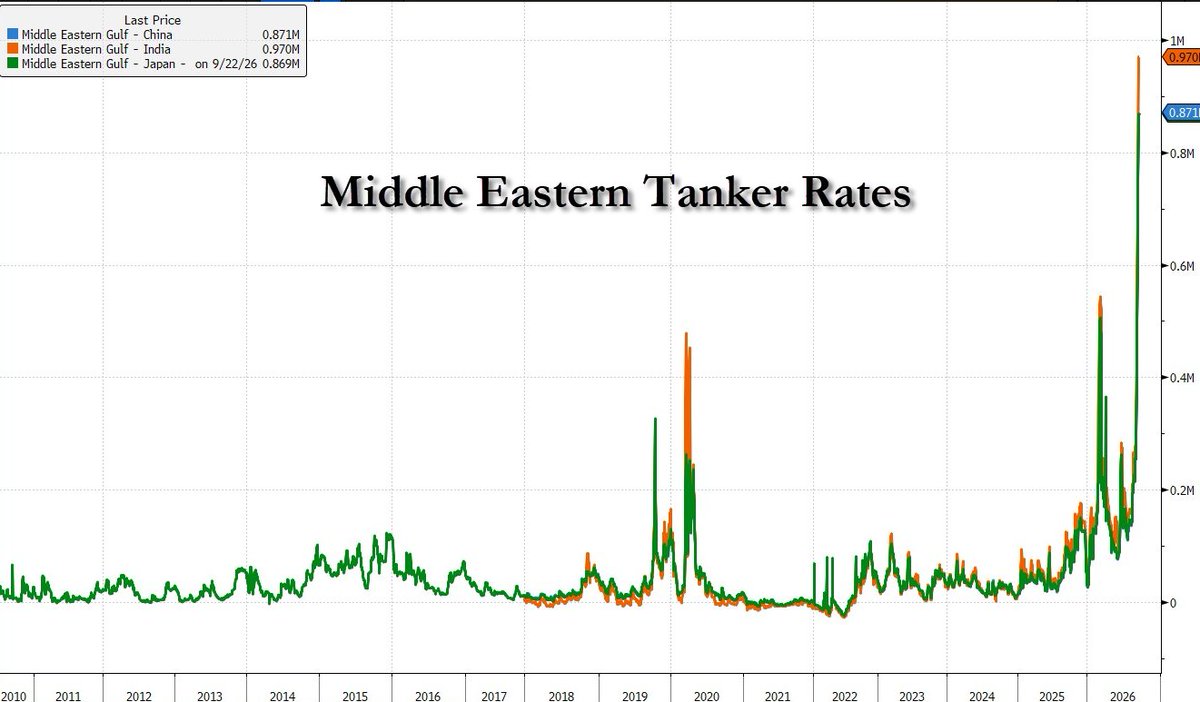
Middle Eastern Gulf tanker rates to China, India and Japan | Routes spike to ~$0.87M-$0.97M/day, the highest in over a decade
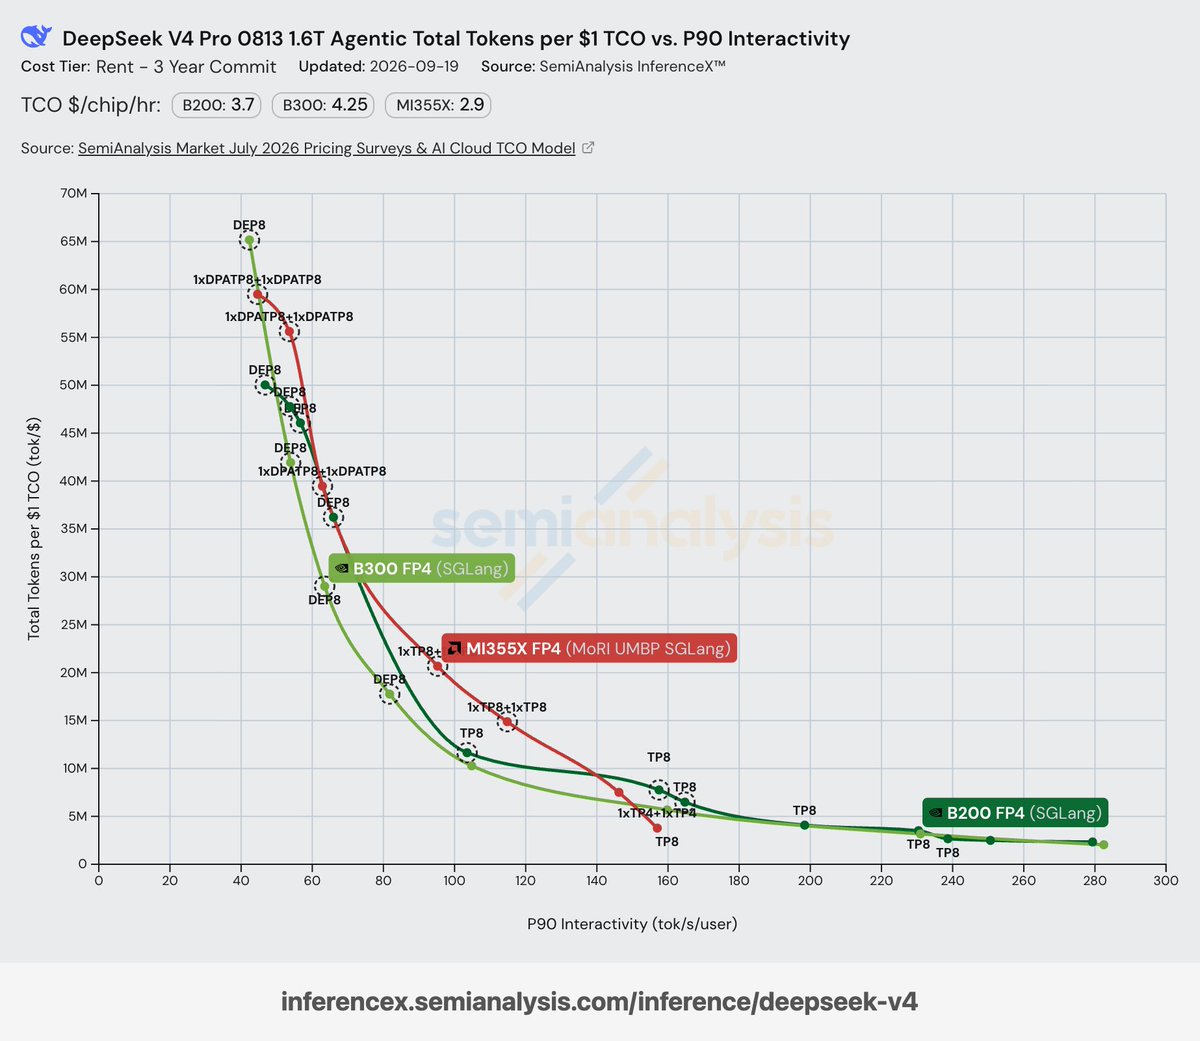
DeepSeek V4 total tokens per $1 TCO vs P90 interactivity, 3-year rent | B300 FP4 frontier tops MI355X and B200, over 50M tokens per $ at low interactivity