Key points
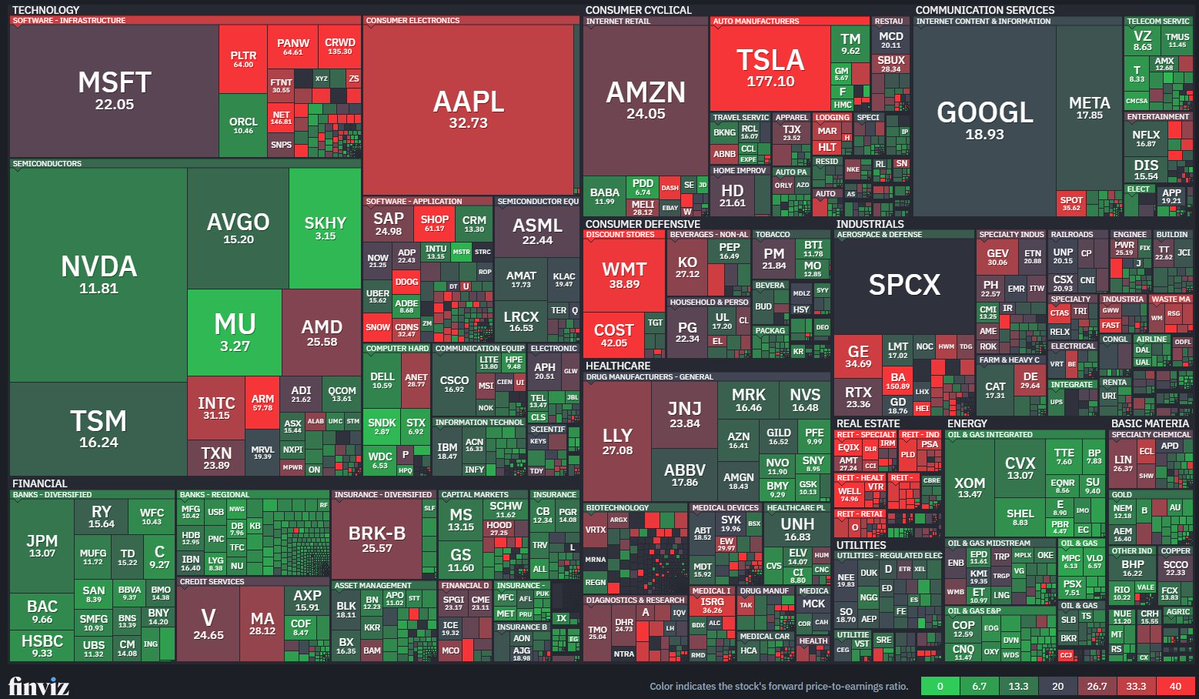
US equity forward P/E heatmap, tiles by market cap, color by valuation | NVDA at 11.8x and TSM at 16.2x look cheap; AAPL at 32.7x and TSLA at 177x sit high
Image source: @MikeZaccardi
US equity forward P/E heatmap, tiles by market cap, color by valuation | NVDA at 11.8x and TSM at 16.2x look cheap; AAPL at 32.7x and TSLA at 177x sit high
Image source: @MikeZaccardi