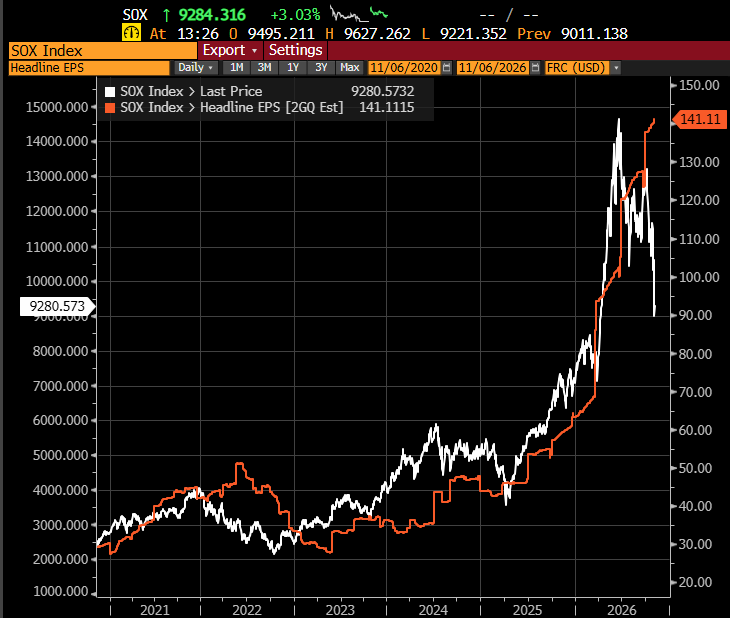
【晶片股跌掉三成,獲利預估還在創新高 🔻】
費城半導體指數從今年中的高點回落到 9,280 點附近,跌幅超過三成。同一段時間,分析師對這些公司的獲利預估一路往上,最新一筆剛創新高。
兩條線走反方向,不代表其中一條錯了。
賣方的獲利預估是由下而上加總公司財測算出來的,而公司一季只給一次財測。價格每天都在對明年的獲利投票,預估一季才有一次正式更新,中間全靠分析師自己動手調。兩種更新頻率擺在同一張圖上,看起來就是背離。
這張圖在 2022 年出現過一模一樣的形狀:價格先跌,獲利預估撐了大約兩季才開始往下修。所以現在的問題不是誰領先誰,而是預估什麼時候轉向,以及轉向時會不會一次修得很深。
另外補一句,這張圖不適合拿來算本益比。右軸的預估值是未來兩季還是整年,兩種讀法算出來的倍數差了好幾倍,看圖的人很容易自己算出一個不存在的估值。
資料來源:費城半導體指數與分析師獲利預估(圖片來自 @RenMacLLC)
Chip Stocks Are Down a Third While Earnings Estimates Keep Hitting Highs
The Philadelphia Semiconductor Index has fallen from its mid-year peak to around 9,280, down more than 30%. Over the same stretch, analysts' earnings estimates for those companies kept climbing, with the latest reading at a fresh high.
Two lines moving apart does not mean one of them is wrong.
Sell-side estimates are built bottom-up from company guidance, and companies guide once a quarter. Price votes every day on next year's profits, while the estimate gets one scheduled update per quarter and relies on analysts adjusting by hand in between. Put two different refresh rates on one chart and you get what looks like a divergence.
The same shape appeared in 2022: price fell first, and estimates held up for roughly two quarters before being cut. The question now is not which line leads, but when estimates turn and how much comes off when they do.
One caution: this chart is a poor basis for a valuation multiple. Whether the right axis shows a two-quarter or a full-year figure changes the answer several times over.
Source: Philadelphia Semiconductor Index and analyst earnings estimates (Image: @RenMacLLC)