【跑贏物價的只有最低薪的那一組,中間和上面都沒有】💵
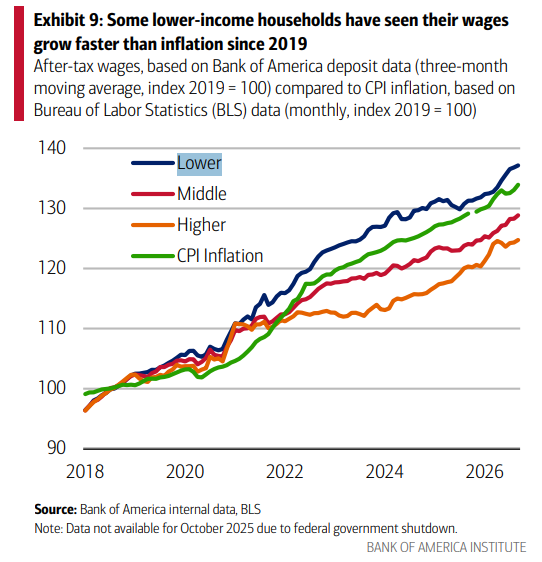
以 2019 年為 100,美國最低所得那一組的稅後薪資現在來到 137,同期的消費者物價是 133。中所得是 129,高所得只有 124.5。
多數人看到這張圖會先注意到底層跑贏了。真正少見的是另外兩條:中所得和高所得這七年都在物價線的下面。
■ 稅後兩個字要看仔細
這張圖畫的是扣完稅以後進到戶頭的錢。今年美國調整了扣繳稅率,有一部分「加薪」其實是政府少扣了,不是雇主多付了。製作這份資料的銀行自己也說,這個效果大概只能維持一年。
所以這條線同時裝了兩種東西:真的漲薪水,和暫時少繳稅。明年扣繳的效果退場之後,這一組還剩多少,才是比較誠實的答案。
還有一點,資料來自一家銀行自己客戶的存款紀錄,不是全國性統計,抽樣偏向有薪轉戶的人。
資料來源: 美國一家大型銀行的研究機構與勞工統計局 (圖片來自 @MikeZaccardi)
Only the Lowest-Paid Group Beat Inflation, the Middle and the Top Did Not
Indexed to 100 in 2019, after-tax wages for America's lowest-income group now sit at 137, against consumer prices at 133. The middle group is at 129 and higher earners at just 124.5.
Most people look at this chart and notice that the bottom is winning. The rarer finding is the other two lines: middle and higher earners have both spent seven years below the inflation line.
■ Read the words "after tax" carefully
This chart shows money arriving in the account once tax has been taken out. Withholding rates were adjusted in the US this year, so part of the apparent raise is the government deducting less rather than employers paying more. The bank that produced the data says that effect probably lasts about a year.
The line therefore contains two different things: genuine wage gains, and a temporary tax change. What remains once the withholding effect drops out next year is the more honest answer.
One more limitation. The figures come from one bank's own customer deposit records rather than a national survey, which skews towards people who have their pay deposited there.
Source: Research arm of a large US bank and the Bureau of Labor Statistics (Image: @MikeZaccardi)