【2020 年代財富成長最快的,是美國最窮的一半人】🧮
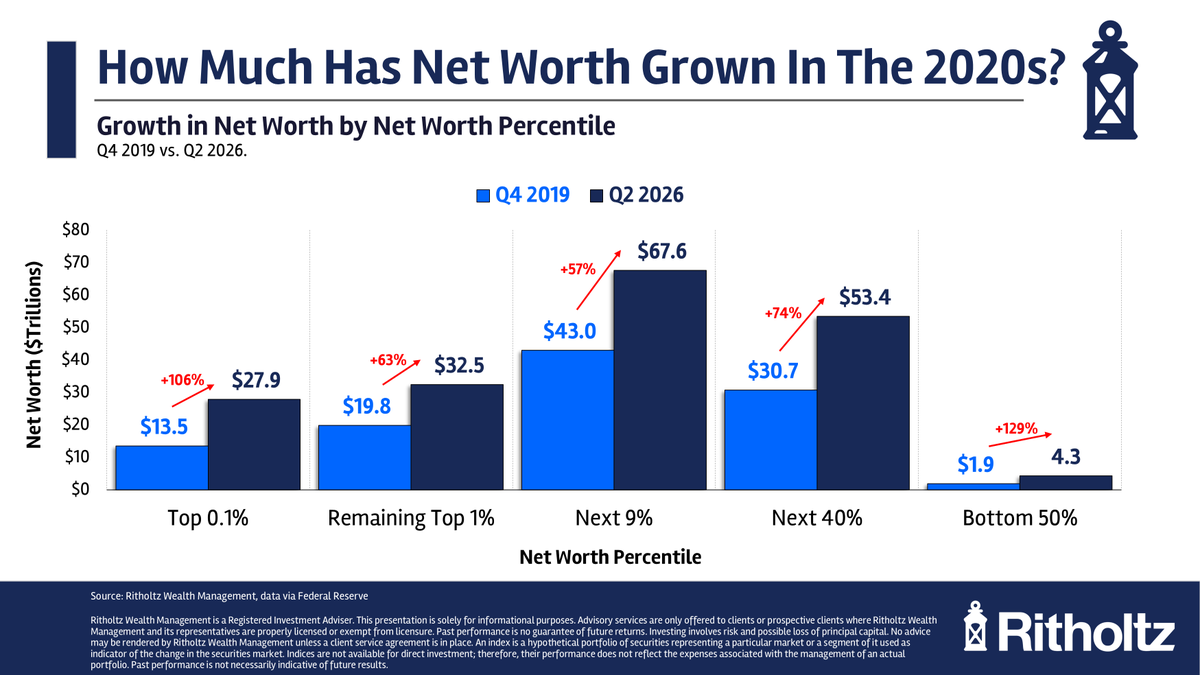
從 2019 年第 4 季到 2026 年第 2 季,美國財富後 50% 的家庭淨資產合計從 1.9 兆美元增加到 4.3 兆,成長 129%,是五個財富級距裡最高的。前 0.1% 成長 106%,中間偏上的「次 9%」只有 57%。
基數差太多,這個排序會誤導。後 50% 增加的是 2.4 兆美元,前 0.1% 增加的是 14.4 兆。同期消費者物價上漲約 29%,後 50% 那 129% 扣掉通膨之後大約剩 77%。
值得看的是占比怎麼移動。用圖上的金額換算,前 0.1% 持有的比重從約 12.4% 升到 15.0%,後 50% 從約 1.7% 升到 2.3%。聯準會的分配帳資料也顯示今年第 2 季這兩個數字是 15.0% 與 2.3%。兩頭都往上,中間被擠:次 9% 從約 39.5% 降到 36.4%,是五組裡唯一明顯縮水的。
這組人是財富排在前 10% 但不到前 1% 的家庭,資產以股票、退休帳戶和自住房為主。他們這幾年確實增值,只是跑輸最上面那一層。
所以這幾年的變化不是單純的貧富差距擴大,也不是底層追上來,而是最頂端漲得比誰都快,相對被稀釋的是專業白領那一段。
資料來源: 聯準會分配帳資料、美國勞工統計局 (圖片來自 @awealthofcs)
The Fastest Wealth Growth of the 2020s Belongs to America's Bottom Half
Between the fourth quarter of 2019 and the second quarter of 2026, the combined net worth of the bottom 50% of US households rose from $1.9 trillion to $4.3 trillion, a gain of 129% and the largest of any wealth group. The top 0.1% grew 106%. The next 9%, the tier just below the very top, grew only 57%.
The starting points are too different for that ranking to mean much. The bottom half added $2.4 trillion. The top 0.1% added $14.4 trillion. Consumer prices rose about 29% over the same stretch, so the bottom half's 129% is closer to 77% in real terms.
What matters is how the shares moved. Using the chart's own figures, the top 0.1% went from about 12.4% of total household net worth to 15.0%, and the bottom 50% from about 1.7% to 2.3%. The Federal Reserve's distributional accounts put those same two figures at 15.0% and 2.3% for the second quarter. Both ends gained and the middle paid for it: the next 9% fell from roughly 39.5% to 36.4%, the only group to shrink meaningfully.
That tier is the households above the 90th percentile but below the top 1%, holding mostly equities, retirement accounts and a primary home. Those assets did appreciate. They simply appreciated more slowly than what the very top owns.
So the story of the 2020s is not a simple widening gap, nor the bottom catching up. It is the top compounding faster than everyone else, with the professional class losing ground in relative terms.
Source: Federal Reserve Distributional Financial Accounts and the US Bureau of Labor Statistics (Image: @awealthofcs)