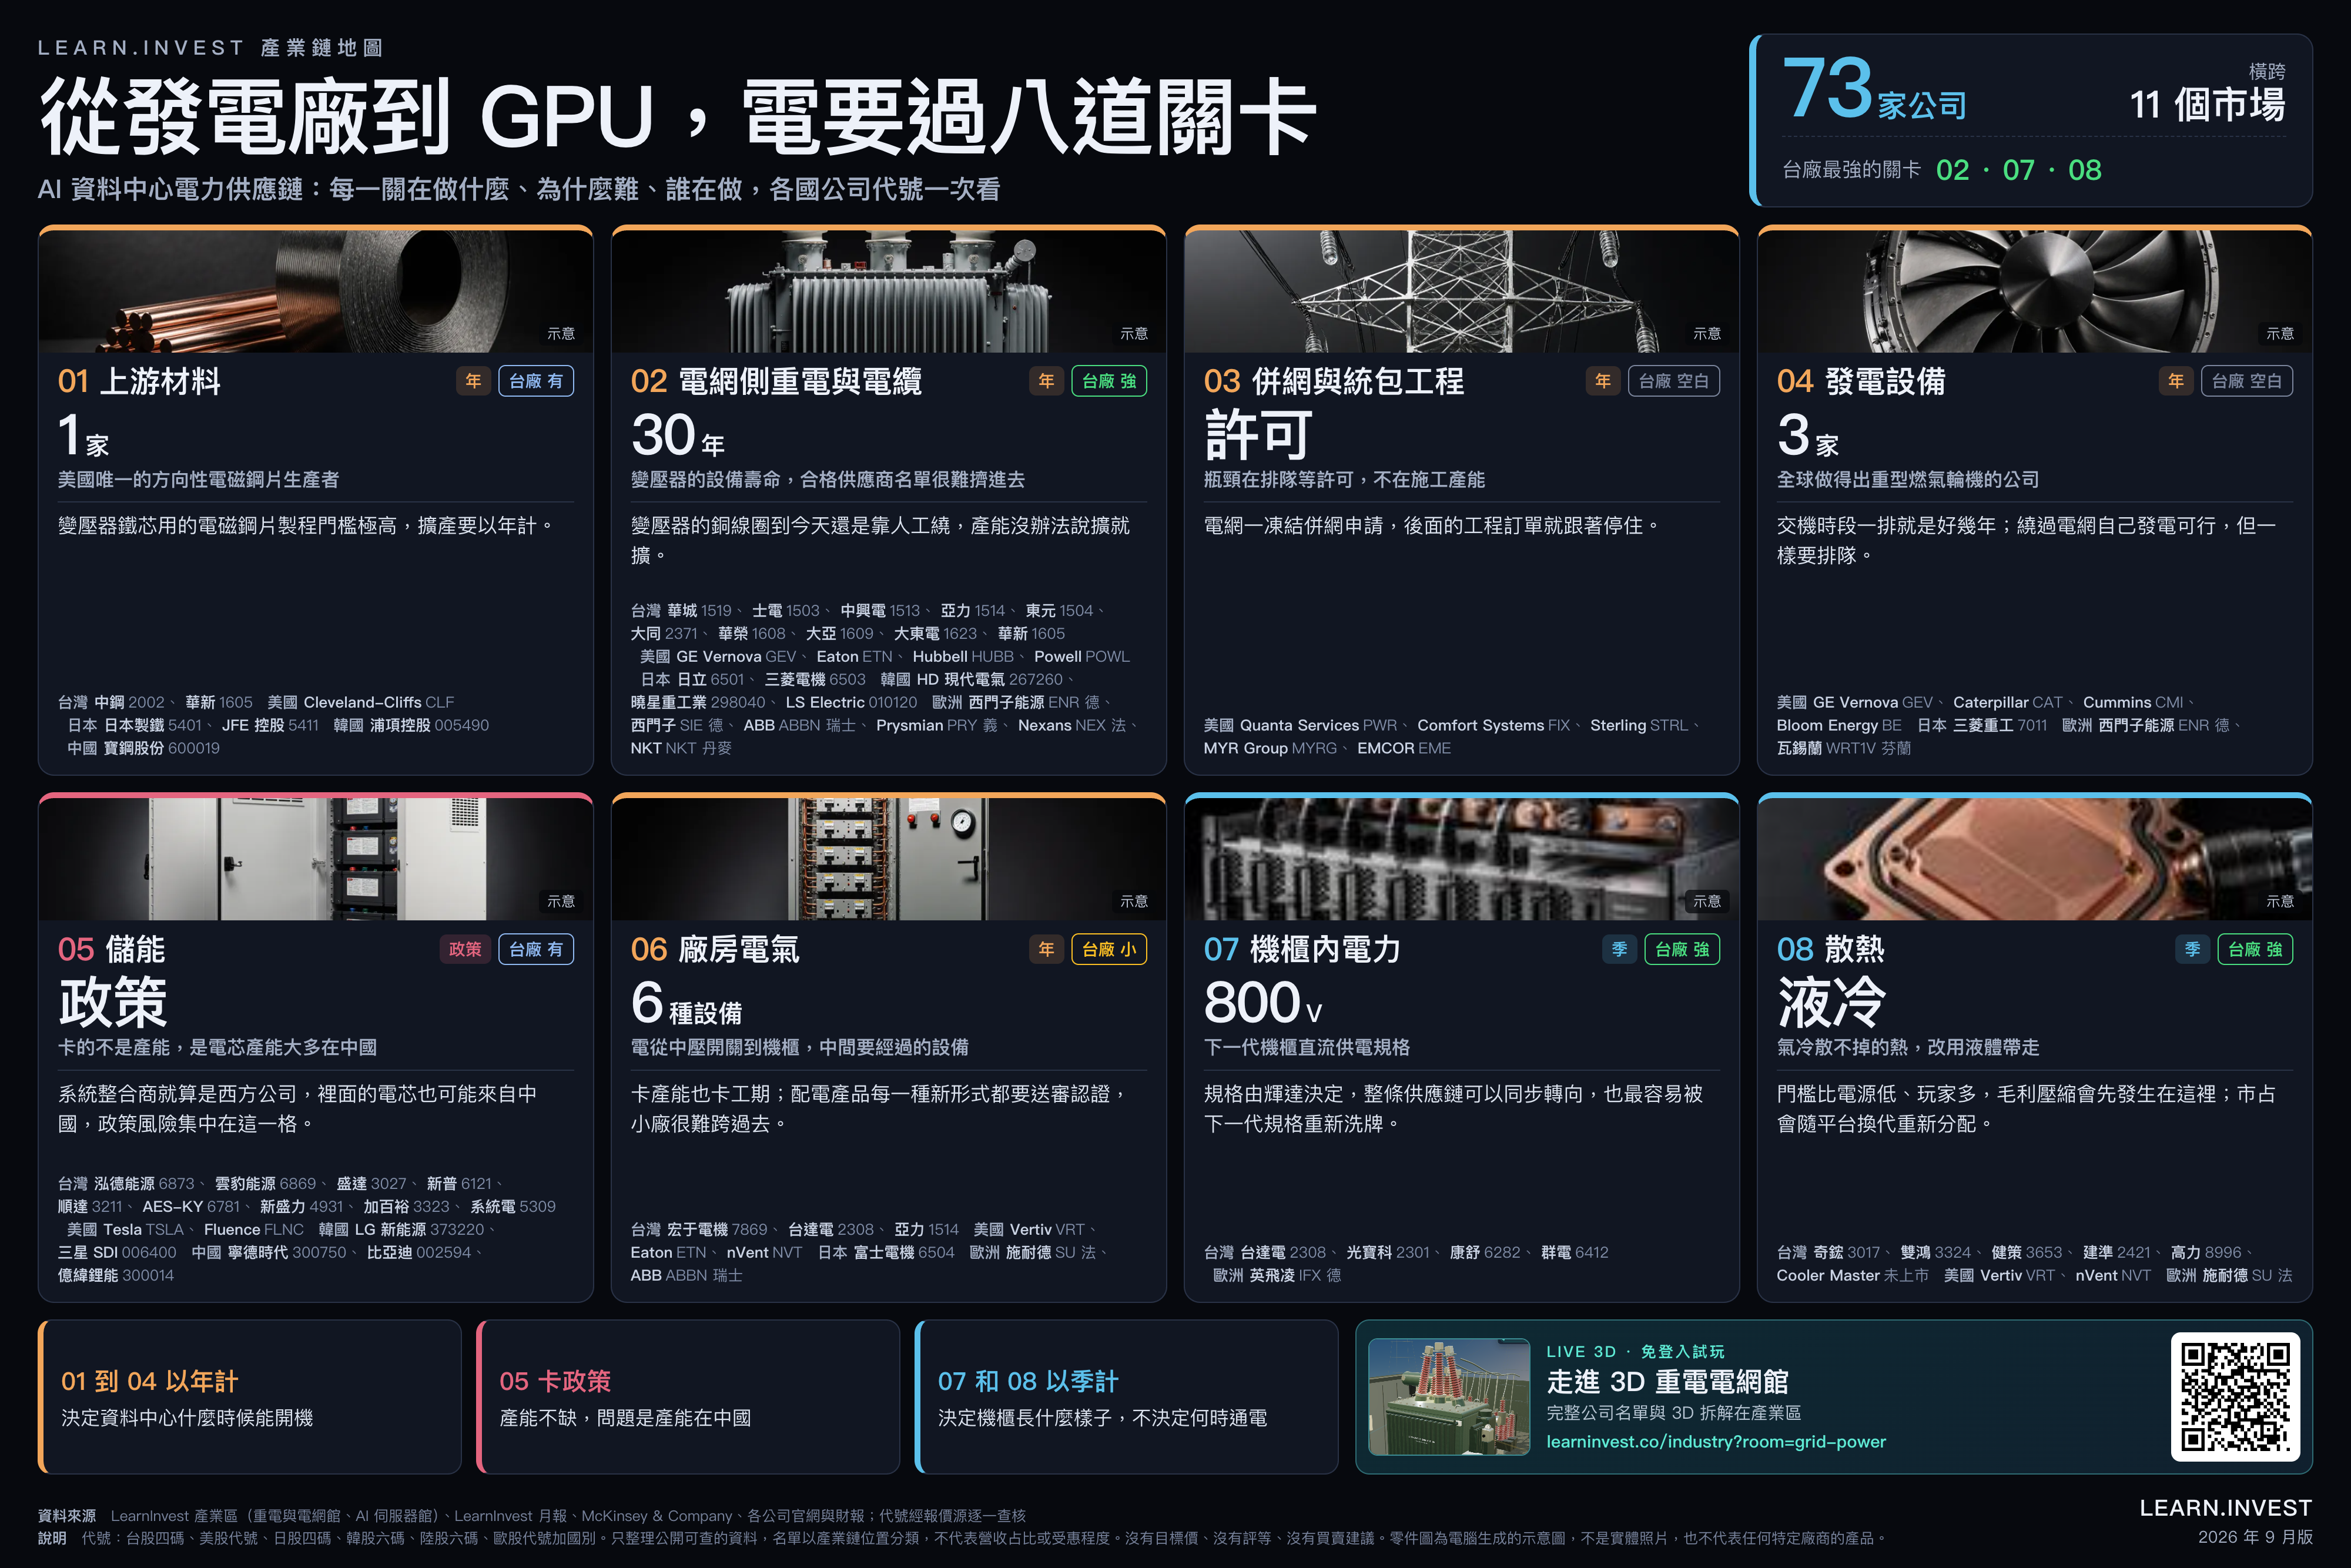
從德州電網、聯邦命令到約 50 家公司的供應鏈,拆解 AI 電力瓶頸真正卡在哪裡
【Monthly · 2026-09】
排隊等著接上德州電網的申請量,加起來是這座電網歷史上用電最高那一天的五倍。
所以德州州長叫他們全部停下來。
這件事發生在 8 月 3 日。他寫了一封信給州內兩個電力主管機關,要求對所有正在排隊的資料中心逐案查核,查完之前誰都不准往前走。
被擋下來的規模是 474 GW。而德州電網在 11 天前,也就是 7 月 22 日,才剛創下歷史用電尖峰紀錄,數字是 91.1 GW,比 2023 年的前紀錄高出 6%。
排隊的申請裡,約九成來自資料中心。
德州一直是全美最歡迎資料中心的地方。電費便宜、法規寬鬆、土地多。它率先踩剎車,代表的不是德州變了,是這件事的規模已經超過現有制度能處理的範圍。
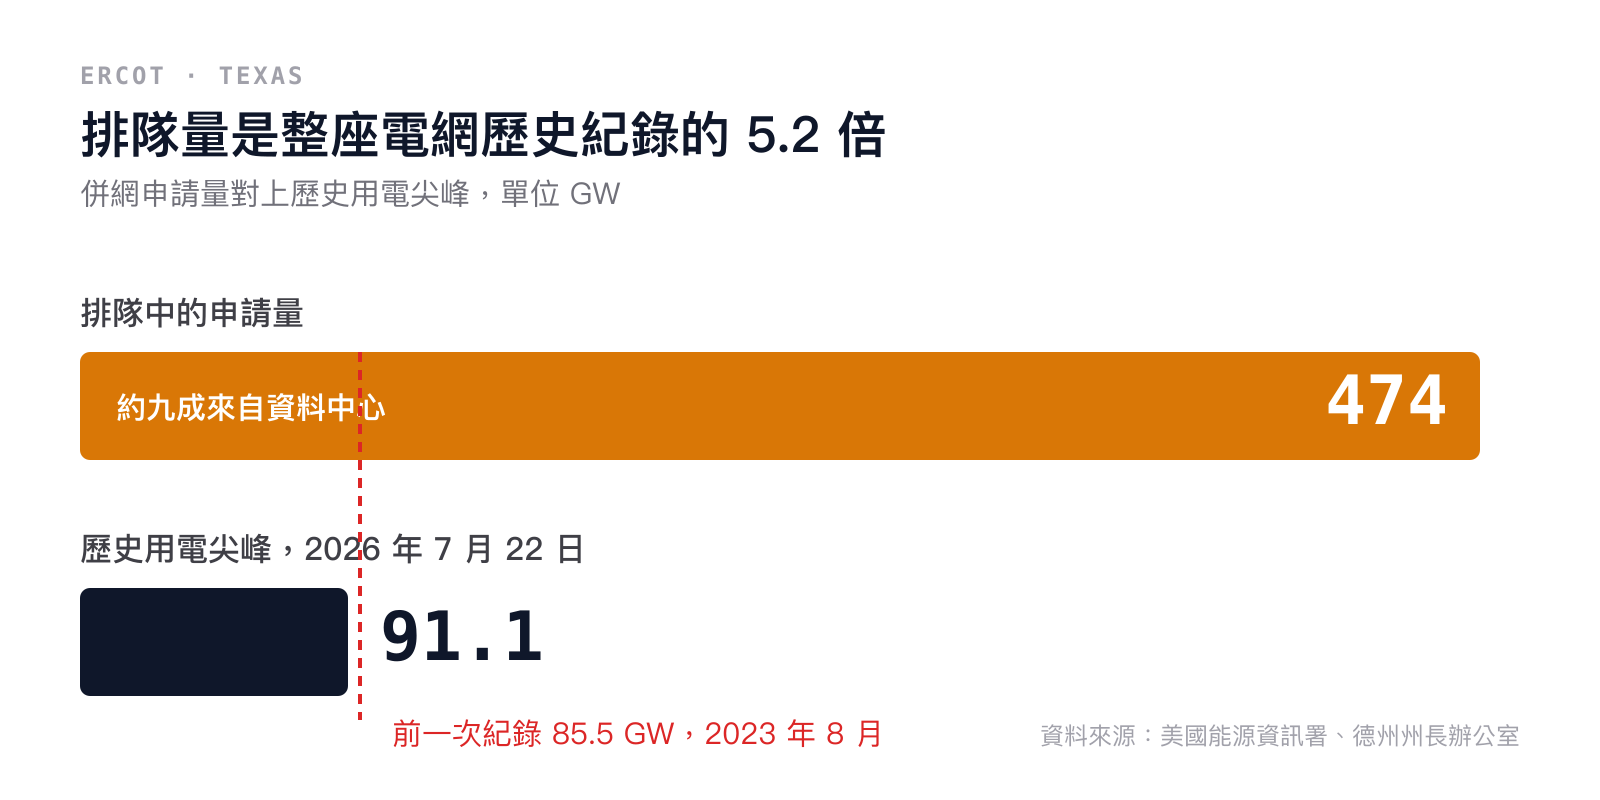
圖 1|排隊的量是這座電網歷史最高負載的五倍以上,而其中約九成來自資料中心。(美國能源資訊署、德州州長辦公室/LearnInvest 整理)
▋ 這篇月報,回答八個問題
這一期的主題是電力,但重點不在缺電。八月之內發生的幾件事,把 AI 的電力問題從一個採購問題,變成一個排不排得進去的問題。前四題免費閱讀,從第五題開始是會員內容。
- Q1|德州為什麼要叫所有人停下來排隊?474 GW 的申請裡有多少是真的,查核要查什麼、什麼時候查完。
- Q2|就算准你接電,設備買得到嗎?變壓器、燃氣輪機與發電機組的交期,以及產能為什麼擴不出來。
- Q3|一座 1 GW 的資料中心,到底要買多少東西?機櫃、變壓器和交期,一筆一筆算給你看。
- Q4|8 月 26 日那道行政命令,實際管到哪一層?管哪些設備、規則何時出來、已經裝好的設備會不會被波及。
- Q5|為什麼我認為市場看錯了方向?大家盯著變壓器,真正找不到替代來源的是哪一環。
- Q6|這些錢是從哪裡借來的?升息之後會怎樣?公司債、表外融資、帳上與稅上兩套算法,以及 9 月 16 日升息之後誰先受影響。
- Q7|台灣賺的是哪兩種錢?機櫃裡面和電網那邊,位置怎麼來、能守多久。
- Q8|設備到齊之後,它真的會動嗎?AI 資料中心試運轉會遇到的三個難題。
最後會給三個附驗證時點的預測、五個你可以自己追蹤的數字,以及八個環節、50 家公司的供應鏈全圖。
另外補一句。七月那期寫 AI 基建的定價權爭議,八月那期寫一檔基金在六天內從加碼變成減倉。這期寫電力。三個題目看起來不相干,但它們是同一件事的三個切面:AI 的敘事跑得比 AI 的經濟學快。七月是定價權還沒確定,八月是槓桿撐不過路徑,這期是實體交付與融資之間的時間差。這條線我會一直寫下去。
▋ 德州為什麼要叫所有人停下來排隊?
因為這些申請大部分不是真的。
開發商為了保留選項,習慣在好幾個地點同時提出申請,等到融資、土地或客戶其中一項確定之後,再決定要蓋哪一個。對開發商來說這是合理的風險管理,成本很低,好處很大。
但是對電網規劃者來說,這代表手上這份清單沒辦法用。你不知道未來十年要蓋多少輸電線、要準備多少變電容量,因為你分不出哪些是真的。
查核的範圍比一開始說的更廣。ERCOT 要調查的資料中心一共 461 座,其中 75 MW 以上的大型 247 座、25 到 75 MW 的中型 214 座。問卷約 130 題,問的是有沒有拿地方的財務補助、能不能自己發電、水和冷卻怎麼解決、對社區的影響,以及背後的股權是誰。
其中水這一項常被低估。根據勞倫斯柏克萊國家實驗室的估算,美國資料中心現場每天合計用掉約 4,800 萬加侖的水,但它們買的電在發電廠那一端每天要用掉約 5.78 億加侖,是現場的 12 倍,而且記在電力業的帳上。所以同一座資料中心,接的是燃氣電廠還是風電光電,背後的用水量會完全不同。查核把水和冷卻列成獨立一大類,並不意外。
查核目標是 12 月 10 日完成。不過 ERCOT 的官員已經公開說,原訂 2027 年 4 月要完成的相關研究做不完,新時程還在討論。第一批 231 個大型用電戶的回覆期限是 9 月 23 日,完整問卷 10 月中截止。
能排進第一批研究的只有 362 個大型用電案、合計 191.8 GW;另外 373 個案子、超過 300 GW 的申請,連第一批都沒排進去。真正完成穩定度評估、今年稍晚就能上線的,只有 17 個大型用電戶,多數是資料中心,五年內合計尖峰約 6.6 GW。
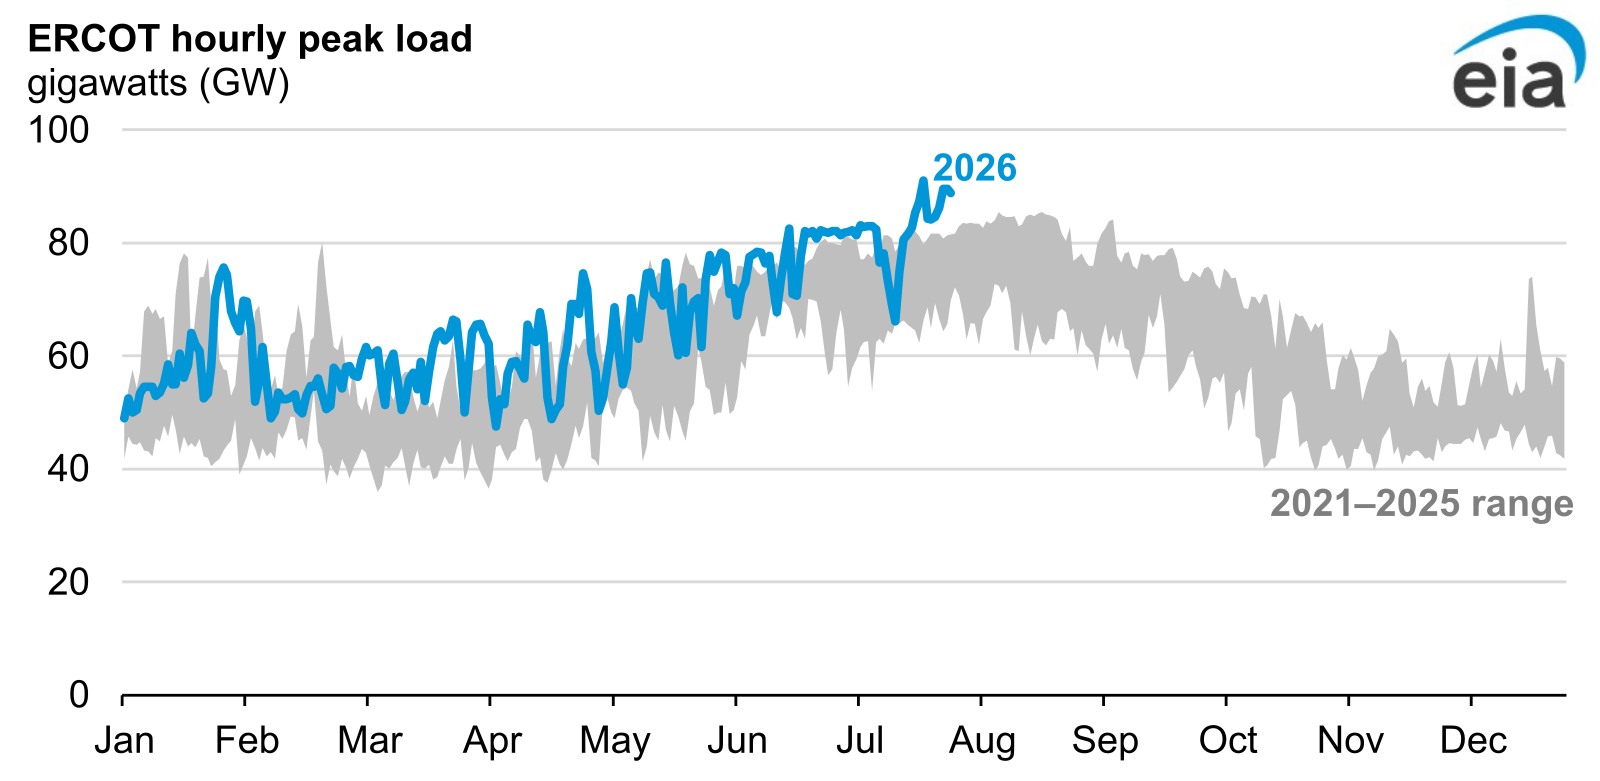
圖 2|這是官方版本的同一件事。7 月 22 日那根尖峰把前一次紀錄墊高了 6%。(美國能源資訊署 Today in Energy,2026 年 8 月)
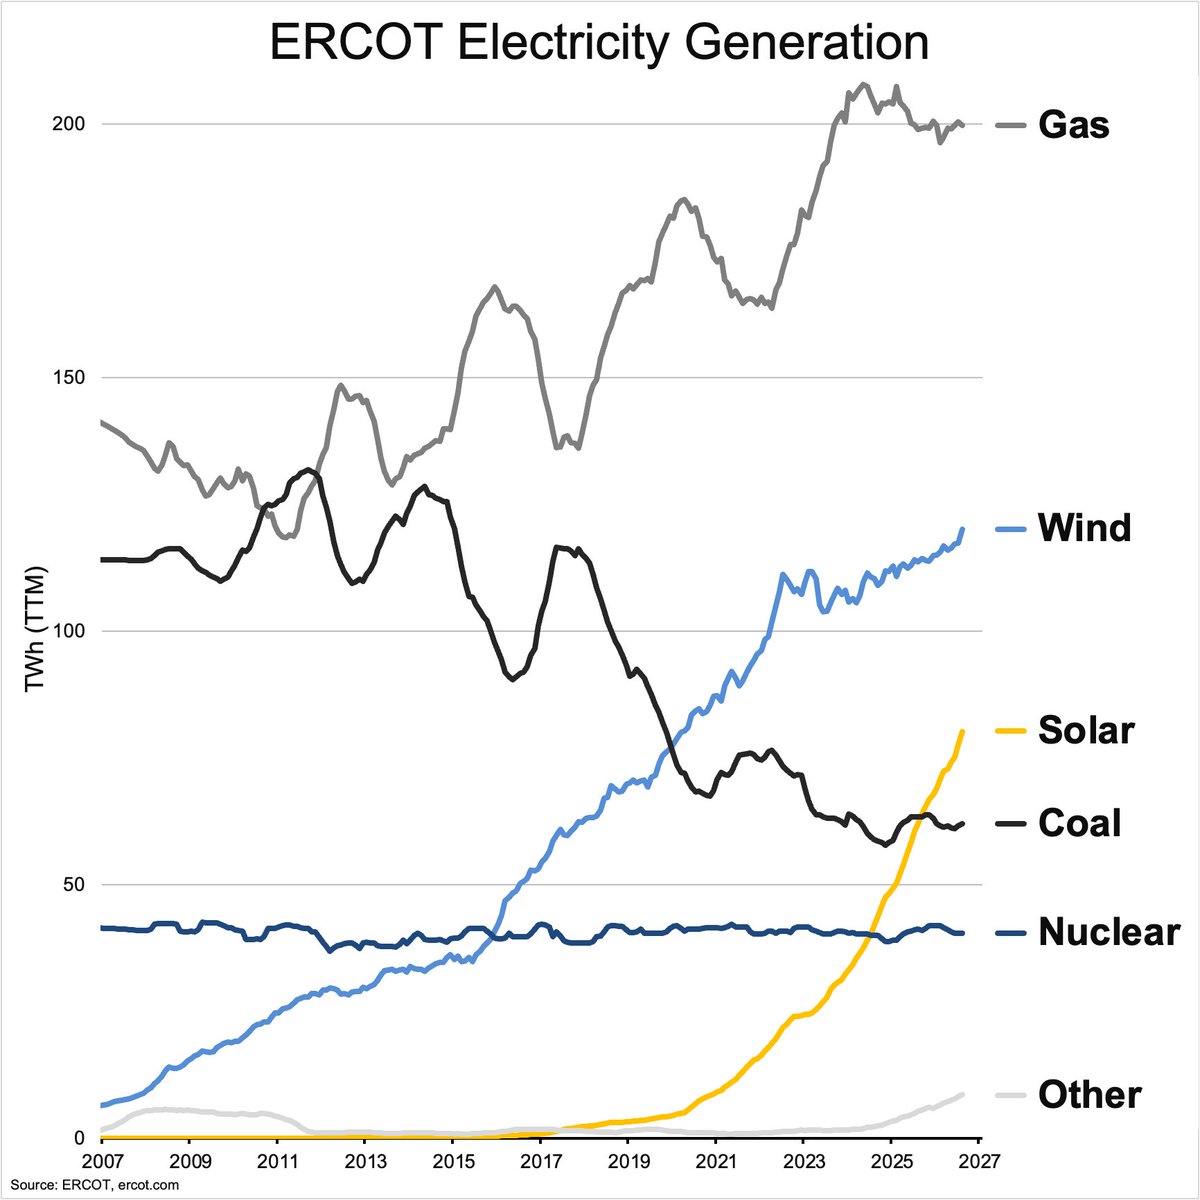
圖 3|德州電網過去二十年的發電結構。風電和太陽能長得最快,但到今天撐住這座電網的仍是天然氣。(ERCOT)
▋ 就算准你接電,設備買得到嗎?
買不到。
大型電力變壓器的平均交期是 128 週。以今天下單計算,2029 年才會到貨。發電機用的升壓變壓器更久,144 週。開關設備比較快,也要 44 週起跳。
這不是價格問題。自 2019 年以來,電力變壓器價格已經上漲約 77%,升壓變壓器 45%,部分等級的配電變壓器接近 95%。同一段時間,美國對電力變壓器的需求成長了 116%,升壓變壓器的需求成長了 274%。
價格漲了快八成,交期還是兩年半。這代表產能真的擴不出來。
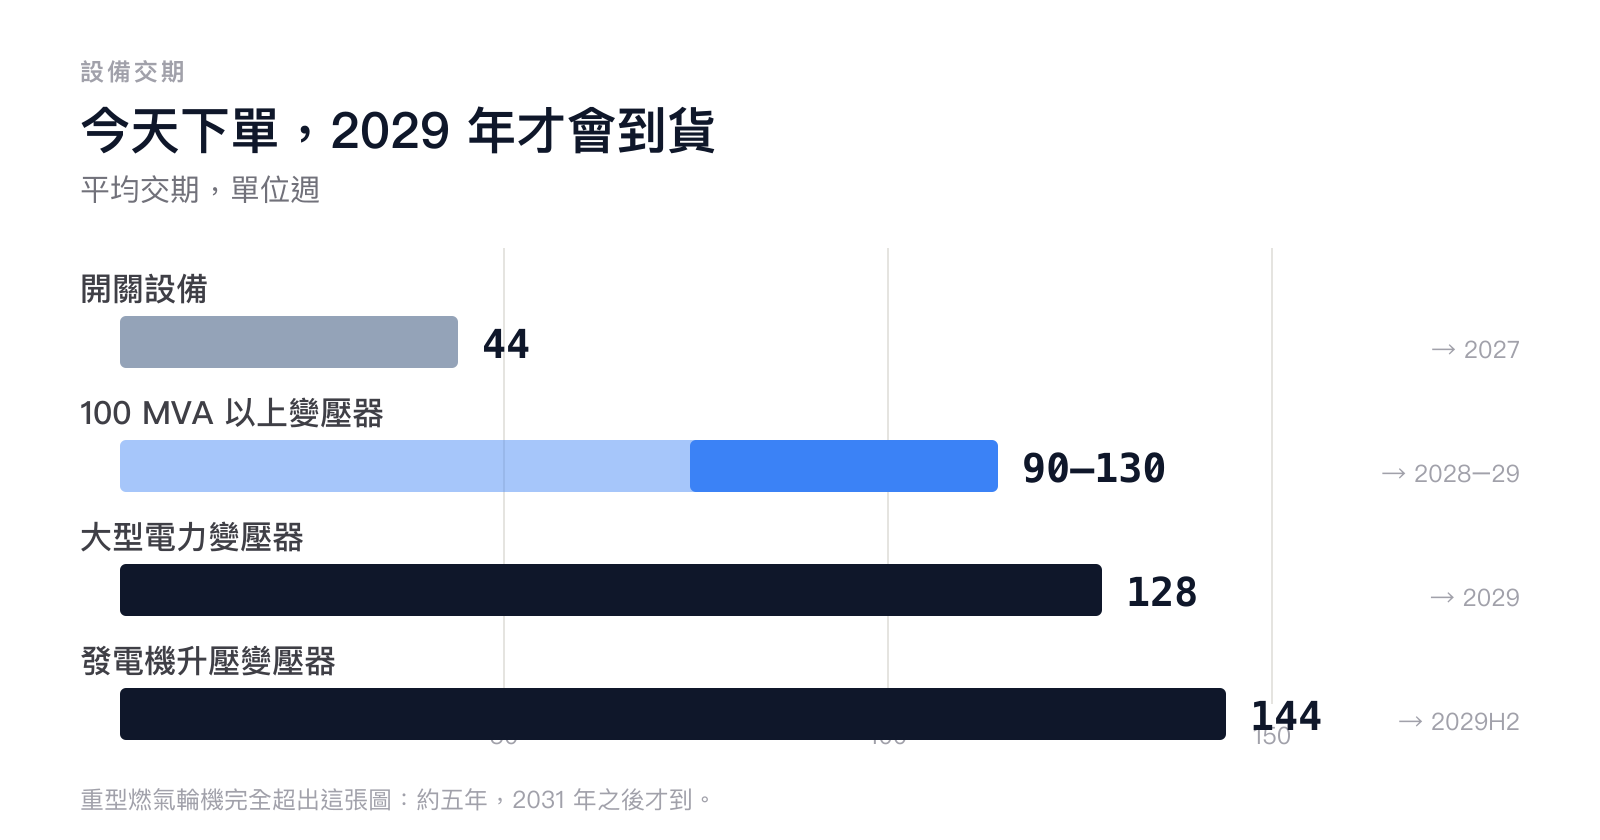
圖 4|交期才是這一輪真正的計價單位,不是價格。重型燃氣輪機約五年,已經超出這張圖的範圍。(POWER Magazine、美國能源部/LearnInvest 整理)
擴不出來的三個原因
第一,美國自己做不出來。根據能源部向國會提交的報告,60 MVA 以上的大型變壓器,超過八成的新增機組仰賴進口。
第二,上游卡在一種鋼。變壓器的鐵芯需要一種特殊的電磁鋼片,最薄的那個等級在美國只有 Cleveland-Cliffs 的賓州 Butler Works 一座廠在生產。它有一個 1.7 億美元的擴產計畫,但要到 2028 年才完工。而進口的電工鋼要面對 50% 關稅,2025 年還把範圍擴大到鐵芯和疊片,等於把替代路徑也一起封住。
第三,也是最難解的,變壓器的線圈到今天還是靠人工繞。全美大約 1.5 萬名技術工人在做這件事。這不是蓋一條產線就能補上的,要花好幾年訓練。
那自己發電繞過電網呢?
這條路也在排隊,而且隊伍更短、位置更少。
全世界能做重型燃氣輪機的只有三家。GE Vernova 的燃氣輪機在手訂單累積到 116 GW,交機時段賣到 2030 年。三菱重工在今年 7 月公開表示,輪機交付需要五年,訂單滿到 2030 年,目前正在簽 2031 到 2034 年的交機。西門子能源的燃氣在手訂單是 69 GW,大型機組年產能 35 台、2027 年再加 15 台,對上的是大約 120 GW 的年度市場。
柴油與燃氣發電機組那一側也一樣。Caterpillar 的發電機訂單已經排到 2030 年,Cummins 的大型機組配額滑到 2028 年,交期落在 40 到 107 週。
今天動土的資料中心,不能指望靠新的重型機組供電。
連簽了約的也不一定來得了。國際能源總署統計,資料中心簽下的確定型購電合約約 13 GW,有條件的承購協議約 44 GW,後者幾乎全押在還沒蓋出來的小型模組化核反應爐。
至於大家為什麼都往燃氣擠,看尖峰就知道。德州冬季用電最高的那 1% 時段,天然氣平均供應 41 GW,風電 9 GW、太陽能 5 GW。新的大型用電要在最冷的那幾個小時也供得上電,目前能撐住尖峰的主要還是燃氣。
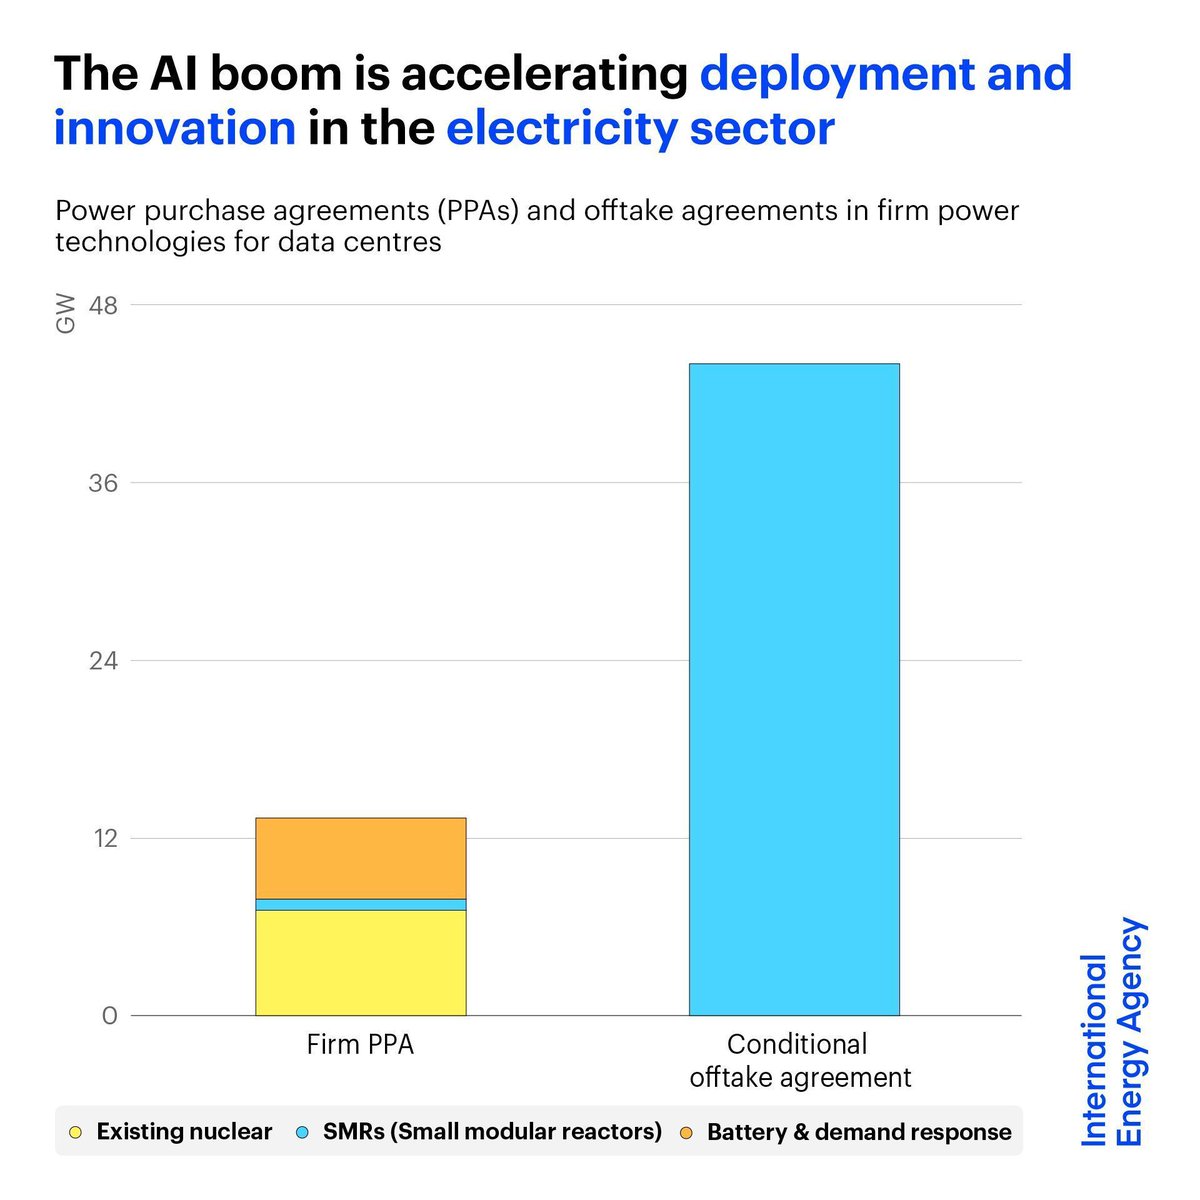
圖 5|有條件的承購協議是確定型購電合約的三倍多。簽了約,不等於電會來。(國際能源總署)
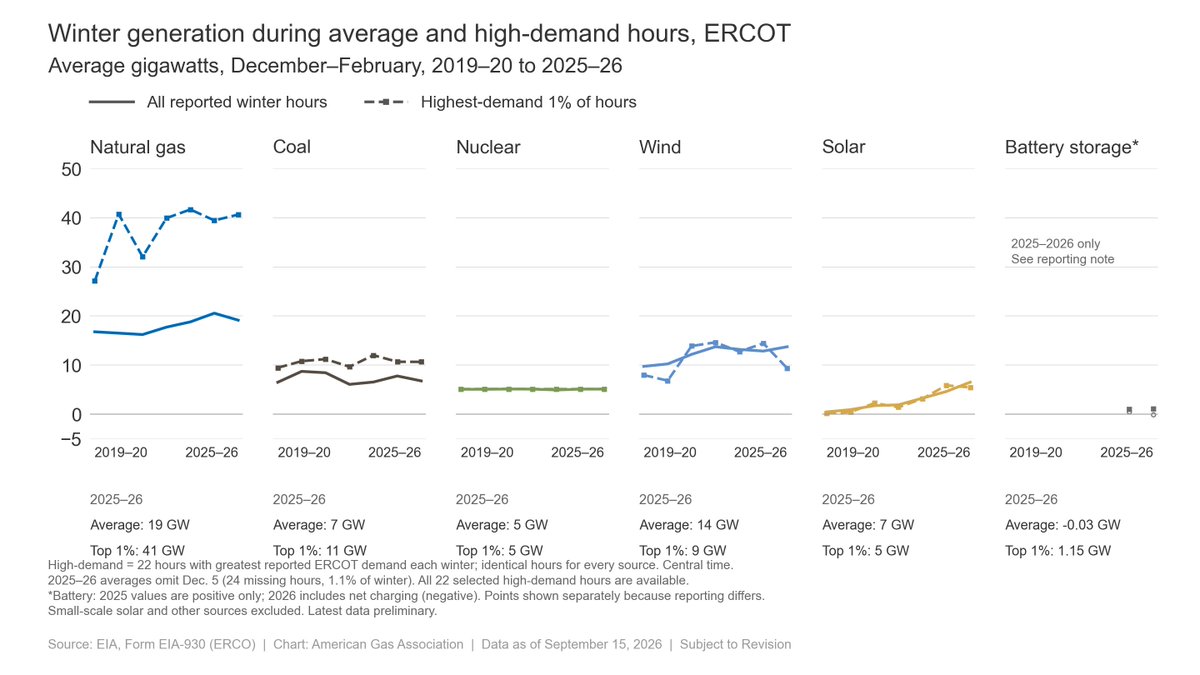
圖 6|冬季用電最高的那 1% 時段,撐住德州電網的主要是天然氣。新增的負載最後要靠什麼接,看的是尖峰由誰在撐。(美國能源資訊署 EIA-930;American Gas Association 製圖)
而且這件事不只發生在德州
柏克萊實驗室每年會把全美 50 幾家電網業者的併網排隊資料整理成一份報告,涵蓋全美約 98% 的既有發電容量。截至 2025 年底,全美有大約 8,200 個案子在排隊,合計 1,312 GW 的發電容量加上 749 GW 的儲能。
2025 年排隊中的天然氣發電容量成長 86%,來到 253 GW。同一年,太陽能減少 19%、儲能減少 16%、風電減少 19%。
所有人都在往同一個方向跑:找一個不用等電網的方法。而燃氣輪機的交機排到 2030 年之後,就是這股需求的另一面。
限制也不只來自電網。根據產業追蹤統計,截至 9 月 1 日,全美已經通過的地方性資料中心暫停令超過 300 件,落在這些限制範圍內的園區約 20 GW;紐約州的全州行政命令又卡住約 0.8 GW。能具體算出被延後的容量保守估計約 2.3 GW,而且德州和賓州還沒算進去。
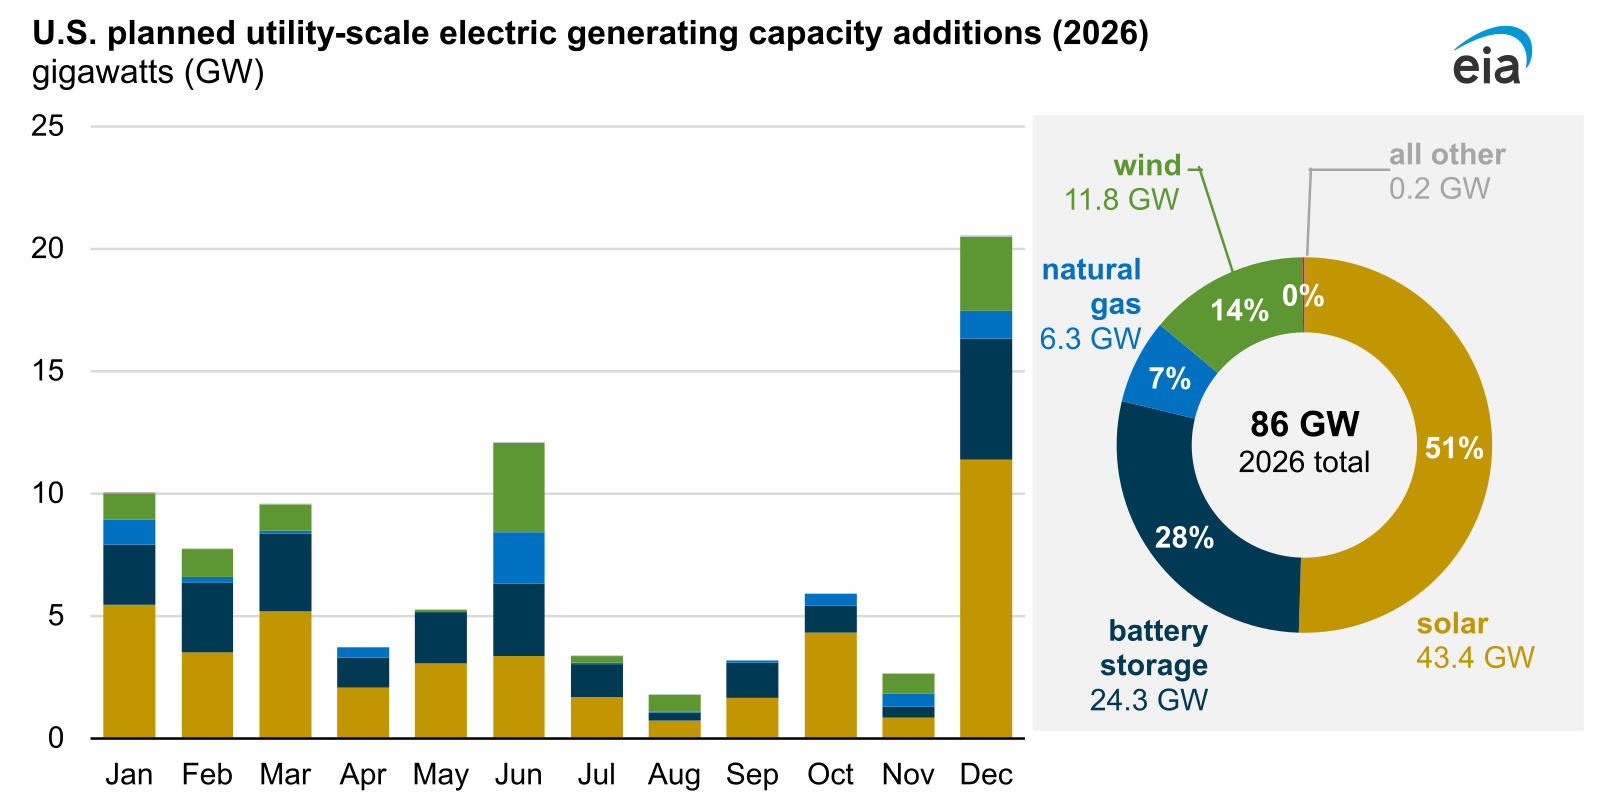
圖 7|2026 年美國計畫新增的發電裝置容量創紀錄,達 86 GW。其中儲能 24 GW,是第二大來源。這也是為什麼後面那道稅法規則打到儲能,影響會這麼直接。(美國能源資訊署 Today in Energy,2026 年 2 月)
▋ 需求到底有多真?
這些交期聽起來像產業抱怨。但把需求端的數字攤開,會發現它們是同一件事的兩面。
先看用量。一個串接各家模型的第三方平台,每週處理的 token 從一年前的 4.6 兆增加到 113 兆,一年約 25 倍,最近四週又翻了一倍。這只是一個平台的數字,不能代表整個市場,但方向很清楚,用量沒有在放慢。
用量最後都會變成用電。國際能源總署估計,AI 資料中心的用電 2025 年增加約 50%,到 2030 年還會再成長到 2025 年的三倍。而這個成長落在美國特別重:資料中心已經用掉美國約 5% 的發電量,全球平均只有 1.5%。
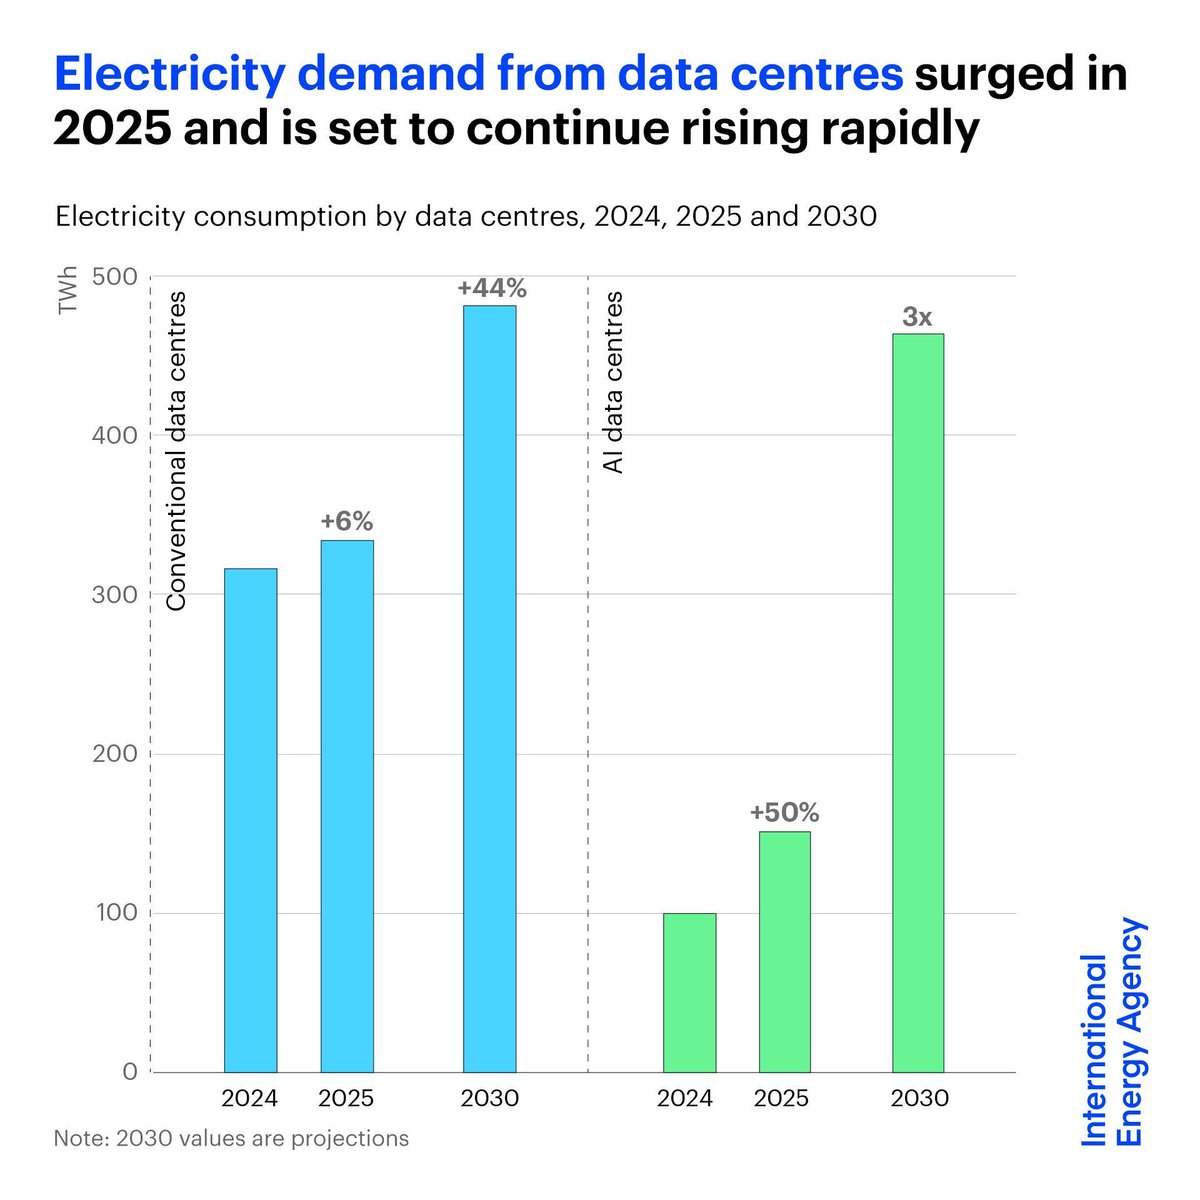
圖 8|AI 資料中心的用電 2025 年增加約 50%,2030 年預估再成長到 2025 年的三倍;傳統資料中心同一段時間約增加 44%。(國際能源總署)
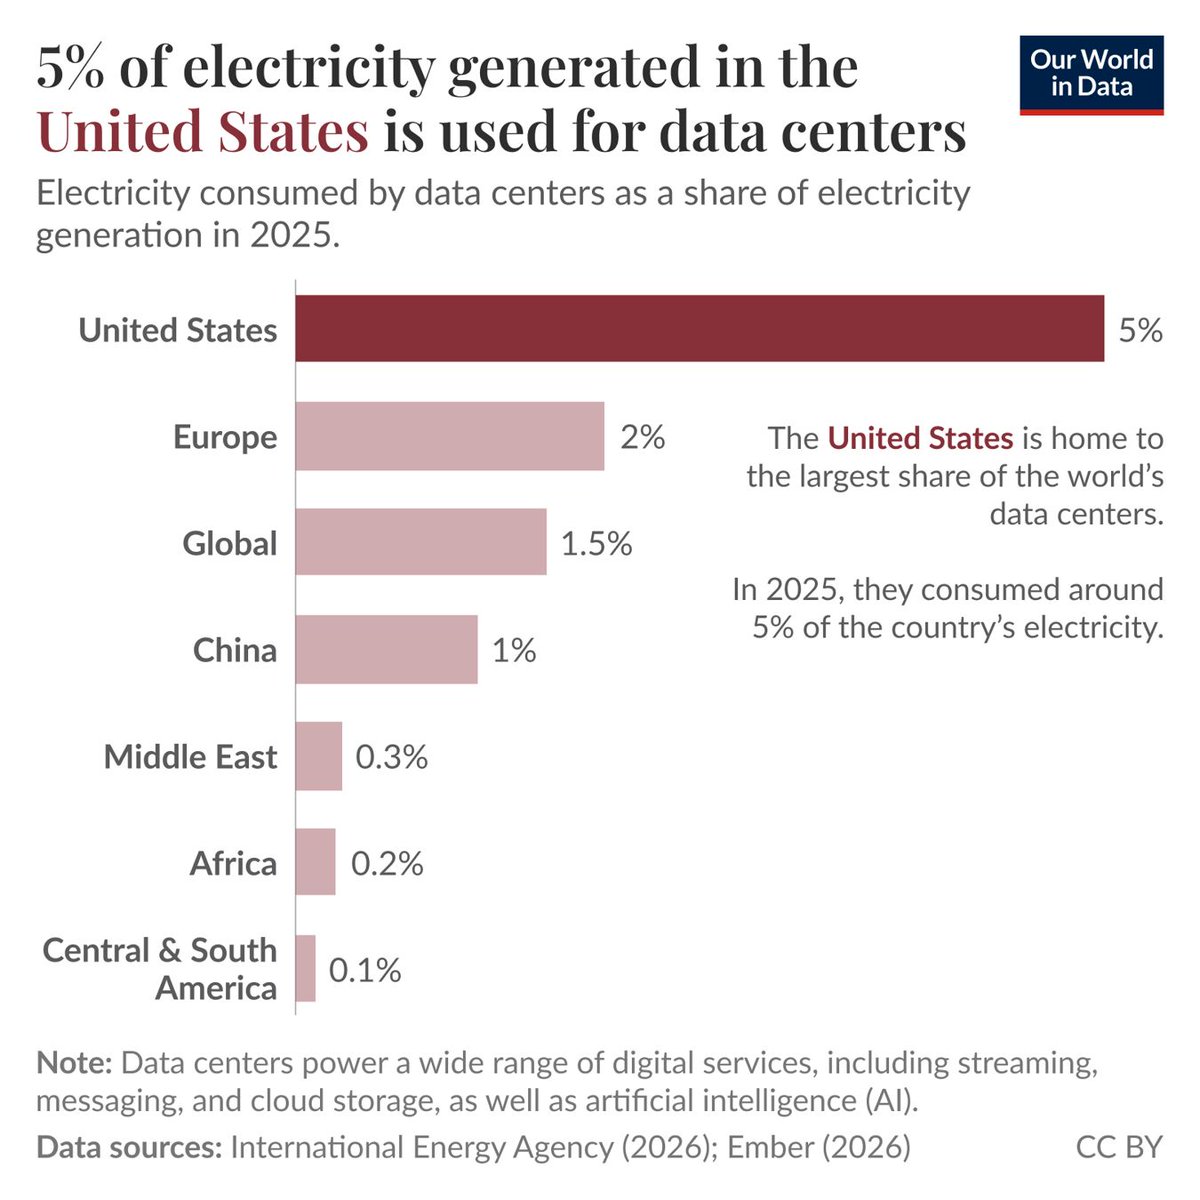
圖 9|2025 年資料中心用電佔發電量的比例,美國約 5%,歐洲約 2%,中國約 1%。同樣的成長率,落在美國電網上的份量最重。(Our World in Data,資料源為國際能源總署與 Ember,CC BY)
再看設備商。Eaton 在第二季法說會上說,美國資料中心的訂單總量相當於 307 GW,以 2025 年的建置速度計算,是 15 年的工作量。同一季它的資料中心營收年增 65%,手上還沒出貨的訂單年增 103%。而它每接到 1.2 元的新訂單,才出得了 1 元的貨,美洲地區更高,是 1.3 比 1。接單比出貨快,代表訂單還在越積越多。
GE Vernova 第二季新接訂單 242 億美元、年增 88%,在手訂單累積到 1,760 億美元,接近它全年營收的四倍。它的電氣化部門設備在手訂單年增 69%,單季資料中心訂單 27 億美元,上半年超過 50 億美元,已經是 2025 年全年的兩倍以上。
然後是 Caterpillar。
Caterpillar 第二季在手訂單創紀錄 721 億美元,年增 92%。同一份財報,它的工廠支出年增 4%。
訂單簿一年幾乎翻倍,蓋工廠的錢只多花了 4%。這兩個數字寫在同一頁上,它們之間的差距就是這一輪 AI 電力投資真正的故事。
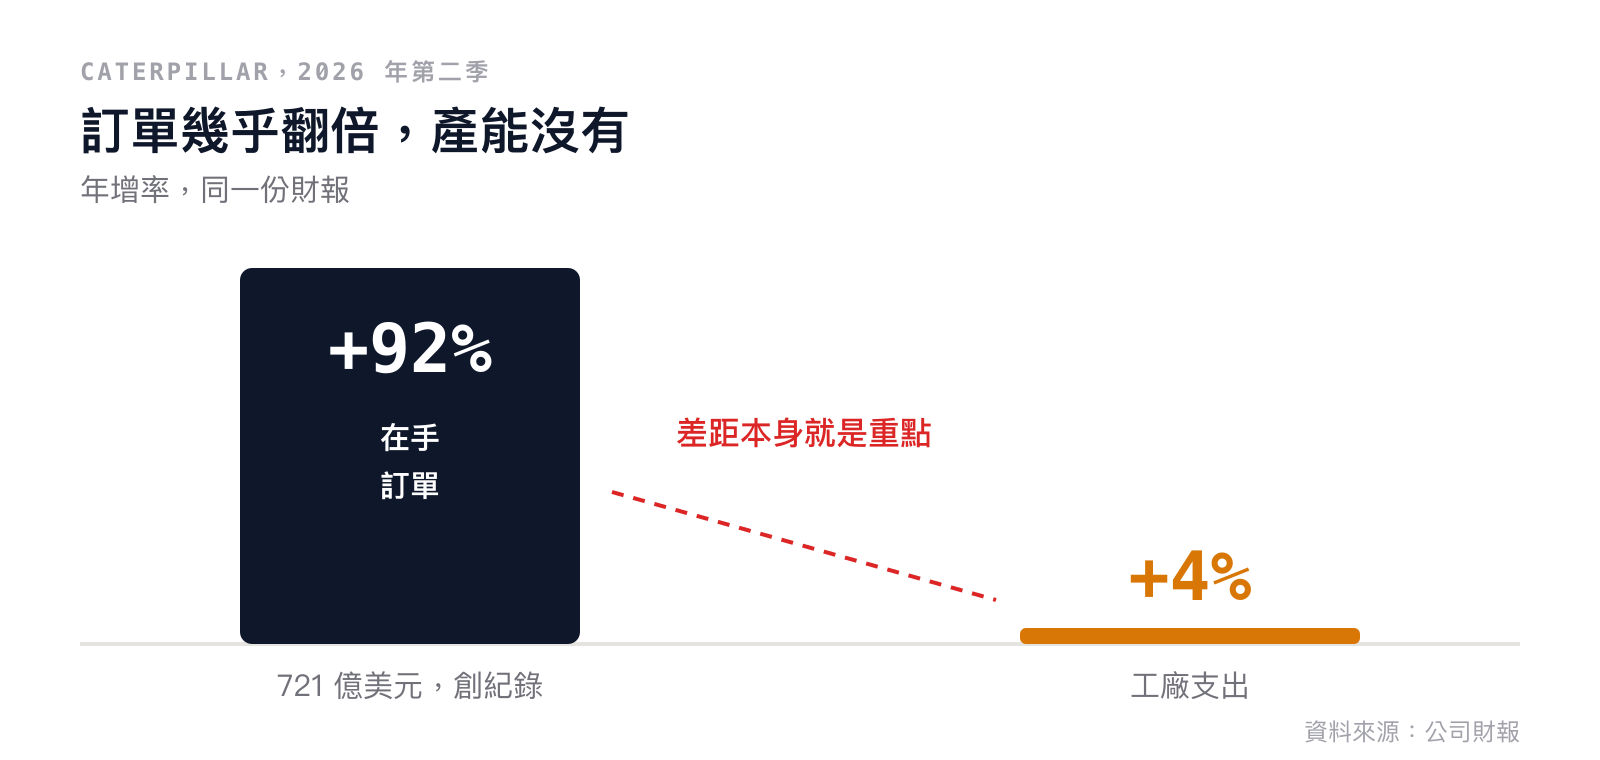
圖 10|需求端和供給端的差距,就寫在同一張財報裡。(公司財報/LearnInvest 整理)
而 GE Vernova 自己也說明,那 1,760 億美元的在手訂單,營收大部分要落在 2028 年之後才會認列。
▋ 一座 1 GW 的資料中心,到底要買多少東西?
這些數字分開看都有感覺,合起來才知道規模。所以我自己算一次,假設全部攤開,你可以換數字重算。
一座 1 GW 的設施,整體用電大約是運算用電的 1.2 倍,剩下的 0.2 用在散熱和照明這些地方。所以實際的運算負載大約 833 MW。以 GB200 機櫃每櫃約 132 kW 計算,這座資料中心裡會有大約 6,300 個機櫃。
變壓器的部分,可以參照一個實際案例:CloudHQ 在伊利諾州一座 225 MW 的園區,在新建的變電所裡配置了 4 台 100 MVA 變壓器。按同樣比例放大到 1 GW,需要大約 1,780 MVA 的變壓容量,也就是 18 台 100 MVA 等級的主變壓器。
而 100 MVA 以上的變壓器,交期是 90 到 130 週。

圖 11|這是我自己算的,假設已在文中列明,你可以換數字重算。而今天全球規劃中的 1 GW 級園區不只一座,這些 18 台一組的變壓器全部要排在同一條隊伍裡。(公開成本指南、實際案例與作者計算/LearnInvest 整理)
運算設備的錢是變壓器的三倍以上,但運算設備的交期是變壓器的十分之一。錢多的那一項不是瓶頸,錢少的那一項才是。
▋ 8 月 26 日那道命令,實際管到哪一層?
德州那件事發生後三週,美國以國家安全為由發布行政命令,把接上電網的高壓設備納入管制。
適用範圍是 69 kV 以上的輸電設施,以及維持系統可靠度所需的發電設備。地方配電不在裡面。
涵蓋的品項比市場最初的理解要寬。除了變壓器、斷路器、併網逆變器、儲能系統、發電機這些硬體之外,命令明文把這些設備的軟體、韌體、遠端存取能力與維護機制一併納入。
換句話說,它管的不只是這台設備是誰做的,還包括這台設備未來由誰維護。一台變壓器可以在美國組裝,但如果它的監控模組要靠境外伺服器更新,或者遠端診斷由境外團隊負責,它一樣落在命令描述的風險裡。
然後是關鍵的一點:命令沒有列出任何國家名單。
誰算受限制的對象、哪些設備要特別審查、許可程序怎麼走,全部留給能源部在 120 天內公布,也就是 12 月 24 日之前。
能源部 9 月 9 日已經發出公開徵詢,10 月 9 日截止收意見,題目裡明列了電池儲能。還有一條比外界注意到的更重要:對已經裝在電網上的設備,能源部長可以要求持續監控、實體或網路隔離,甚至汰換或拆除。
把時間軸排開來看:7 月 22 日德州創下用電紀錄,8 月 3 日州長凍結 474 GW 的申請,8 月 26 日聯邦發布命令但規則未定,10 月 9 日能源部徵詢截止,12 月 10 日德州查核預定完成,12 月 24 日能源部細則預定公布。
一個月之內,從創紀錄到踩剎車到國安管制。而現在距離規則出爐還有三個月。在這三個月裡,每一份 2029 年交貨的合約,都是在不知道規則長什麼樣的情況下簽的。
▋ 為什麼我認為市場看錯了方向?
如果只看 8 月那道命令,會得到一個規則還沒寫、所以還有時間的結論。這個結論是錯的。
會員內容接著回答:
- 市場的注意力都在變壓器,為什麼我認為真正的風險在別的地方?
- 雲端巨頭今年已經發了 2,187 億美元公司債,9 月 16 日升息之後,誰先受影響?
- 1999 年光纖那一輪,哪些地方和今天一樣,哪些不一樣?
- 台灣廠商站在這條鏈的兩端,哪一端的位置守得比較久?
- 三個附驗證時點的預測、五個可以自己追蹤的數字,以及八個環節、約 50 家公司的供應鏈全圖。
會員內容由此開始
From the Texas grid and a federal order to a 50-company supply chain: where the AI power bottleneck actually sits
Monthly · September 2026
The interconnection requests waiting to join the Texas grid add up to more than five times the highest load that grid has ever carried.
So the governor of Texas told them all to stop.
This happened on August 3. He wrote to the state's two power authorities and asked for a case-by-case review of every data center in the queue. Until that review is done, nobody moves forward.
The volume held up is 474 GW. Eleven days earlier, on July 22, the Texas grid had just set an all-time peak demand record of 91.1 GW, 6% above the previous record set in 2023.
About 90% of the requests in the queue come from data centers.
Texas has been the most welcoming place in America for data centers. Cheap power, light regulation, plenty of land. It hitting the brake first does not mean Texas changed. It means the scale of this thing has outgrown what the existing process can handle.
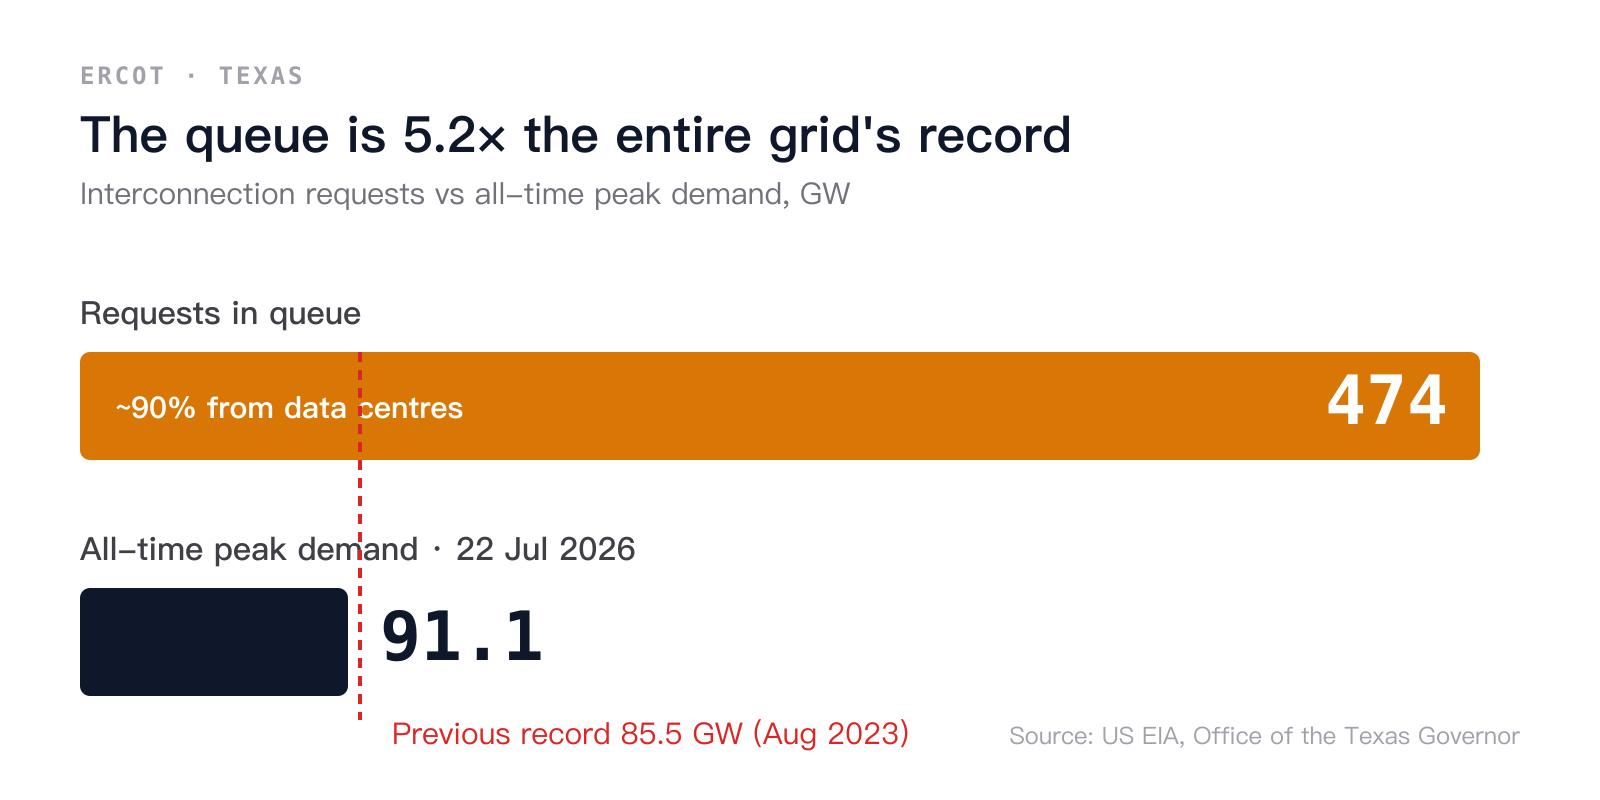
Figure 1 | The queue is more than five times the highest load in this grid's history, and roughly 90% of it comes from data centers. (U.S. Energy Information Administration, Office of the Texas Governor / LearnInvest)
▋ Eight Questions This Monthly Report Answers
The subject this month is power, but the point is not a shortage of electricity. A handful of things that happened in August turned AI's power problem from a procurement problem into a queueing problem. The first four questions are free to read; from the fifth on, it is member content.
- Q1 | Why did Texas tell everyone to stop?How much of the 474 GW is real, what the review checks, and when it finishes.
- Q2 | Even if you are allowed to connect, can you buy the equipment?Lead times for transformers, gas turbines and gensets, and why capacity cannot expand.
- Q3 | What does a 1 GW data center actually have to buy?Racks, transformers and lead times, worked through line by line.
- Q4 | What does the August 26 executive order actually reach?Which equipment it covers, when the rules arrive, and whether installed equipment is exposed.
- Q5 | Why do I think the market is looking in the wrong place?Everyone is watching transformers. Which link actually has no substitute?
- Q6 | Where is this money being borrowed from, and what changes now that rates are rising?Corporate bonds, off-balance-sheet financing, two sets of books, and who feels the September 16 hike first.
- Q7 | Which two kinds of money does Taiwan earn?Inside the rack and on the grid side: where each position comes from and how long it lasts.
- Q8 | Once the equipment arrives, will it actually run?Three problems AI data centers hit in commissioning.
At the end there are three predictions with verification dates, five numbers you can track yourself, and a full map of the supply chain: eight links and about 50 companies.
One more thing. July's report was about the pricing-power argument in AI infrastructure. August's was about a fund that went from adding capital to cutting risk in six days. This month is power. The three subjects look unrelated, but they are three faces of the same thing: the AI story is running ahead of the AI economics. July was pricing power not yet settled, August was leverage that could not survive the path, and this month is the gap between physical delivery and financing. I will keep writing this line.
▋ Why Did Texas Tell Everyone to Stop?
Because most of these requests are not real.
To keep their options open, developers routinely file at several sites at once, then decide which one to build after financing, land or a customer firms up. For a developer this is sensible risk management. It costs very little and it is worth a lot.
For a grid planner, it means the list on the desk cannot be used. You do not know how much transmission to build over the next decade, or how much substation capacity to prepare, because you cannot tell which requests are real.
The review is broader than it first sounded. ERCOT is surveying 461 data centers in total, 247 large ones at 75 MW or more and 214 medium ones between 25 and 75 MW. The questionnaire runs to about 130 questions covering local financial assistance, whether the site can generate its own power, water and cooling, community impact, and who ultimately owns it.
Water is the item most often underestimated. Lawrence Berkeley National Laboratory estimates that US data centers together use about 48 million gallons of water a day on site, but the electricity they buy uses about 578 million gallons a day at the power plant, twelve times as much, and that sits on the electricity sector's ledger. The same data center carries a very different water footprint depending on whether it is supplied by a gas plant or by wind and solar. It is no surprise the review gives water and cooling a category of its own.
The target is to finish by December 10. ERCOT officials have already said publicly that a related study originally due in April 2027 cannot be completed on schedule, and that a new timeline is still under discussion. The deadline for the first 231 large loads to respond is September 23, and the full questionnaire is due by mid-October.
Only 362 large-load projects, totalling 191.8 GW, made it into the first study batch. Another 373 projects, asking for more than 300 GW, did not make the first batch at all. The large loads that have actually finished stability assessments and are due online later this year number just 17, mostly data centers, with a combined peak of about 6.6 GW over five years.
Figure 2 | The official version of the same event. The July 22 peak lifted the previous record by 6%. (U.S. Energy Information Administration, Today in Energy, August 2026)
Figure 3 | Twenty years of generation on the Texas grid. Wind and solar grew fastest, but natural gas still carries this grid today. (ERCOT)
▋ Even If You Are Allowed to Connect, Can You Buy the Equipment?
No.
The average lead time for a large power transformer is 128 weeks. Order today and it arrives in 2029. Generator step-up transformers take longer, 144 weeks. Switchgear is faster, and still starts at 44 weeks.
This is not a price problem. Since 2019, power transformer prices are up about 77%, step-up transformers 45%, and some classes of distribution transformer close to 95%. Over the same period, U.S. demand for power transformers grew 116% and demand for step-up transformers grew 274%.
Prices up almost 80% and the lead time is still two and a half years. That tells you capacity genuinely cannot expand.
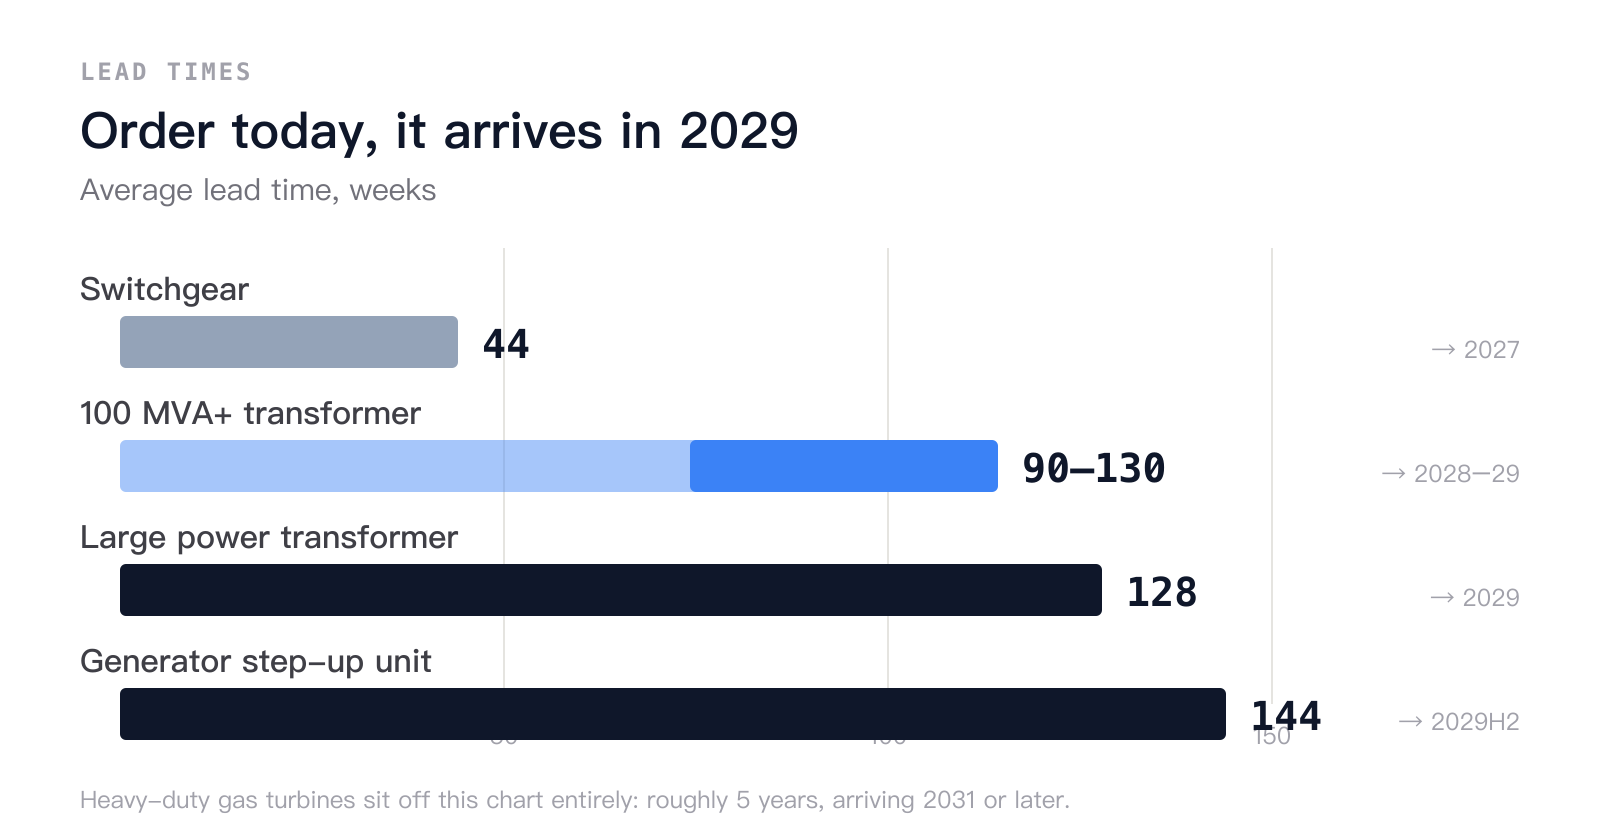
Figure 4 | Lead time, not price, is the real unit of account in this cycle. Heavy-duty gas turbines run about five years and are already off the right edge of this chart. (POWER Magazine, U.S. Department of Energy / LearnInvest)
Three Reasons Capacity Cannot Expand
First, America cannot make them. According to a Department of Energy report to Congress, more than 80% of new large transformer units above 60 MVA depend on imports.
Second, the upstream bottleneck is a type of steel. Transformer cores need a special grain-oriented electrical steel, and the thinnest grade is produced in the United States at a single plant, Cleveland-Cliffs' Butler Works in Pennsylvania. It has a $170 million expansion, but that will not be finished until 2028. Imported electrical steel faces a 50% tariff, and in 2025 the scope was widened to cover cores and laminations, which closes off the substitute route as well.
Third, and hardest to fix, transformer coils are still wound by hand. About 15,000 skilled workers in the United States do this work. You cannot solve that by building a production line. It takes years of training.
What About Generating Your Own Power Instead?
That route is also a queue, and a shorter one with fewer places in it.
Only three companies in the world build heavy-duty gas turbines. GE Vernova's gas turbine backlog has reached 116 GW, with delivery slots sold into 2030. Mitsubishi Heavy Industries said publicly in July that turbine delivery takes five years, that its order book is full through 2030, and that it is now signing slots for 2031 to 2034. Siemens Energy's gas backlog is 69 GW, with annual capacity of 35 large units and another 15 to be added in 2027, against an annual market of roughly 120 GW.
The diesel and gas genset side is the same. Caterpillar's generator orders are booked into 2030, and Cummins' large unit allocation has slipped into 2028 with lead times of 40 to 107 weeks.
A data center breaking ground today cannot count on new heavy equipment to power it.
Even signed contracts do not guarantee delivery. The International Energy Agency counts about 13 GW of firm power purchase agreements signed by data centers, against about 44 GW of conditional offtake agreements, almost all of it tied to small modular reactors that have not been built.
The peak explains why everyone is crowding into gas. In the highest-demand 1% of winter hours on the Texas grid, natural gas supplies an average of 41 GW, against 9 GW from wind and 5 GW from solar. A large new load has to be served in the coldest hours too, and today the peak is still carried mainly by gas.
Figure 5 | Conditional offtake agreements are more than three times the firm power purchase agreements. A signed contract is not the same as power arriving. (International Energy Agency)
Figure 6 | In the highest-demand 1% of winter hours, natural gas carries most of the Texas grid. What new load ultimately leans on depends on who carries the peak. (U.S. Energy Information Administration EIA-930; chart by the American Gas Association)
And This Is Not Only Texas
Berkeley Lab compiles interconnection queue data from more than 50 U.S. grid operators each year, covering about 98% of existing U.S. generating capacity. As of the end of 2025, roughly 8,200 projects were in the queue nationwide, totalling 1,312 GW of generation plus 749 GW of storage.
In 2025, gas generation capacity in the queue grew 86% to 253 GW. In the same year, solar fell 19%, storage fell 16% and wind fell 19%.
Everybody is running in the same direction: find a way that does not require waiting for the grid. And gas turbine slots being sold out past 2030 is the other side of that same demand.
The limits do not only come from the grid either. According to industry tracking, as of September 1 more than 300 local data center moratoriums had been enacted across the United States, covering about 20 GW of campuses inside restricted boundaries, and New York's statewide order is holding up another 0.8 GW. The capacity that can be specifically counted as delayed is at least about 2.3 GW, and that is before Texas and Pennsylvania are included.
Figure 7 | Planned U.S. generating capacity additions hit a record 86 GW in 2026. Storage accounts for 24 GW of that, the second largest source. This is also why the tax rule discussed later, which lands on storage, has such a direct effect. (U.S. Energy Information Administration, Today in Energy, February 2026)
▋ How Real Is the Demand?
These lead times sound like an industry complaint. Lay the demand-side numbers out and you find they are two sides of the same thing.
Start with usage. A third-party platform that routes requests across many model providers processed 113 trillion tokens a week, up from 4.6 trillion a year earlier, about 25 times, and it doubled again in the last four weeks. That is one platform and cannot stand for the whole market, but the direction is clear: usage is not slowing.
Usage ends up as electricity. The International Energy Agency estimates electricity use by AI data centers rose about 50% in 2025 and will triple from the 2025 level by 2030. The weight falls hardest on the United States, where data centers already use about 5% of all electricity generated, against a global average of 1.5%.
Figure 8 | Electricity use by AI data centers rose about 50% in 2025 and is projected to triple from the 2025 level by 2030, against roughly 44% growth for conventional data centers over the same period. (International Energy Agency)
Figure 9 | Data center electricity as a share of generation in 2025: about 5% in the United States, about 2% in Europe and about 1% in China. The same growth rate weighs most heavily on the US grid. (Our World in Data, based on International Energy Agency and Ember data, CC BY)
Then look at the equipment makers. Eaton said on its second-quarter call that total U.S. data center orders amount to 307 GW, which at the 2025 build rate is 15 years of work. In the same quarter its data center revenue grew 65% year on year and its unshipped order book grew 103%. For every $1.20 of new orders it takes in, it ships $1.00, and in the Americas the ratio is 1.3 to 1. Booking faster than shipping means the backlog is still building.
GE Vernova booked $24.2 billion of new orders in the second quarter, up 88%, and its backlog reached $176 billion, close to four times its annual revenue. Equipment backlog in its electrification segment grew 69%, data center orders were $2.7 billion in the quarter and more than $5 billion in the first half, already more than double the full year of 2025.
And then there is Caterpillar.
Caterpillar's second-quarter backlog hit a record $72.1 billion, up 92% year on year. In the same report, its factory spending rose 4%.
The order book nearly doubled in a year and the money spent on building factories went up 4%. Those two numbers are printed on the same page, and the distance between them is the real story of this round of AI power investment.
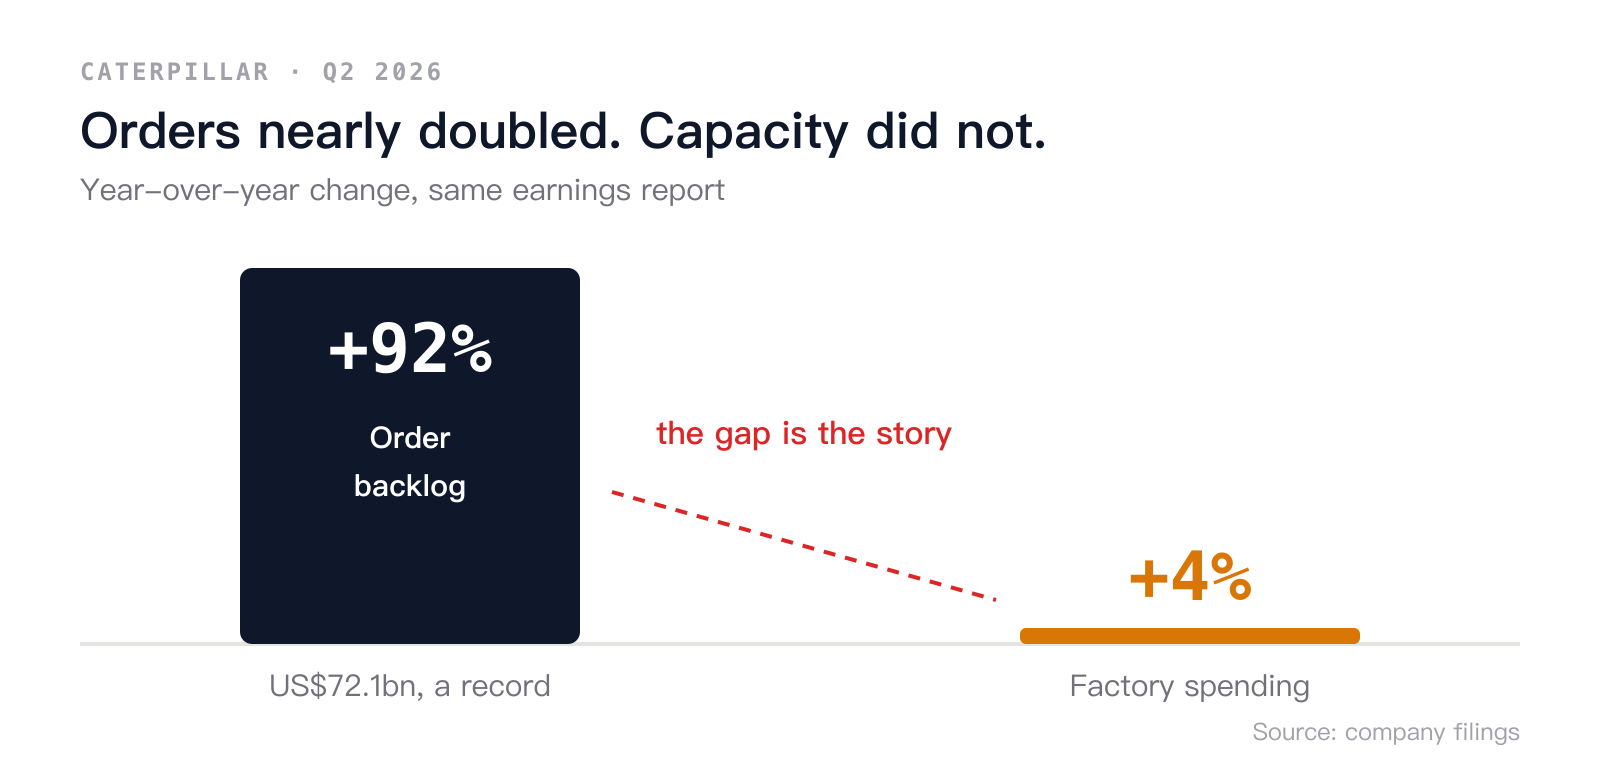
Figure 10 | The gap between the demand side and the supply side is written into the same set of financial statements. (Company filings / LearnInvest)
GE Vernova also states that most of the revenue from that $176 billion backlog will not be recognized until after 2028.
▋ What Does a 1 GW Data Center Actually Have to Buy?
Each of these numbers means something on its own. Put them together and you get the scale. So here is my own calculation, with the assumptions on the table, and you can change them and redo it.
A 1 GW facility draws about 1.2 times its compute load in total, with the other 0.2 going to cooling, lighting and the rest. So the actual compute load is about 833 MW. At about 132 kW per GB200 rack, this data center holds roughly 6,300 racks.
For transformers, there is a real case to anchor on. CloudHQ's 225 MW campus in Illinois installed four 100 MVA transformers in its new substation. Scaled to 1 GW on the same ratio, you need about 1,780 MVA of transformer capacity, which is 18 main transformers in the 100 MVA class.
And transformers above 100 MVA have lead times of 90 to 130 weeks.
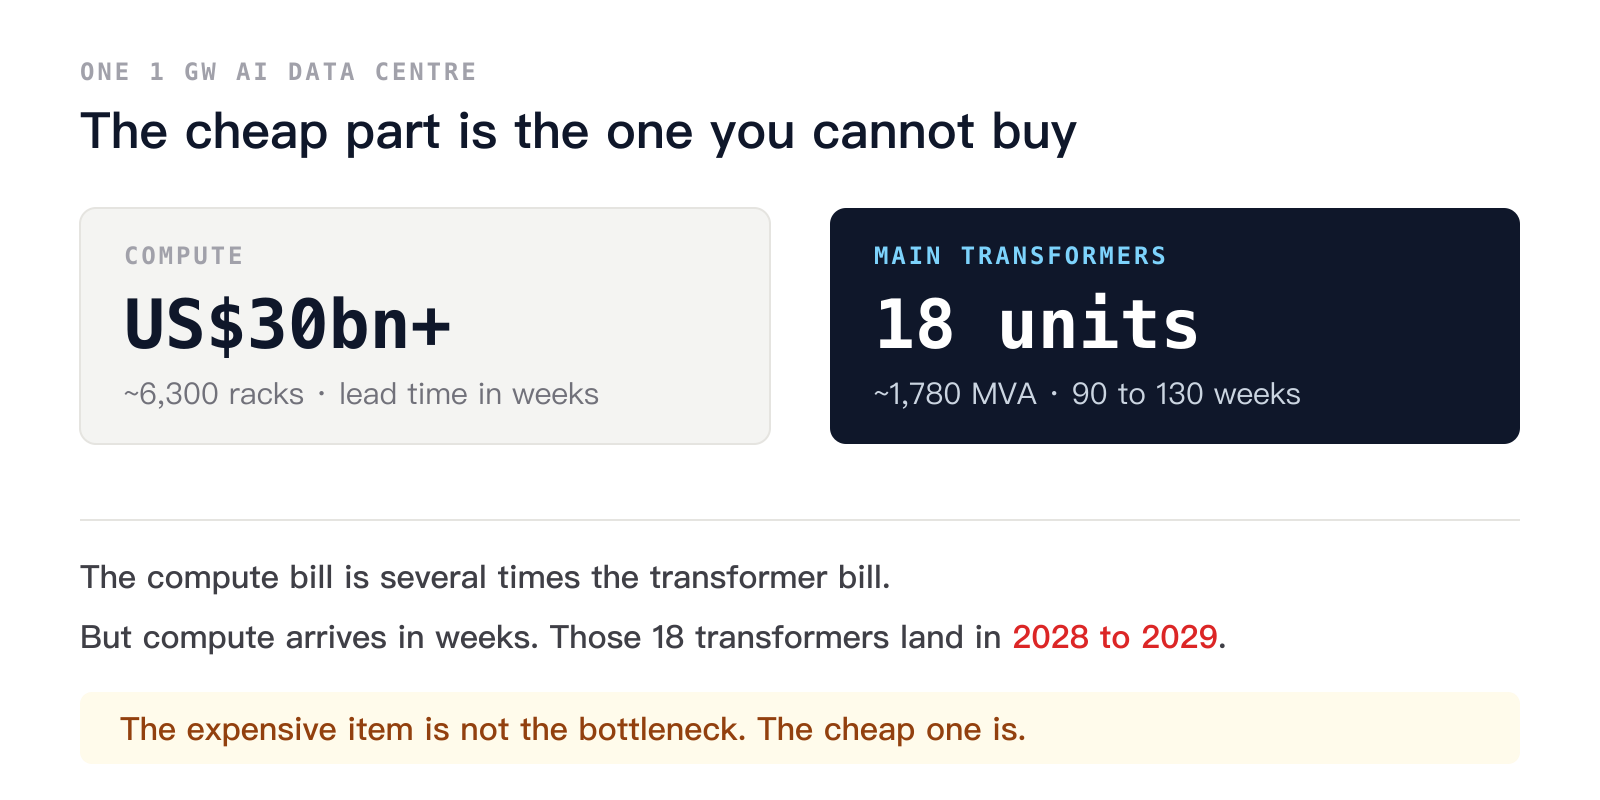
Figure 11 | This is my own calculation with the assumptions stated in the text, and you can change the numbers and redo it. There is more than one 1 GW campus in planning worldwide today, and every one of those sets of 18 transformers has to stand in the same queue. (Public cost guides, project case studies and author calculation / LearnInvest)
The compute equipment costs more than three times what the transformers cost, but the compute equipment takes one tenth of the lead time. The expensive item is not the bottleneck. The cheap one is.
▋ What Does the August 26 Order Actually Reach?
Three weeks after Texas, the United States issued an executive order on national security grounds that brings high-voltage equipment connected to the grid under control.
The scope is transmission facilities at 69 kV and above, plus generating equipment needed to maintain system reliability. Local distribution is not included.
The list of covered items is broader than the market first understood. Beyond transformers, circuit breakers, grid-tied inverters, storage systems and generators, the order explicitly covers the software, firmware, remote access capability and maintenance arrangements attached to that equipment.
In other words, it governs not only who made the machine but who will maintain it. A transformer can be assembled in the United States, but if its monitoring module updates from an offshore server, or its remote diagnostics are handled by an offshore team, it still sits inside the risk the order describes.
And then the key point: the order names no countries.
Who counts as a restricted party, which equipment gets heightened review and how the licensing process works are all left to the Department of Energy to publish within 120 days, meaning before December 24.
The Department of Energy opened a request for information on September 9, with comments due October 9, and battery storage is named explicitly in its questions. One provision deserves more attention than it has had: for equipment already installed on the grid, the Secretary can require ongoing monitoring, physical or network isolation, or replacement and removal.
Lay the timeline out: July 22, Texas sets a demand record. August 3, the governor freezes 474 GW of requests. August 26, the federal order lands with the rules undefined. October 9, the Department of Energy's consultation closes. December 10, the Texas review is due. December 24, the Department of Energy rules are due.
Inside one month, from record to brake to national security control. And there are still three months until the rules exist. During those three months, every contract for 2029 delivery is being signed without knowing what the rules will say.
▋ Why Do I Think the Market Is Looking in the Wrong Place?
If you only look at the August order, you conclude that the rules are not written yet, so there is still time. That conclusion is wrong.
The member section goes on to answer:
- Everyone is watching transformers. Why do I think the real risk sits somewhere else?
- The cloud giants have already issued $218.7 billion of bonds this year. Who feels the September 16 rate hike first?
- What lines up with the 1999 fiber buildout, and what does not?
- Taiwanese suppliers sit at both ends of this chain. Which position lasts longer?
- Three predictions with verification dates, five numbers you can track yourself, and a full map of eight links and about 50 companies.
Member content starts here
完整月報為會員內容
你已讀完免費預覽。登入 Pro 會員,接著閱讀完整研究與圖表。